
|
|||||
|
 | |
| |
| |
| |
| |
| |
|
Gene: ACTR3 |
Gene summary for ACTR3 |
| Gene information | Species | Human | Gene symbol | ACTR3 | Gene ID | 10096 |
| Gene name | actin related protein 3 | |
| Gene Alias | ARP3 | |
| Cytomap | 2q14.1 | |
| Gene Type | protein-coding | GO ID | GO:0000003 | UniProtAcc | B4DXW1 |
Top |
Malignant transformation analysis |
| Identification of the aberrant gene expression in precancerous and cancerous lesions by comparing the gene expression of stem-like cells in diseased tissues with normal stem cells |
| Entrez ID | Symbol | Replicates | Species | Organ | Tissue | Adj P-value | Log2FC | Malignancy |
| 10096 | ACTR3 | HTA11_3410_2000001011 | Human | Colorectum | AD | 2.88e-10 | -4.69e-01 | 0.0155 |
| 10096 | ACTR3 | HTA11_696_2000001011 | Human | Colorectum | AD | 2.35e-03 | -2.43e-01 | -0.1464 |
| 10096 | ACTR3 | HTA11_866_3004761011 | Human | Colorectum | AD | 1.15e-04 | -3.96e-01 | 0.096 |
| 10096 | ACTR3 | HTA11_10711_2000001011 | Human | Colorectum | AD | 7.16e-04 | -4.44e-01 | 0.0338 |
| 10096 | ACTR3 | HTA11_7696_3000711011 | Human | Colorectum | AD | 1.25e-07 | -3.91e-01 | 0.0674 |
| 10096 | ACTR3 | HTA11_99999974143_84620 | Human | Colorectum | MSS | 1.93e-03 | -3.18e-01 | 0.3005 |
| 10096 | ACTR3 | A015-C-203 | Human | Colorectum | FAP | 1.16e-19 | -3.89e-01 | -0.1294 |
| 10096 | ACTR3 | A015-C-204 | Human | Colorectum | FAP | 7.67e-04 | -2.72e-01 | -0.0228 |
| 10096 | ACTR3 | A014-C-040 | Human | Colorectum | FAP | 3.13e-02 | -3.85e-01 | -0.1184 |
| 10096 | ACTR3 | A002-C-201 | Human | Colorectum | FAP | 9.53e-09 | -2.83e-01 | 0.0324 |
| 10096 | ACTR3 | A002-C-203 | Human | Colorectum | FAP | 3.70e-02 | -9.83e-02 | 0.2786 |
| 10096 | ACTR3 | A001-C-119 | Human | Colorectum | FAP | 2.90e-11 | -5.42e-01 | -0.1557 |
| 10096 | ACTR3 | A001-C-108 | Human | Colorectum | FAP | 2.01e-09 | -2.57e-01 | -0.0272 |
| 10096 | ACTR3 | A002-C-205 | Human | Colorectum | FAP | 2.32e-19 | -5.11e-01 | -0.1236 |
| 10096 | ACTR3 | A001-C-104 | Human | Colorectum | FAP | 2.64e-03 | -2.25e-01 | 0.0184 |
| 10096 | ACTR3 | A015-C-006 | Human | Colorectum | FAP | 2.21e-11 | -4.56e-01 | -0.0994 |
| 10096 | ACTR3 | A015-C-106 | Human | Colorectum | FAP | 6.74e-10 | -3.03e-01 | -0.0511 |
| 10096 | ACTR3 | A002-C-114 | Human | Colorectum | FAP | 5.36e-12 | -3.29e-01 | -0.1561 |
| 10096 | ACTR3 | A015-C-104 | Human | Colorectum | FAP | 2.52e-23 | -5.07e-01 | -0.1899 |
| 10096 | ACTR3 | A001-C-014 | Human | Colorectum | FAP | 1.44e-10 | -2.97e-01 | 0.0135 |
| Page: 1 2 3 4 5 6 7 8 9 10 |
| Tissue | Expression Dynamics | Abbreviation |
| Colorectum (GSE201348) |  | FAP: Familial adenomatous polyposis |
| CRC: Colorectal cancer | ||
| Colorectum (HTA11) |  | AD: Adenomas |
| SER: Sessile serrated lesions | ||
| MSI-H: Microsatellite-high colorectal cancer | ||
| MSS: Microsatellite stable colorectal cancer | ||
| Esophagus | 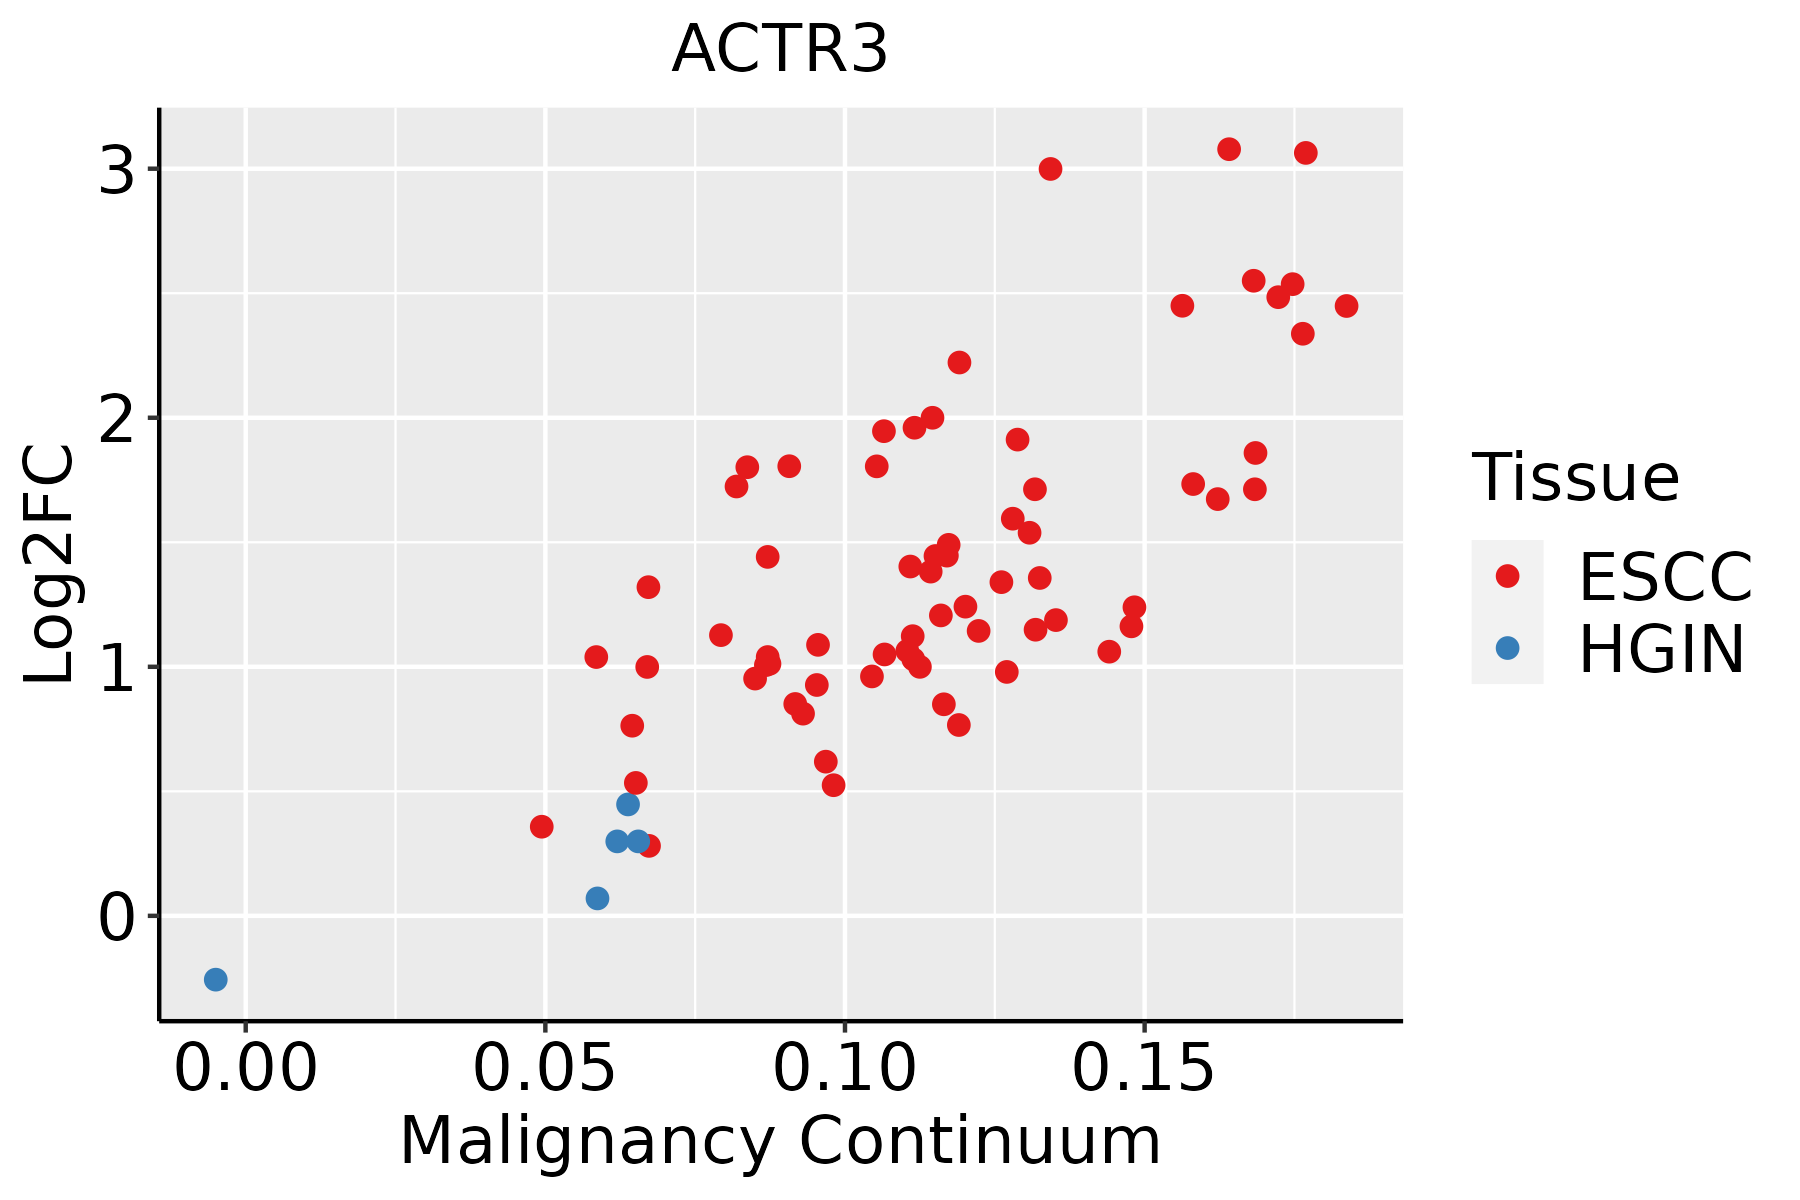 | ESCC: Esophageal squamous cell carcinoma |
| HGIN: High-grade intraepithelial neoplasias | ||
| LGIN: Low-grade intraepithelial neoplasias | ||
| Liver | 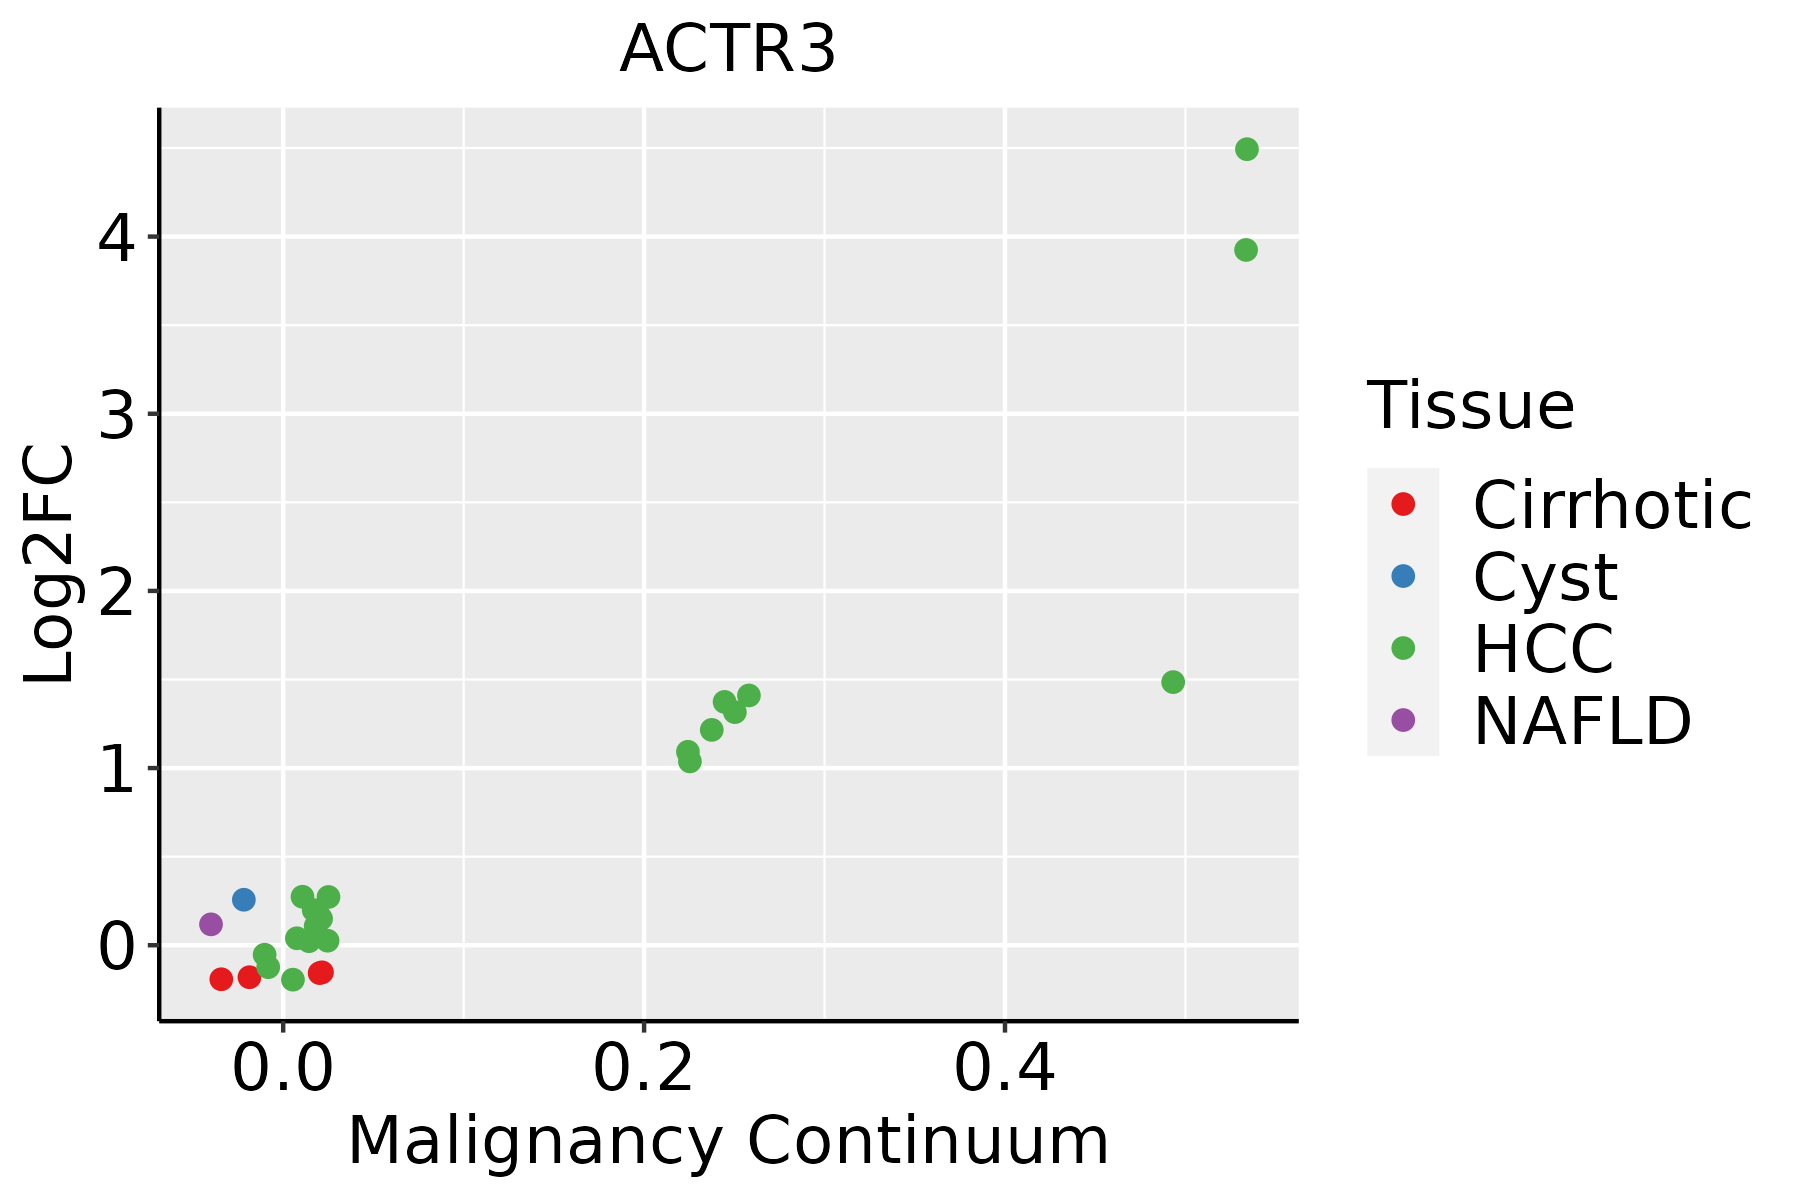 | HCC: Hepatocellular carcinoma |
| NAFLD: Non-alcoholic fatty liver disease | ||
| Oral Cavity |  | EOLP: Erosive Oral lichen planus |
| LP: leukoplakia | ||
| NEOLP: Non-erosive oral lichen planus | ||
| OSCC: Oral squamous cell carcinoma | ||
| Prostate |  | BPH: Benign Prostatic Hyperplasia |
| Skin |  | AK: Actinic keratosis |
| cSCC: Cutaneous squamous cell carcinoma | ||
| SCCIS:squamous cell carcinoma in situ | ||
| Thyroid | 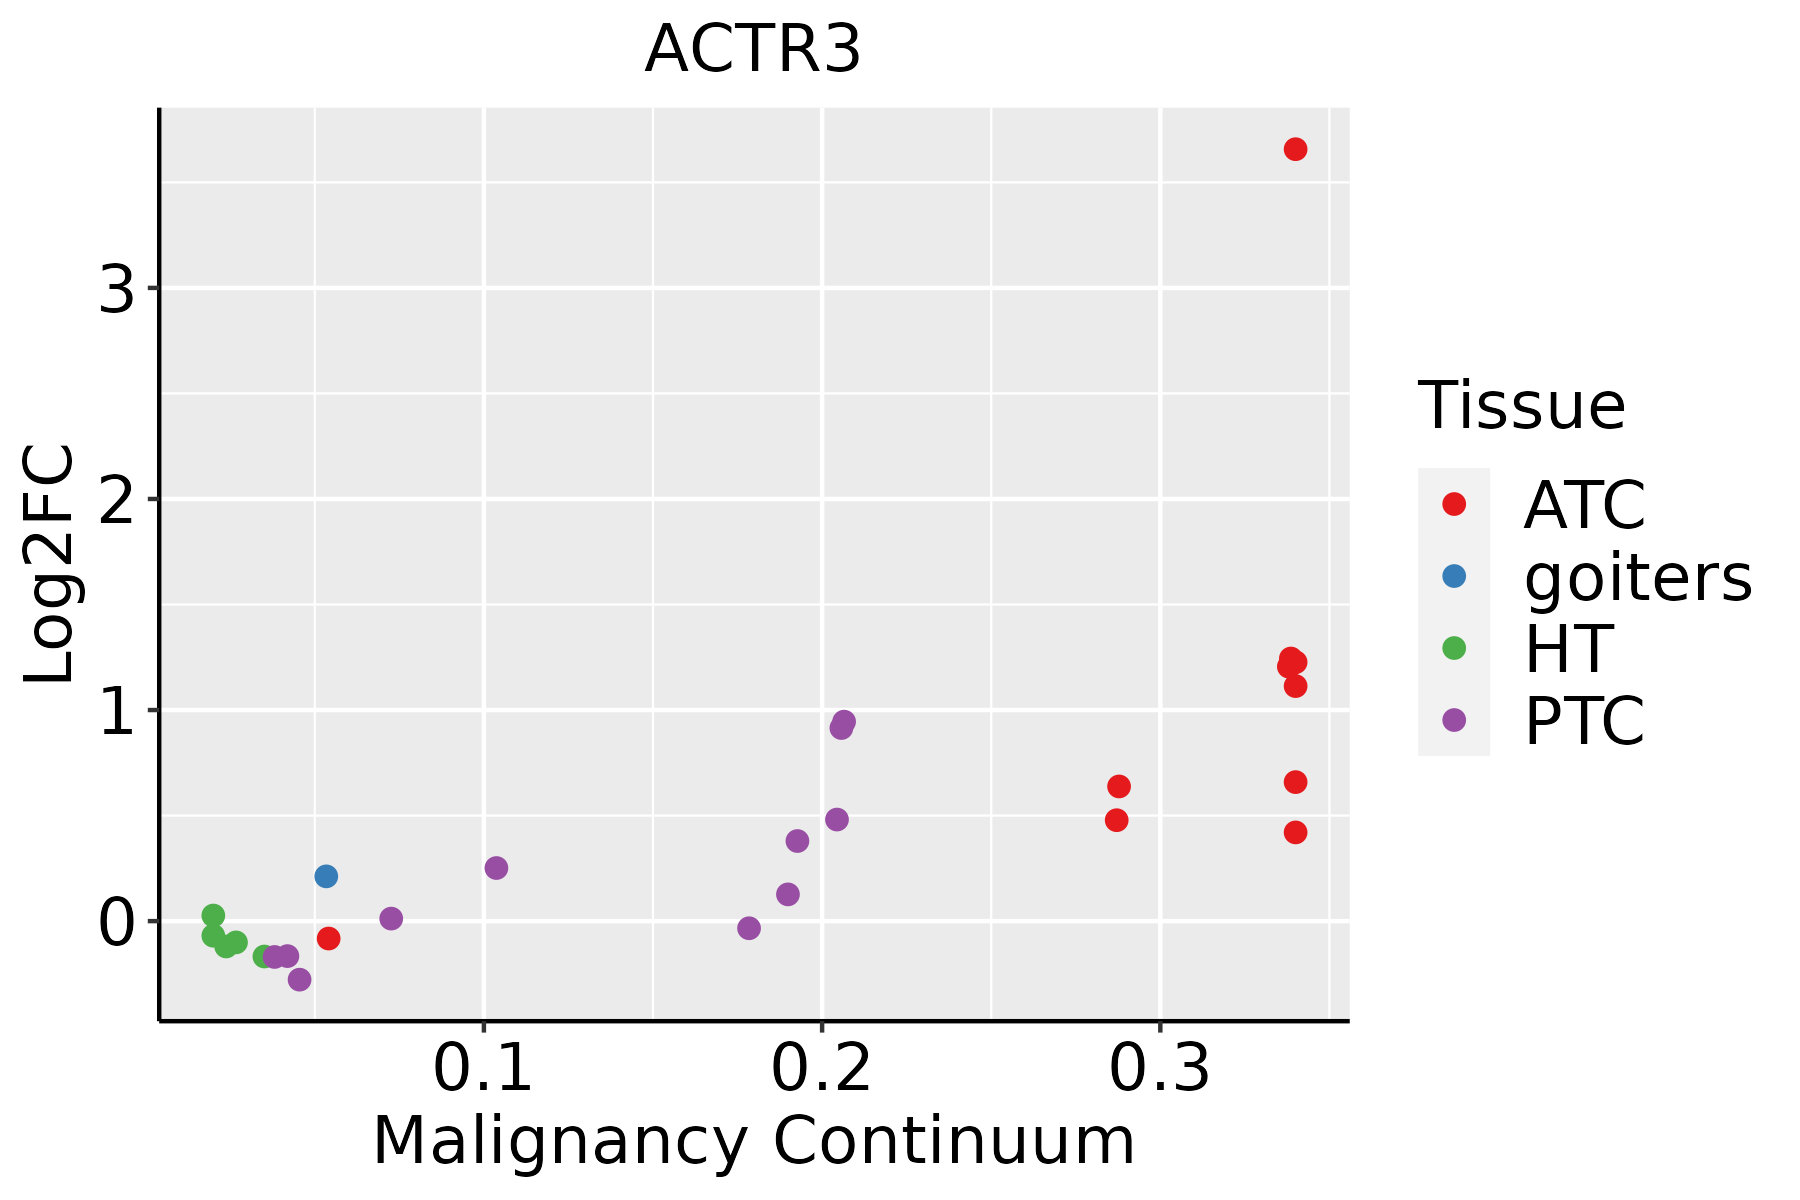 | ATC: Anaplastic thyroid cancer |
| HT: Hashimoto's thyroiditis | ||
| PTC: Papillary thyroid cancer |
| ∗log2FC in expression of this searched gene in stem-like cells from each diseased tissue sample relative to stem-like cells in normal samples in each tissue plotted against the malignancy continuum. Samples are colored based on if they are from different disease stage. |
Top |
Malignant transformation related pathway analysis |
| Find out the enriched GO biological processes and KEGG pathways involved in transition from healthy to precancer to cancer |
| Tissue | Disease Stage | Enriched GO biological Processes |
| Colorectum | AD |  |
| Colorectum | SER |  |
| Colorectum | MSS |  |
| Colorectum | MSI-H |  |
| Colorectum | FAP |  |
| ∗Top 15 enriched GO BP terms are showed in the bar plot of each disease state in each tissue. Each row represents a significant GO biological process which is colored according to the -log10(p.adjust). |
| Page: 1 2 3 4 5 6 7 8 9 |
| GO ID | Tissue | Disease Stage | Description | Gene Ratio | Bg Ratio | pvalue | p.adjust | Count |
| GO:0007015 | Colorectum | AD | actin filament organization | 167/3918 | 442/18723 | 1.65e-16 | 7.94e-14 | 167 |
| GO:0032535 | Colorectum | AD | regulation of cellular component size | 142/3918 | 383/18723 | 1.74e-13 | 3.41e-11 | 142 |
| GO:1902903 | Colorectum | AD | regulation of supramolecular fiber organization | 139/3918 | 383/18723 | 2.01e-12 | 3.19e-10 | 139 |
| GO:0032970 | Colorectum | AD | regulation of actin filament-based process | 142/3918 | 397/18723 | 4.05e-12 | 5.90e-10 | 142 |
| GO:0110053 | Colorectum | AD | regulation of actin filament organization | 108/3918 | 278/18723 | 5.02e-12 | 6.98e-10 | 108 |
| GO:0008154 | Colorectum | AD | actin polymerization or depolymerization | 90/3918 | 218/18723 | 6.14e-12 | 8.23e-10 | 90 |
| GO:0032271 | Colorectum | AD | regulation of protein polymerization | 94/3918 | 233/18723 | 1.01e-11 | 1.29e-09 | 94 |
| GO:0030041 | Colorectum | AD | actin filament polymerization | 81/3918 | 191/18723 | 1.35e-11 | 1.69e-09 | 81 |
| GO:0051258 | Colorectum | AD | protein polymerization | 112/3918 | 297/18723 | 1.85e-11 | 2.27e-09 | 112 |
| GO:0043254 | Colorectum | AD | regulation of protein-containing complex assembly | 148/3918 | 428/18723 | 2.64e-11 | 3.18e-09 | 148 |
| GO:0008064 | Colorectum | AD | regulation of actin polymerization or depolymerization | 79/3918 | 188/18723 | 4.17e-11 | 4.74e-09 | 79 |
| GO:0030833 | Colorectum | AD | regulation of actin filament polymerization | 74/3918 | 172/18723 | 4.50e-11 | 5.03e-09 | 74 |
| GO:0030832 | Colorectum | AD | regulation of actin filament length | 79/3918 | 189/18723 | 5.71e-11 | 6.27e-09 | 79 |
| GO:1902905 | Colorectum | AD | positive regulation of supramolecular fiber organization | 85/3918 | 209/18723 | 5.95e-11 | 6.33e-09 | 85 |
| GO:0032956 | Colorectum | AD | regulation of actin cytoskeleton organization | 127/3918 | 358/18723 | 1.03e-10 | 1.04e-08 | 127 |
| GO:0051495 | Colorectum | AD | positive regulation of cytoskeleton organization | 89/3918 | 226/18723 | 1.61e-10 | 1.56e-08 | 89 |
| GO:0032273 | Colorectum | AD | positive regulation of protein polymerization | 62/3918 | 138/18723 | 1.94e-10 | 1.76e-08 | 62 |
| GO:0031334 | Colorectum | AD | positive regulation of protein-containing complex assembly | 91/3918 | 237/18723 | 4.78e-10 | 3.99e-08 | 91 |
| GO:0030838 | Colorectum | AD | positive regulation of actin filament polymerization | 48/3918 | 99/18723 | 9.21e-10 | 7.03e-08 | 48 |
| GO:0051656 | Colorectum | AD | establishment of organelle localization | 131/3918 | 390/18723 | 3.00e-09 | 2.06e-07 | 131 |
| Page: 1 2 3 4 5 6 7 8 9 10 11 12 13 14 15 16 17 18 19 20 21 22 23 24 25 26 27 28 29 30 |
| Pathway ID | Tissue | Disease Stage | Description | Gene Ratio | Bg Ratio | pvalue | p.adjust | qvalue | Count |
| hsa0513038 | Oral cavity | LP | Pathogenic Escherichia coli infection | 87/2418 | 197/8465 | 1.71e-06 | 1.78e-05 | 1.15e-05 | 87 |
| hsa0513138 | Oral cavity | LP | Shigellosis | 103/2418 | 247/8465 | 4.98e-06 | 4.14e-05 | 2.67e-05 | 103 |
| hsa0510038 | Oral cavity | LP | Bacterial invasion of epithelial cells | 39/2418 | 77/8465 | 3.34e-05 | 2.22e-04 | 1.43e-04 | 39 |
| hsa0513535 | Oral cavity | LP | Yersinia infection | 59/2418 | 137/8465 | 1.81e-04 | 1.04e-03 | 6.71e-04 | 59 |
| hsa0513245 | Oral cavity | EOLP | Salmonella infection | 78/1218 | 249/8465 | 3.66e-12 | 2.37e-10 | 1.40e-10 | 78 |
| hsa0414442 | Oral cavity | EOLP | Endocytosis | 71/1218 | 251/8465 | 5.28e-09 | 8.97e-08 | 5.29e-08 | 71 |
| hsa0513544 | Oral cavity | EOLP | Yersinia infection | 44/1218 | 137/8465 | 8.88e-08 | 1.06e-06 | 6.27e-07 | 44 |
| hsa0513045 | Oral cavity | EOLP | Pathogenic Escherichia coli infection | 54/1218 | 197/8465 | 1.10e-06 | 9.96e-06 | 5.87e-06 | 54 |
| hsa0466623 | Oral cavity | EOLP | Fc gamma R-mediated phagocytosis | 31/1218 | 97/8465 | 7.90e-06 | 4.73e-05 | 2.79e-05 | 31 |
| hsa0513146 | Oral cavity | EOLP | Shigellosis | 61/1218 | 247/8465 | 9.48e-06 | 5.47e-05 | 3.23e-05 | 61 |
| hsa0510043 | Oral cavity | EOLP | Bacterial invasion of epithelial cells | 22/1218 | 77/8465 | 9.16e-04 | 3.36e-03 | 1.98e-03 | 22 |
| hsa0481027 | Oral cavity | EOLP | Regulation of actin cytoskeleton | 50/1218 | 229/8465 | 1.34e-03 | 4.80e-03 | 2.83e-03 | 50 |
| hsa04530210 | Oral cavity | EOLP | Tight junction | 39/1218 | 169/8465 | 1.52e-03 | 5.34e-03 | 3.15e-03 | 39 |
| hsa0513255 | Oral cavity | EOLP | Salmonella infection | 78/1218 | 249/8465 | 3.66e-12 | 2.37e-10 | 1.40e-10 | 78 |
| hsa0414452 | Oral cavity | EOLP | Endocytosis | 71/1218 | 251/8465 | 5.28e-09 | 8.97e-08 | 5.29e-08 | 71 |
| hsa0513554 | Oral cavity | EOLP | Yersinia infection | 44/1218 | 137/8465 | 8.88e-08 | 1.06e-06 | 6.27e-07 | 44 |
| hsa0513055 | Oral cavity | EOLP | Pathogenic Escherichia coli infection | 54/1218 | 197/8465 | 1.10e-06 | 9.96e-06 | 5.87e-06 | 54 |
| hsa0466633 | Oral cavity | EOLP | Fc gamma R-mediated phagocytosis | 31/1218 | 97/8465 | 7.90e-06 | 4.73e-05 | 2.79e-05 | 31 |
| hsa0513156 | Oral cavity | EOLP | Shigellosis | 61/1218 | 247/8465 | 9.48e-06 | 5.47e-05 | 3.23e-05 | 61 |
| hsa0510053 | Oral cavity | EOLP | Bacterial invasion of epithelial cells | 22/1218 | 77/8465 | 9.16e-04 | 3.36e-03 | 1.98e-03 | 22 |
| Page: 1 2 3 4 5 6 7 8 9 10 11 |
Top |
Cell-cell communication analysis |
| Identification of potential cell-cell interactions between two cell types and their ligand-receptor pairs for different disease states |
| Ligand | Receptor | LRpair | Pathway | Tissue | Disease Stage |
| Page: 1 |
Top |
Single-cell gene regulatory network inference analysis |
| Find out the significant the regulons (TFs) and the target genes of each regulon across cell types for different disease states |
| TF | Cell Type | Tissue | Disease Stage | Target Gene | RSS | Regulon Activity |
| ∗The dot plots of a searched regulon are shown for all cell subpopulations in each disease state of each tissue based on the regulon specific score inferred using pySCENIC and by calculating the average expression. |
| Page: 1 |
Top |
Somatic mutation of malignant transformation related genes |
| Annotation of somatic variants for genes involved in malignant transformation |
| Hugo Symbol | Variant Class | Variant Classification | dbSNP RS | HGVSc | HGVSp | HGVSp Short | SWISSPROT | BIOTYPE | SIFT | PolyPhen | Tumor Sample Barcode | Tissue | Histology | Sex | Age | Stage | Therapy Types | Drugs | Outcome |
| ACTR3 | SNV | Missense_Mutation | c.439N>G | p.Leu147Val | p.L147V | P61158 | protein_coding | deleterious(0) | possibly_damaging(0.829) | TCGA-AC-A23H-01 | Breast | breast invasive carcinoma | Female | >=65 | I/II | Unknown | Unknown | PD | |
| ACTR3 | insertion | Nonsense_Mutation | novel | c.777_778insCAATAA | p.Ile259_Asn260insGlnTer | p.I259_N260insQ* | P61158 | protein_coding | TCGA-AC-A3QQ-01 | Breast | breast invasive carcinoma | Female | <65 | I/II | Unknown | Unknown | SD | ||
| ACTR3 | deletion | Frame_Shift_Del | novel | c.1110delN | p.His371ThrfsTer64 | p.H371Tfs*64 | P61158 | protein_coding | TCGA-EW-A2FV-01 | Breast | breast invasive carcinoma | Female | <65 | III/IV | Chemotherapy | docetaxel | SD | ||
| ACTR3 | SNV | Missense_Mutation | novel | c.1001G>A | p.Arg334His | p.R334H | P61158 | protein_coding | deleterious(0.02) | benign(0.357) | TCGA-2W-A8YY-01 | Cervix | cervical & endocervical cancer | Female | <65 | I/II | Chemotherapy | cisplatin | CR |
| ACTR3 | SNV | Missense_Mutation | rs760969306 | c.808G>A | p.Asp270Asn | p.D270N | P61158 | protein_coding | deleterious(0.01) | possibly_damaging(0.69) | TCGA-AA-3984-01 | Colorectum | colon adenocarcinoma | Female | <65 | I/II | Unknown | Unknown | SD |
| ACTR3 | SNV | Missense_Mutation | c.841N>C | p.Ile281Leu | p.I281L | P61158 | protein_coding | tolerated(0.17) | probably_damaging(0.999) | TCGA-AA-A010-01 | Colorectum | colon adenocarcinoma | Female | <65 | I/II | Chemotherapy | folinic | CR | |
| ACTR3 | SNV | Missense_Mutation | novel | c.657N>C | p.Gln219His | p.Q219H | P61158 | protein_coding | deleterious(0.04) | probably_damaging(0.968) | TCGA-CA-6717-01 | Colorectum | colon adenocarcinoma | Male | <65 | I/II | Chemotherapy | oxaliplatin | CR |
| ACTR3 | SNV | Missense_Mutation | c.923C>A | p.Pro308His | p.P308H | P61158 | protein_coding | deleterious(0) | probably_damaging(1) | TCGA-CK-5916-01 | Colorectum | colon adenocarcinoma | Female | >=65 | I/II | Unknown | Unknown | PD | |
| ACTR3 | SNV | Missense_Mutation | novel | c.1191N>C | p.Lys397Asn | p.K397N | P61158 | protein_coding | deleterious(0) | probably_damaging(1) | TCGA-AG-A002-01 | Colorectum | rectum adenocarcinoma | Male | <65 | I/II | Unknown | Unknown | SD |
| ACTR3 | SNV | Missense_Mutation | rs200071930 | c.688C>T | p.Arg230Cys | p.R230C | P61158 | protein_coding | deleterious(0) | probably_damaging(0.92) | TCGA-EI-6507-01 | Colorectum | rectum adenocarcinoma | Male | <65 | I/II | Unknown | Unknown | SD |
| Page: 1 2 3 4 |
Top |
Related drugs of malignant transformation related genes |
| Identification of chemicals and drugs interact with genes involved in malignant transfromation |
| (DGIdb 4.0) |
| Entrez ID | Symbol | Category | Interaction Types | Drug Claim Name | Drug Name | PMIDs |
| Page: 1 |

Copyright 2023-Present -The University of Texas Health Science Center at Houston |