
|
|||||
|
 | |
| |
| |
| |
| |
| |
|
Gene: ACTB |
Gene summary for ACTB |
| Gene information | Species | Human | Gene symbol | ACTB | Gene ID | 60 |
| Gene name | actin beta | |
| Gene Alias | BRWS1 | |
| Cytomap | 7p22.1 | |
| Gene Type | protein-coding | GO ID | GO:0000079 | UniProtAcc | P60709 |
Top |
Malignant transformation analysis |
| Identification of the aberrant gene expression in precancerous and cancerous lesions by comparing the gene expression of stem-like cells in diseased tissues with normal stem cells |
| Entrez ID | Symbol | Replicates | Species | Organ | Tissue | Adj P-value | Log2FC | Malignancy |
| 60 | ACTB | GSM4909281 | Human | Breast | IDC | 6.49e-19 | 2.40e-01 | 0.21 |
| 60 | ACTB | GSM4909282 | Human | Breast | IDC | 4.41e-32 | 3.13e-01 | -0.0288 |
| 60 | ACTB | GSM4909285 | Human | Breast | IDC | 5.31e-05 | -1.65e-01 | 0.21 |
| 60 | ACTB | GSM4909286 | Human | Breast | IDC | 5.78e-63 | -7.44e-01 | 0.1081 |
| 60 | ACTB | GSM4909287 | Human | Breast | IDC | 1.08e-23 | 3.10e-01 | 0.2057 |
| 60 | ACTB | GSM4909291 | Human | Breast | IDC | 4.19e-07 | 2.78e-01 | 0.1753 |
| 60 | ACTB | GSM4909294 | Human | Breast | IDC | 4.74e-10 | 4.80e-02 | 0.2022 |
| 60 | ACTB | GSM4909296 | Human | Breast | IDC | 3.16e-04 | 6.38e-02 | 0.1524 |
| 60 | ACTB | GSM4909297 | Human | Breast | IDC | 4.51e-13 | 7.17e-02 | 0.1517 |
| 60 | ACTB | GSM4909300 | Human | Breast | IDC | 6.68e-03 | 2.47e-01 | 0.0334 |
| 60 | ACTB | GSM4909302 | Human | Breast | IDC | 2.19e-04 | 1.81e-01 | 0.1545 |
| 60 | ACTB | GSM4909304 | Human | Breast | IDC | 7.31e-41 | 3.49e-01 | 0.1636 |
| 60 | ACTB | GSM4909305 | Human | Breast | IDC | 5.37e-05 | 2.32e-01 | 0.0436 |
| 60 | ACTB | GSM4909311 | Human | Breast | IDC | 7.94e-25 | -2.04e-01 | 0.1534 |
| 60 | ACTB | GSM4909312 | Human | Breast | IDC | 6.41e-12 | 1.79e-01 | 0.1552 |
| 60 | ACTB | GSM4909313 | Human | Breast | IDC | 3.57e-11 | 2.70e-01 | 0.0391 |
| 60 | ACTB | GSM4909315 | Human | Breast | IDC | 6.55e-35 | 3.29e-01 | 0.21 |
| 60 | ACTB | GSM4909316 | Human | Breast | IDC | 3.82e-14 | 3.92e-01 | 0.21 |
| 60 | ACTB | GSM4909319 | Human | Breast | IDC | 1.70e-36 | -3.30e-01 | 0.1563 |
| 60 | ACTB | GSM4909320 | Human | Breast | IDC | 4.01e-28 | -1.08e+00 | 0.1575 |
| Page: 1 2 3 4 5 6 7 8 9 10 11 12 13 14 15 16 17 18 19 |
| Tissue | Expression Dynamics | Abbreviation |
| Breast | 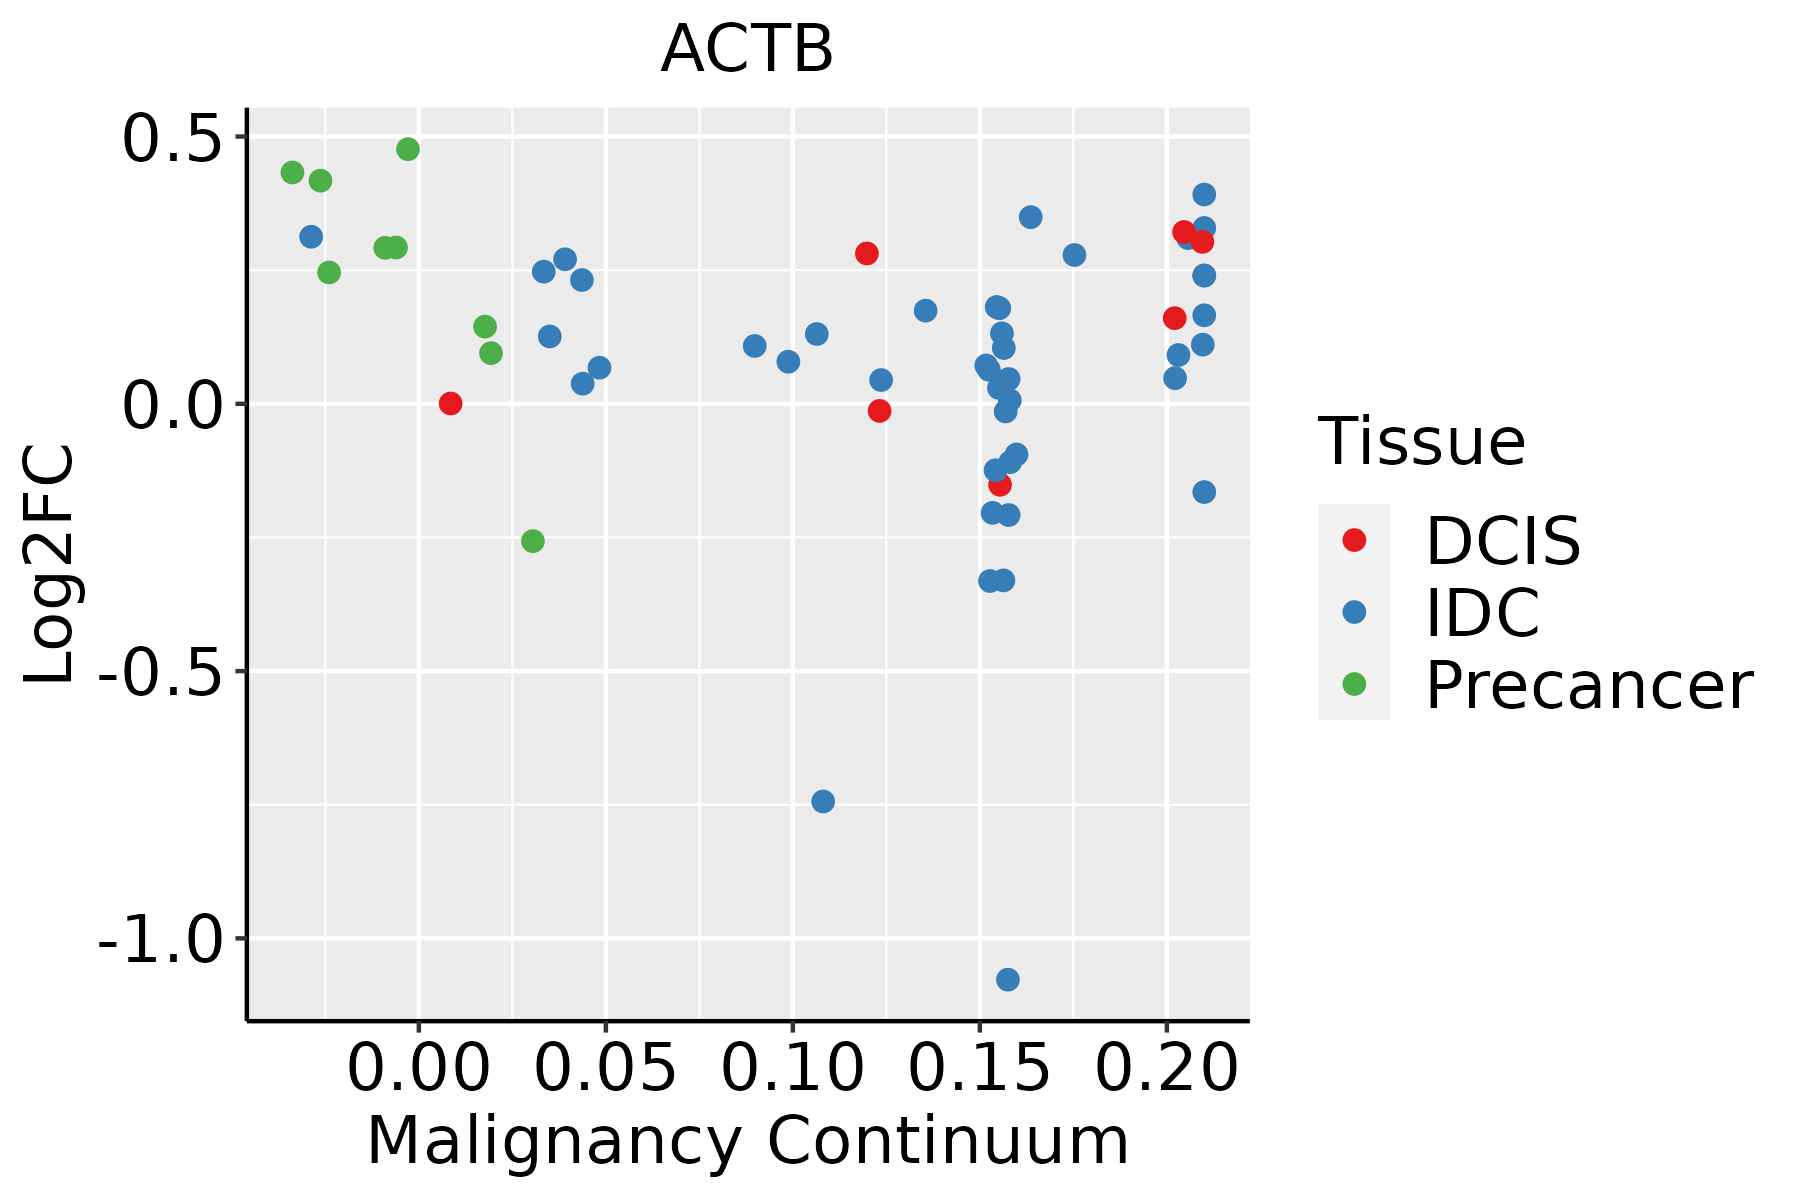 | IDC: Invasive ductal carcinoma |
| DCIS: Ductal carcinoma in situ | ||
| Precancer(BRCA1-mut): Precancerous lesion from BRCA1 mutation carriers | ||
| Cervix | 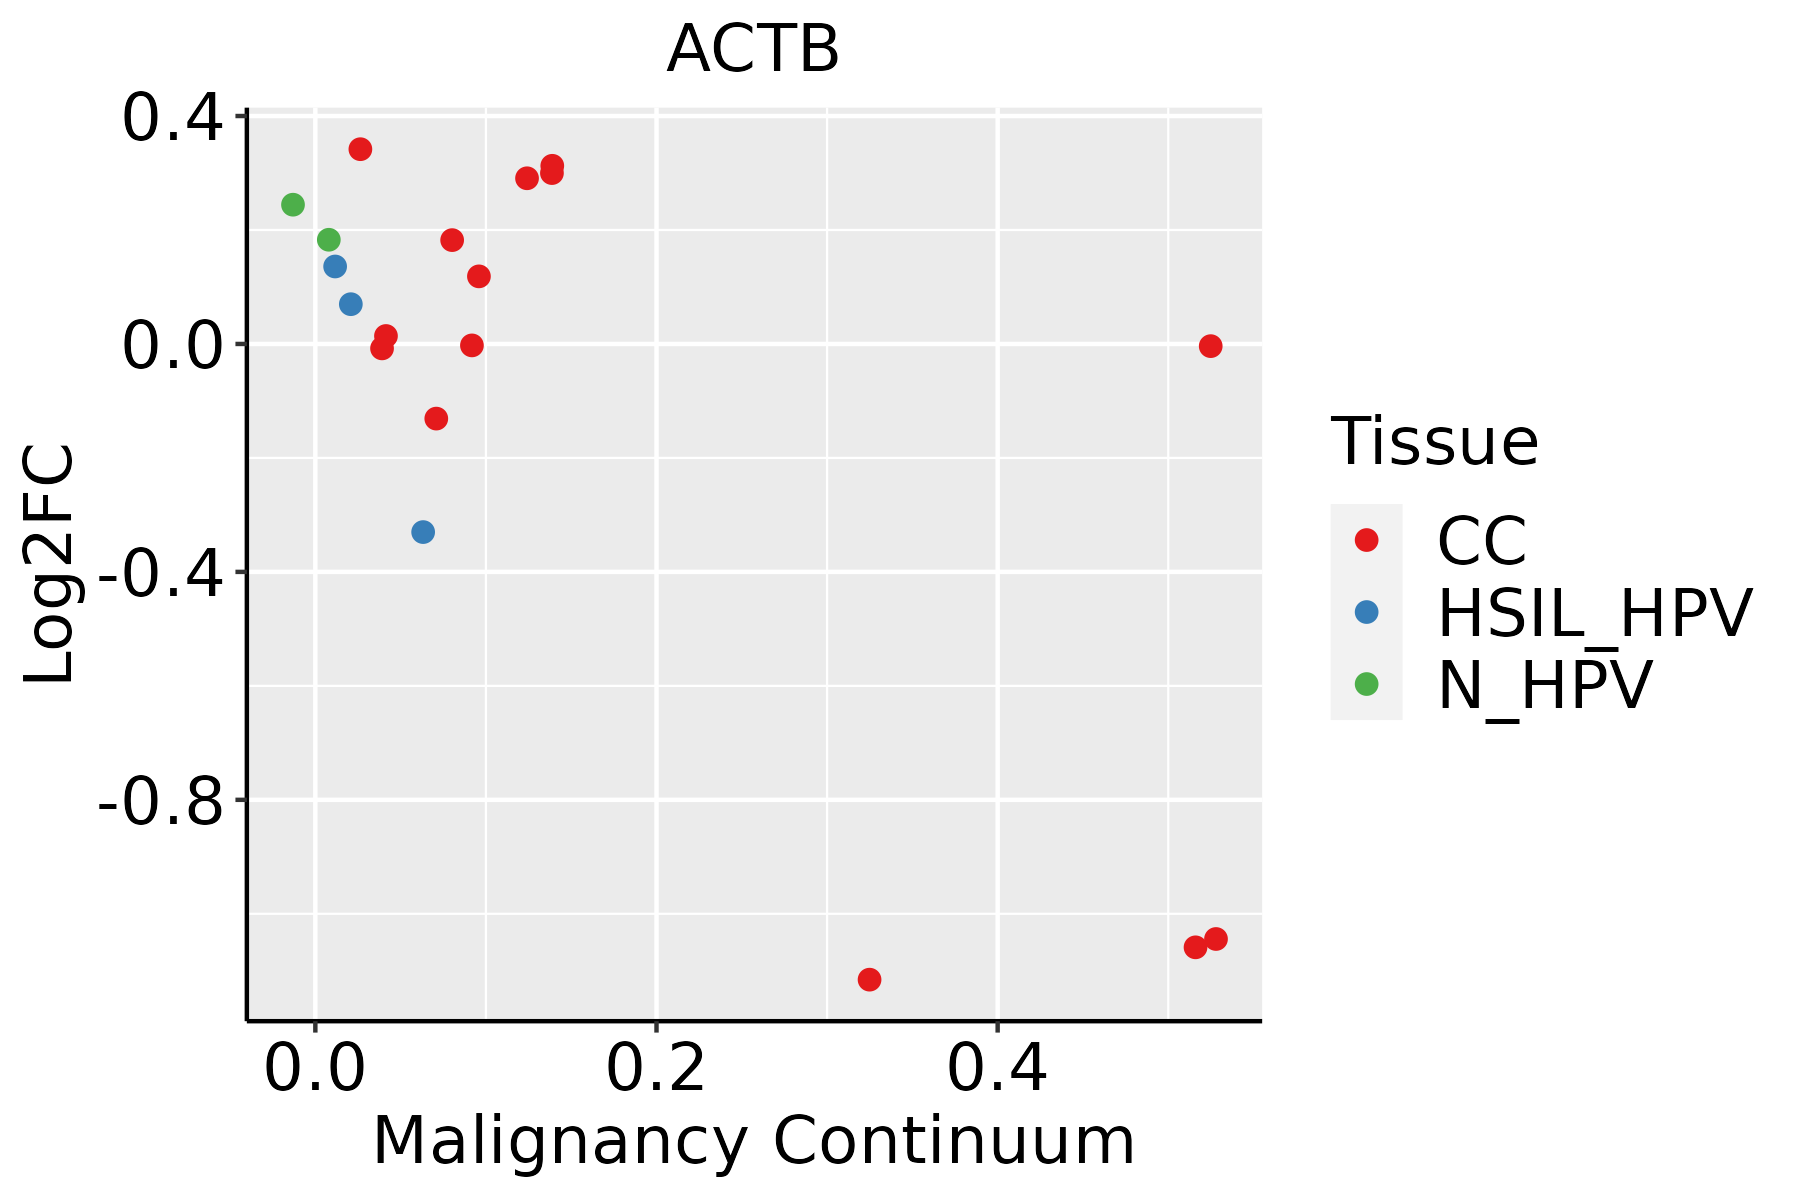 | CC: Cervix cancer |
| HSIL_HPV: HPV-infected high-grade squamous intraepithelial lesions | ||
| N_HPV: HPV-infected normal cervix | ||
| Colorectum (GSE201348) |  | FAP: Familial adenomatous polyposis |
| CRC: Colorectal cancer | ||
| Colorectum (HTA11) |  | AD: Adenomas |
| SER: Sessile serrated lesions | ||
| MSI-H: Microsatellite-high colorectal cancer | ||
| MSS: Microsatellite stable colorectal cancer | ||
| Endometrium |  | AEH: Atypical endometrial hyperplasia |
| EEC: Endometrioid Cancer | ||
| Esophagus | 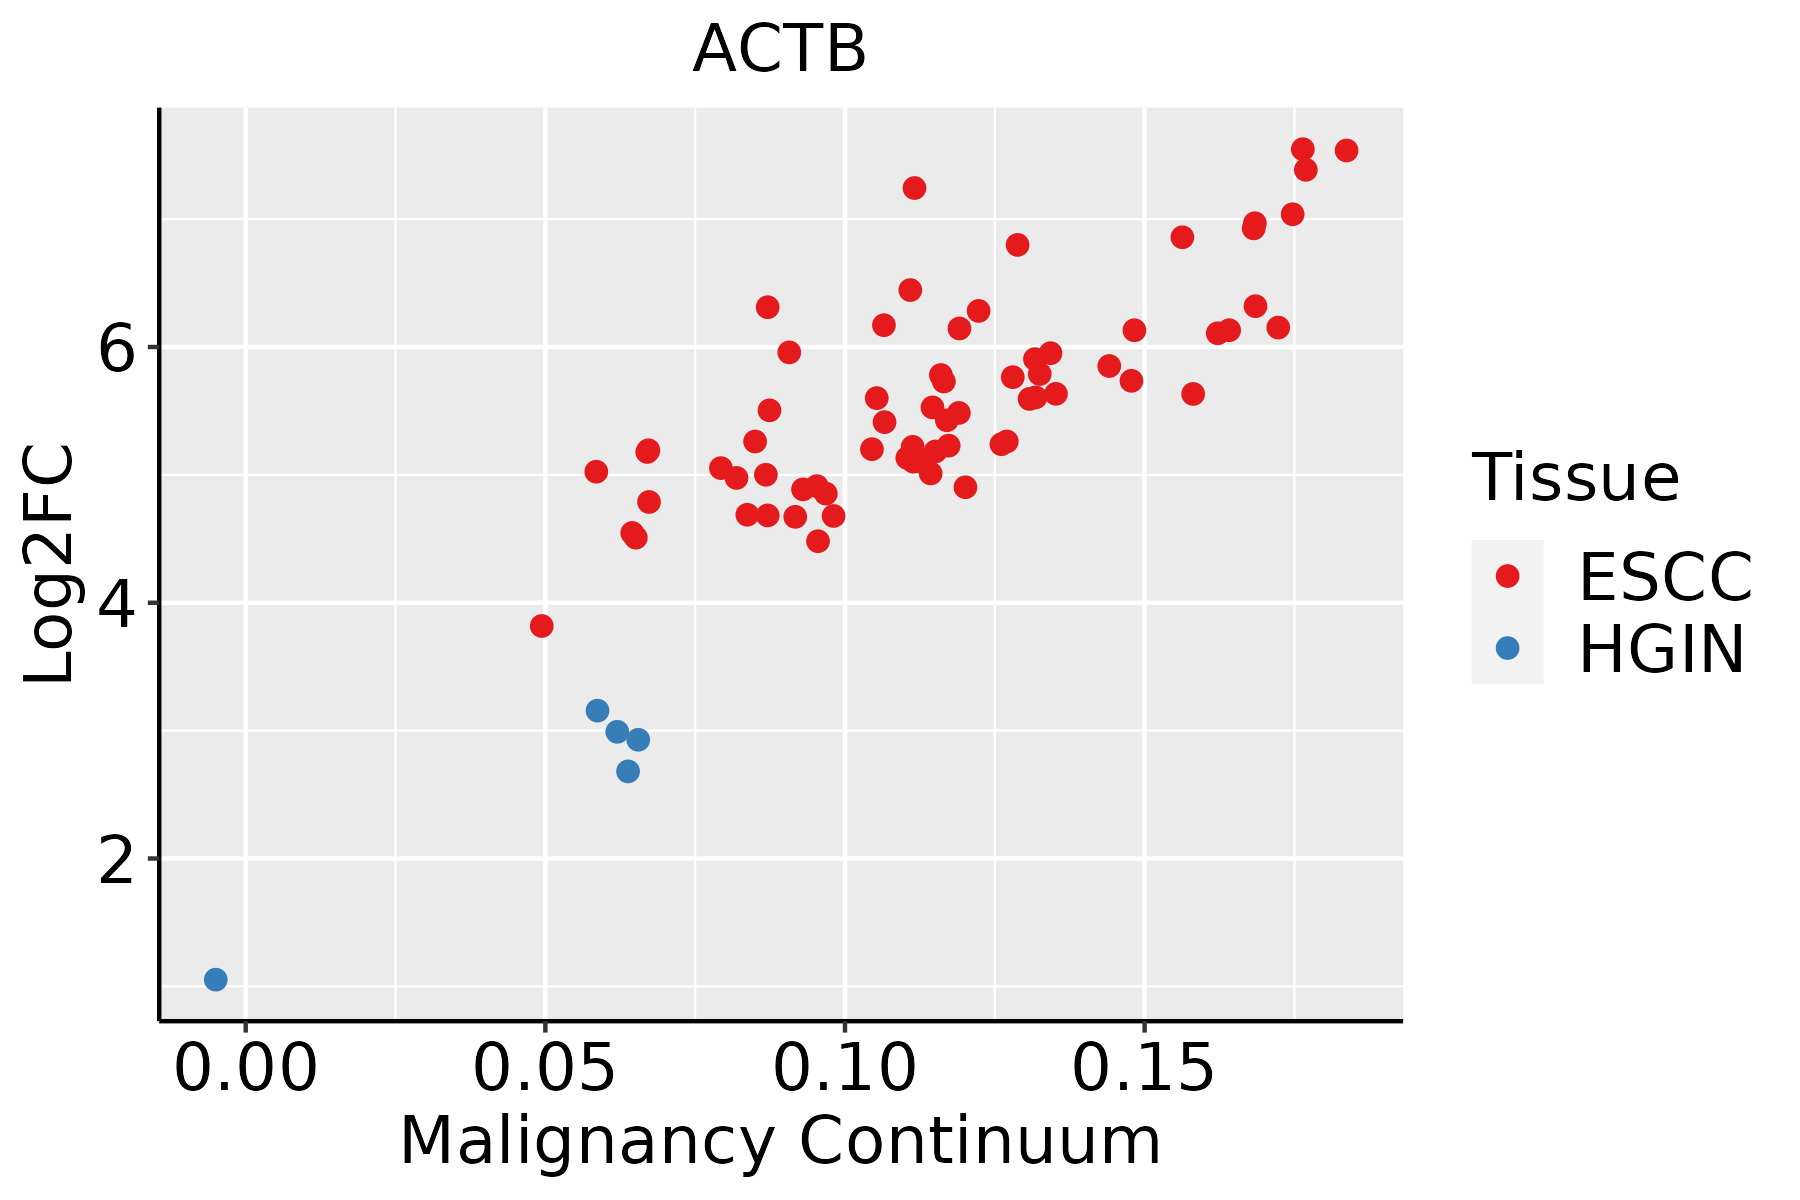 | ESCC: Esophageal squamous cell carcinoma |
| HGIN: High-grade intraepithelial neoplasias | ||
| LGIN: Low-grade intraepithelial neoplasias | ||
| Liver |  | HCC: Hepatocellular carcinoma |
| NAFLD: Non-alcoholic fatty liver disease | ||
| Lung |  | AAH: Atypical adenomatous hyperplasia |
| AIS: Adenocarcinoma in situ | ||
| IAC: Invasive lung adenocarcinoma | ||
| MIA: Minimally invasive adenocarcinoma | ||
| Oral Cavity |  | EOLP: Erosive Oral lichen planus |
| LP: leukoplakia | ||
| NEOLP: Non-erosive oral lichen planus | ||
| OSCC: Oral squamous cell carcinoma | ||
| Prostate |  | BPH: Benign Prostatic Hyperplasia |
| Skin | 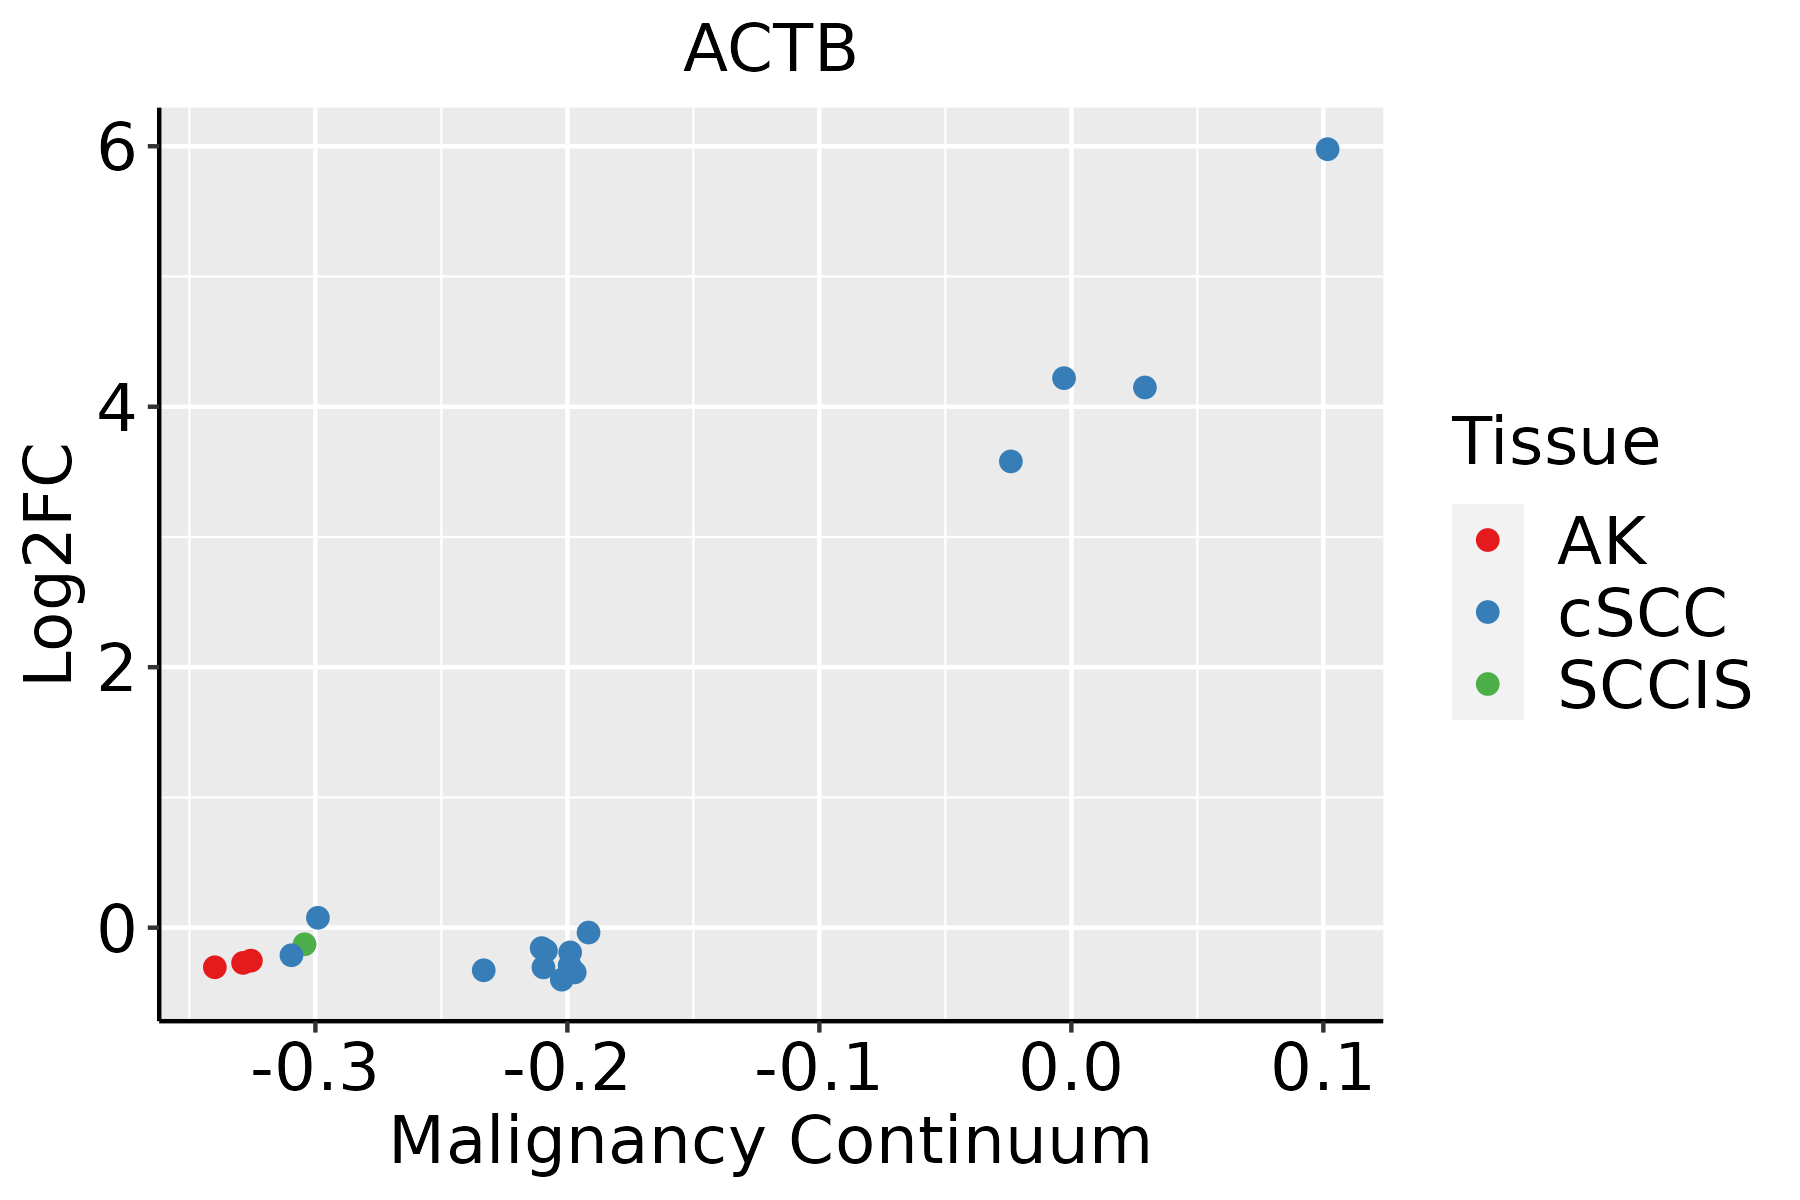 | AK: Actinic keratosis |
| cSCC: Cutaneous squamous cell carcinoma | ||
| SCCIS:squamous cell carcinoma in situ | ||
| Thyroid | 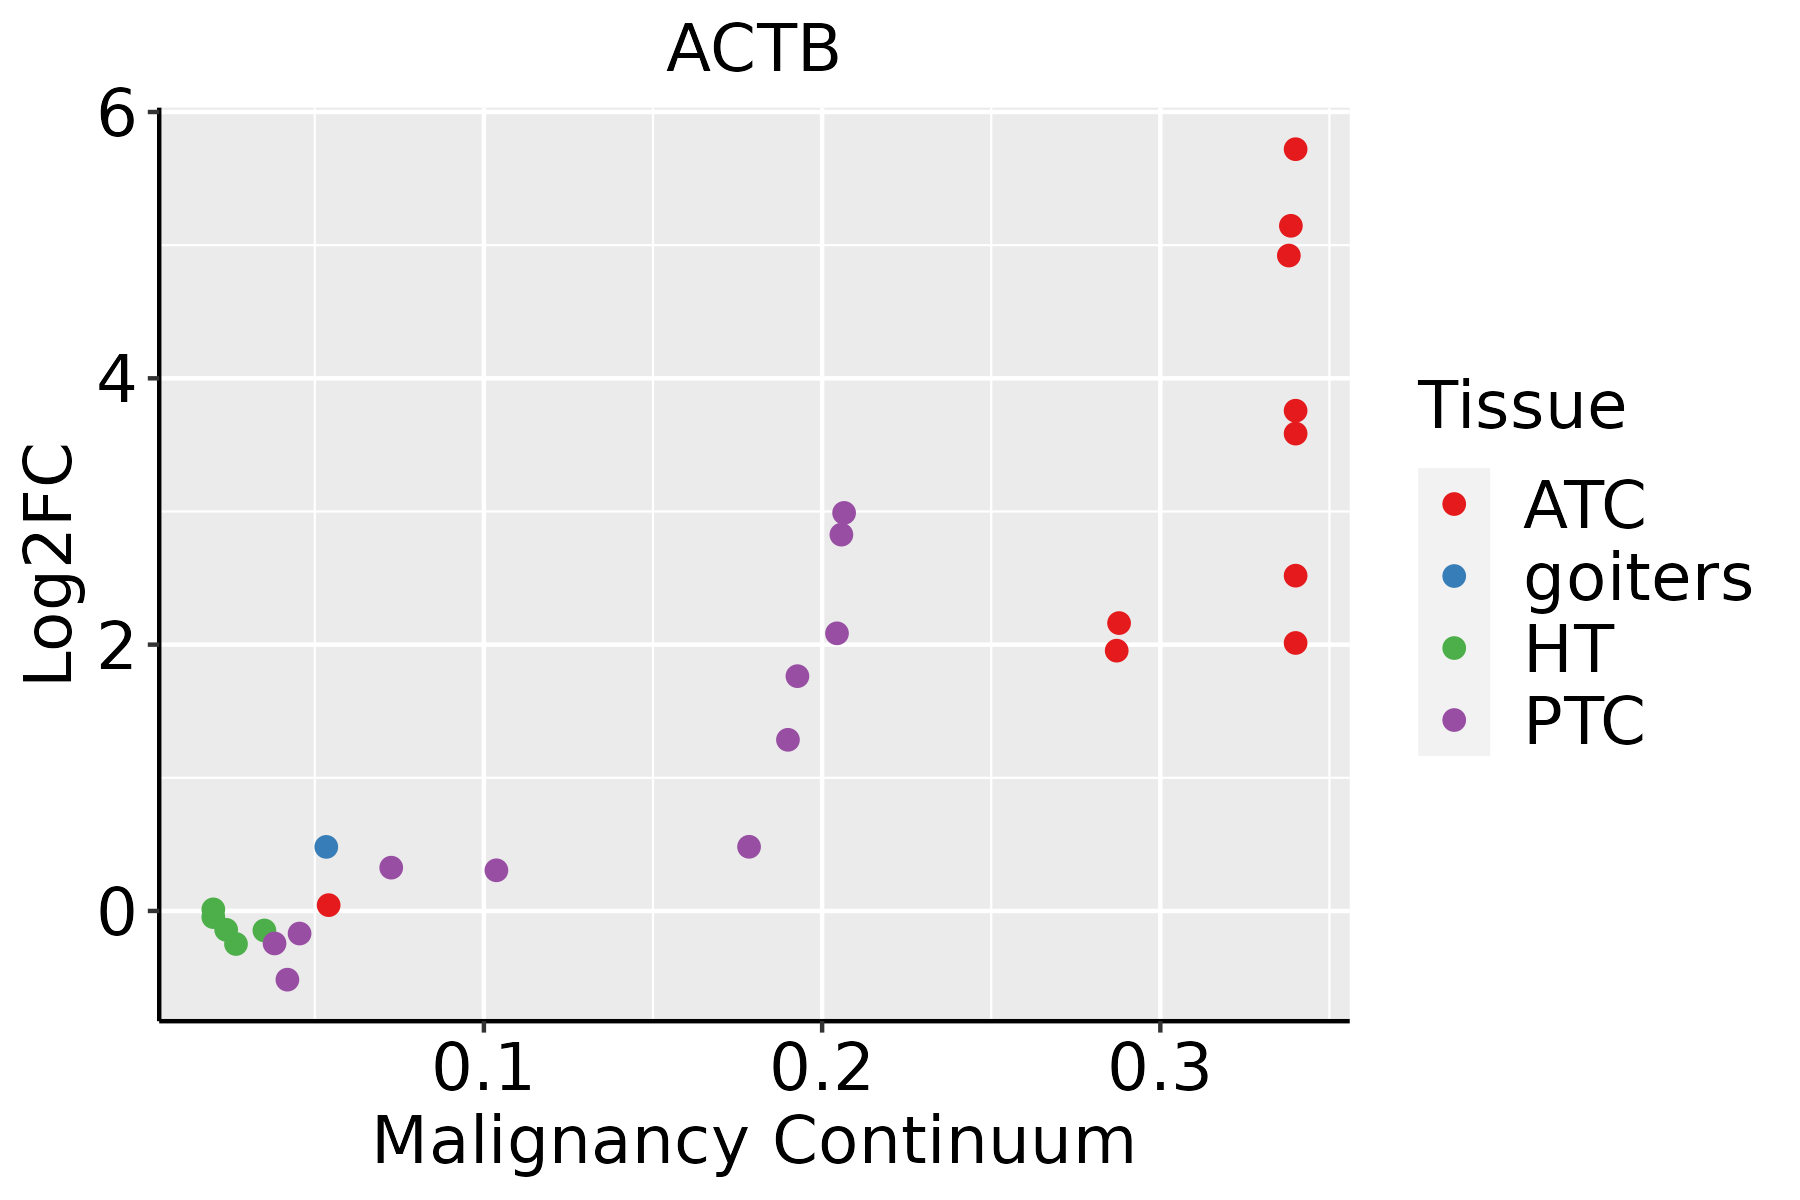 | ATC: Anaplastic thyroid cancer |
| HT: Hashimoto's thyroiditis | ||
| PTC: Papillary thyroid cancer |
| ∗log2FC in expression of this searched gene in stem-like cells from each diseased tissue sample relative to stem-like cells in normal samples in each tissue plotted against the malignancy continuum. Samples are colored based on if they are from different disease stage. |
Top |
Malignant transformation related pathway analysis |
| Find out the enriched GO biological processes and KEGG pathways involved in transition from healthy to precancer to cancer |
| Tissue | Disease Stage | Enriched GO biological Processes |
| Colorectum | AD |  |
| Colorectum | SER |  |
| Colorectum | MSS |  |
| Colorectum | MSI-H |  |
| Colorectum | FAP |  |
| ∗Top 15 enriched GO BP terms are showed in the bar plot of each disease state in each tissue. Each row represents a significant GO biological process which is colored according to the -log10(p.adjust). |
| Page: 1 2 3 4 5 6 7 8 9 |
| GO ID | Tissue | Disease Stage | Description | Gene Ratio | Bg Ratio | pvalue | p.adjust | Count |
| GO:00217629 | Breast | Precancer | substantia nigra development | 15/1080 | 44/18723 | 1.12e-08 | 7.98e-07 | 15 |
| GO:00309018 | Breast | Precancer | midbrain development | 20/1080 | 90/18723 | 1.50e-07 | 7.93e-06 | 20 |
| GO:00488578 | Breast | Precancer | neural nucleus development | 16/1080 | 64/18723 | 4.76e-07 | 2.11e-05 | 16 |
| GO:00510989 | Breast | Precancer | regulation of binding | 44/1080 | 363/18723 | 2.59e-06 | 8.65e-05 | 44 |
| GO:00341099 | Breast | Precancer | homotypic cell-cell adhesion | 18/1080 | 90/18723 | 3.15e-06 | 1.03e-04 | 18 |
| GO:00420609 | Breast | Precancer | wound healing | 48/1080 | 422/18723 | 5.48e-06 | 1.63e-04 | 48 |
| GO:00508789 | Breast | Precancer | regulation of body fluid levels | 40/1080 | 379/18723 | 1.68e-04 | 2.77e-03 | 40 |
| GO:00705278 | Breast | Precancer | platelet aggregation | 12/1080 | 67/18723 | 4.02e-04 | 5.43e-03 | 12 |
| GO:00356335 | Breast | Precancer | maintenance of blood-brain barrier | 8/1080 | 35/18723 | 6.95e-04 | 8.43e-03 | 8 |
| GO:00018956 | Breast | Precancer | retina homeostasis | 12/1080 | 79/18723 | 1.82e-03 | 1.79e-02 | 12 |
| GO:00075995 | Breast | Precancer | hemostasis | 24/1080 | 222/18723 | 2.31e-03 | 2.15e-02 | 24 |
| GO:00511008 | Breast | Precancer | negative regulation of binding | 19/1080 | 162/18723 | 2.56e-03 | 2.32e-02 | 19 |
| GO:00018948 | Breast | Precancer | tissue homeostasis | 27/1080 | 268/18723 | 3.49e-03 | 2.90e-02 | 27 |
| GO:00075965 | Breast | Precancer | blood coagulation | 23/1080 | 217/18723 | 3.61e-03 | 2.98e-02 | 23 |
| GO:00071638 | Breast | Precancer | establishment or maintenance of cell polarity | 23/1080 | 218/18723 | 3.82e-03 | 3.06e-02 | 23 |
| GO:00508175 | Breast | Precancer | coagulation | 23/1080 | 222/18723 | 4.78e-03 | 3.64e-02 | 23 |
| GO:0030168 | Breast | Precancer | platelet activation | 15/1080 | 123/18723 | 4.80e-03 | 3.64e-02 | 15 |
| GO:19043757 | Breast | Precancer | regulation of protein localization to cell periphery | 15/1080 | 125/18723 | 5.58e-03 | 4.07e-02 | 15 |
| GO:00228985 | Breast | Precancer | regulation of transmembrane transporter activity | 27/1080 | 278/18723 | 5.72e-03 | 4.11e-02 | 27 |
| GO:19054757 | Breast | Precancer | regulation of protein localization to membrane | 19/1080 | 175/18723 | 5.98e-03 | 4.22e-02 | 19 |
| Page: 1 2 3 4 5 6 7 8 9 10 11 12 13 14 15 16 17 18 19 20 21 22 23 24 25 26 27 28 29 30 31 32 33 34 35 36 37 38 39 40 41 42 43 44 45 46 47 48 49 50 |
| Pathway ID | Tissue | Disease Stage | Description | Gene Ratio | Bg Ratio | pvalue | p.adjust | qvalue | Count |
| hsa0541635 | Endometrium | EEC | Viral myocarditis | 28/1237 | 60/8465 | 2.81e-09 | 5.77e-08 | 4.30e-08 | 28 |
| hsa0452035 | Endometrium | EEC | Adherens junction | 36/1237 | 93/8465 | 8.57e-09 | 1.48e-07 | 1.11e-07 | 36 |
| hsa0513036 | Endometrium | EEC | Pathogenic Escherichia coli infection | 51/1237 | 197/8465 | 1.98e-05 | 2.28e-04 | 1.70e-04 | 51 |
| hsa048143 | Endometrium | EEC | Motor proteins | 42/1237 | 193/8465 | 4.43e-03 | 2.39e-02 | 1.78e-02 | 42 |
| hsa0501430 | Esophagus | HGIN | Amyotrophic lateral sclerosis | 140/1383 | 364/8465 | 2.13e-25 | 1.16e-23 | 9.19e-24 | 140 |
| hsa0471439 | Esophagus | HGIN | Thermogenesis | 91/1383 | 232/8465 | 1.97e-17 | 5.36e-16 | 4.25e-16 | 91 |
| hsa0513139 | Esophagus | HGIN | Shigellosis | 71/1383 | 247/8465 | 4.89e-07 | 7.98e-06 | 6.34e-06 | 71 |
| hsa0510039 | Esophagus | HGIN | Bacterial invasion of epithelial cells | 30/1383 | 77/8465 | 1.49e-06 | 2.31e-05 | 1.84e-05 | 30 |
| hsa0513239 | Esophagus | HGIN | Salmonella infection | 69/1383 | 249/8465 | 3.02e-06 | 4.47e-05 | 3.55e-05 | 69 |
| hsa0541839 | Esophagus | HGIN | Fluid shear stress and atherosclerosis | 42/1383 | 139/8465 | 2.92e-05 | 3.81e-04 | 3.02e-04 | 42 |
| hsa0513039 | Esophagus | HGIN | Pathogenic Escherichia coli infection | 54/1383 | 197/8465 | 4.91e-05 | 6.15e-04 | 4.89e-04 | 54 |
| hsa0421020 | Esophagus | HGIN | Apoptosis | 36/1383 | 136/8465 | 1.67e-03 | 1.52e-02 | 1.20e-02 | 36 |
| hsa0516420 | Esophagus | HGIN | Influenza A | 42/1383 | 171/8465 | 3.41e-03 | 2.54e-02 | 2.02e-02 | 42 |
| hsa0453039 | Esophagus | HGIN | Tight junction | 40/1383 | 169/8465 | 8.18e-03 | 4.71e-02 | 3.74e-02 | 40 |
| hsa0520528 | Esophagus | HGIN | Proteoglycans in cancer | 47/1383 | 205/8465 | 8.23e-03 | 4.71e-02 | 3.74e-02 | 47 |
| hsa05014113 | Esophagus | HGIN | Amyotrophic lateral sclerosis | 140/1383 | 364/8465 | 2.13e-25 | 1.16e-23 | 9.19e-24 | 140 |
| hsa04714114 | Esophagus | HGIN | Thermogenesis | 91/1383 | 232/8465 | 1.97e-17 | 5.36e-16 | 4.25e-16 | 91 |
| hsa05131114 | Esophagus | HGIN | Shigellosis | 71/1383 | 247/8465 | 4.89e-07 | 7.98e-06 | 6.34e-06 | 71 |
| hsa05100114 | Esophagus | HGIN | Bacterial invasion of epithelial cells | 30/1383 | 77/8465 | 1.49e-06 | 2.31e-05 | 1.84e-05 | 30 |
| hsa05132115 | Esophagus | HGIN | Salmonella infection | 69/1383 | 249/8465 | 3.02e-06 | 4.47e-05 | 3.55e-05 | 69 |
| Page: 1 2 3 4 5 6 7 8 9 10 11 12 13 14 15 16 17 18 |
Top |
Cell-cell communication analysis |
| Identification of potential cell-cell interactions between two cell types and their ligand-receptor pairs for different disease states |
| Ligand | Receptor | LRpair | Pathway | Tissue | Disease Stage |
| Page: 1 |
Top |
Single-cell gene regulatory network inference analysis |
| Find out the significant the regulons (TFs) and the target genes of each regulon across cell types for different disease states |
| TF | Cell Type | Tissue | Disease Stage | Target Gene | RSS | Regulon Activity |
| ∗The dot plots of a searched regulon are shown for all cell subpopulations in each disease state of each tissue based on the regulon specific score inferred using pySCENIC and by calculating the average expression. |
| Page: 1 |
Top |
Somatic mutation of malignant transformation related genes |
| Annotation of somatic variants for genes involved in malignant transformation |
| Hugo Symbol | Variant Class | Variant Classification | dbSNP RS | HGVSc | HGVSp | HGVSp Short | SWISSPROT | BIOTYPE | SIFT | PolyPhen | Tumor Sample Barcode | Tissue | Histology | Sex | Age | Stage | Therapy Types | Drugs | Outcome |
| ACTB | SNV | Missense_Mutation | c.761N>A | p.Arg254Gln | p.R254Q | P60709 | protein_coding | deleterious_low_confidence(0.04) | benign(0.065) | TCGA-A2-A0EY-01 | Breast | breast invasive carcinoma | Female | <65 | I/II | Chemotherapy | adriamycin | SD | |
| ACTB | SNV | Missense_Mutation | c.1004G>C | p.Arg335Pro | p.R335P | P60709 | protein_coding | deleterious_low_confidence(0.01) | probably_damaging(0.972) | TCGA-AO-A0JJ-01 | Breast | breast invasive carcinoma | Female | <65 | I/II | Chemotherapy | cyclophospamide | SD | |
| ACTB | SNV | Missense_Mutation | c.223A>C | p.Ile75Leu | p.I75L | P60709 | protein_coding | deleterious_low_confidence(0) | benign(0.377) | TCGA-AR-A2LQ-01 | Breast | breast invasive carcinoma | Female | <65 | I/II | Chemotherapy | docetaxel | SD | |
| ACTB | SNV | Missense_Mutation | c.832N>T | p.Thr278Ser | p.T278S | P60709 | protein_coding | deleterious_low_confidence(0.03) | benign(0.007) | TCGA-BH-A0H5-01 | Breast | breast invasive carcinoma | Female | <65 | I/II | Chemotherapy | cytoxan | CR | |
| ACTB | SNV | Missense_Mutation | c.147N>C | p.Gln49His | p.Q49H | P60709 | protein_coding | tolerated_low_confidence(0.08) | benign(0.007) | TCGA-EW-A1PD-01 | Breast | breast invasive carcinoma | Male | <65 | I/II | Chemotherapy | docetaxel | SD | |
| ACTB | insertion | Frame_Shift_Ins | novel | c.804_805insTTTTT | p.Met269PhefsTer17 | p.M269Ffs*17 | P60709 | protein_coding | TCGA-A8-A06U-01 | Breast | breast invasive carcinoma | Female | >=65 | I/II | Unknown | Unknown | SD | ||
| ACTB | insertion | Frame_Shift_Ins | novel | c.803_804insTTCT | p.Met269SerfsTer19 | p.M269Sfs*19 | P60709 | protein_coding | TCGA-A8-A06U-01 | Breast | breast invasive carcinoma | Female | >=65 | I/II | Unknown | Unknown | SD | ||
| ACTB | insertion | In_Frame_Ins | novel | c.811_812insTGTTACAGG | p.Ser271delinsLeuLeuGlnAla | p.S271delinsLLQA | P60709 | protein_coding | TCGA-A8-A08H-01 | Breast | breast invasive carcinoma | Female | >=65 | I/II | Unknown | Unknown | SD | ||
| ACTB | insertion | Frame_Shift_Ins | novel | c.552_553insG | p.Leu185AlafsTer3 | p.L185Afs*3 | P60709 | protein_coding | TCGA-BH-A0HK-01 | Breast | breast invasive carcinoma | Female | >=65 | I/II | Hormone Therapy | arimidex | SD | ||
| ACTB | insertion | Frame_Shift_Ins | novel | c.551_552insTGAACACGAGCATCGGGTGATGTTCATTATGT | p.Leu185GlufsTer12 | p.L185Efs*12 | P60709 | protein_coding | TCGA-BH-A0HK-01 | Breast | breast invasive carcinoma | Female | >=65 | I/II | Hormone Therapy | arimidex | SD |
| Page: 1 2 3 4 5 6 7 |
Top |
Related drugs of malignant transformation related genes |
| Identification of chemicals and drugs interact with genes involved in malignant transfromation |
| (DGIdb 4.0) |
| Entrez ID | Symbol | Category | Interaction Types | Drug Claim Name | Drug Name | PMIDs |
| 60 | ACTB | TUMOR SUPPRESSOR, CLINICALLY ACTIONABLE | ETHINYLESTRADIOL | ETHINYL ESTRADIOL | 17288598 | |
| 60 | ACTB | TUMOR SUPPRESSOR, CLINICALLY ACTIONABLE | ENVIRONMENTAL ESTROGEN | 17288598 | ||
| 60 | ACTB | TUMOR SUPPRESSOR, CLINICALLY ACTIONABLE | CYCLOPHOSPHAMIDE | CYCLOPHOSPHAMIDE | 12167460 |
| Page: 1 |

Copyright 2023-Present -The University of Texas Health Science Center at Houston |