
|
|||||
|
 | |
| |
| |
| |
| |
| |
|
Gene: RPS28 |
Gene summary for RPS28 |
| Gene information | Species | Human | Gene symbol | RPS28 | Gene ID | 6234 |
| Gene name | ribosomal protein S28 | |
| Gene Alias | DBA15 | |
| Cytomap | 19p13.2 | |
| Gene Type | protein-coding | GO ID | GO:0000028 | UniProtAcc | B2R4R9 |
Top |
Malignant transformation analysis |
| Identification of the aberrant gene expression in precancerous and cancerous lesions by comparing the gene expression of stem-like cells in diseased tissues with normal stem cells |
| Entrez ID | Symbol | Replicates | Species | Organ | Tissue | Adj P-value | Log2FC | Malignancy |
| 6234 | RPS28 | GSM4909280 | Human | Breast | Precancer | 1.31e-02 | -3.03e-01 | 0.0305 |
| 6234 | RPS28 | GSM4909281 | Human | Breast | IDC | 8.70e-41 | -3.69e-01 | 0.21 |
| 6234 | RPS28 | GSM4909282 | Human | Breast | IDC | 1.19e-13 | -1.74e-01 | -0.0288 |
| 6234 | RPS28 | GSM4909285 | Human | Breast | IDC | 2.26e-31 | -2.71e-01 | 0.21 |
| 6234 | RPS28 | GSM4909290 | Human | Breast | IDC | 3.28e-11 | -2.42e-01 | 0.2096 |
| 6234 | RPS28 | GSM4909295 | Human | Breast | IDC | 5.51e-07 | -2.83e-01 | 0.0898 |
| 6234 | RPS28 | GSM4909304 | Human | Breast | IDC | 3.56e-10 | 1.44e-01 | 0.1636 |
| 6234 | RPS28 | GSM4909306 | Human | Breast | IDC | 3.02e-03 | -1.04e-01 | 0.1564 |
| 6234 | RPS28 | GSM4909308 | Human | Breast | IDC | 9.24e-08 | -1.78e-01 | 0.158 |
| 6234 | RPS28 | GSM4909315 | Human | Breast | IDC | 4.87e-22 | 1.96e-01 | 0.21 |
| 6234 | RPS28 | GSM4909316 | Human | Breast | IDC | 1.09e-08 | 1.60e-01 | 0.21 |
| 6234 | RPS28 | GSM4909317 | Human | Breast | IDC | 1.07e-11 | -2.34e-01 | 0.1355 |
| 6234 | RPS28 | GSM4909318 | Human | Breast | IDC | 4.73e-06 | -4.16e-01 | 0.2031 |
| 6234 | RPS28 | GSM4909319 | Human | Breast | IDC | 9.49e-18 | -3.33e-01 | 0.1563 |
| 6234 | RPS28 | GSM4909321 | Human | Breast | IDC | 7.21e-42 | -4.09e-01 | 0.1559 |
| 6234 | RPS28 | brca1 | Human | Breast | Precancer | 4.23e-57 | -3.85e-01 | -0.0338 |
| 6234 | RPS28 | brca2 | Human | Breast | Precancer | 2.11e-17 | -1.87e-01 | -0.024 |
| 6234 | RPS28 | brca3 | Human | Breast | Precancer | 3.36e-15 | -1.65e-01 | -0.0263 |
| 6234 | RPS28 | M5 | Human | Breast | IDC | 1.45e-04 | -3.94e-01 | 0.1598 |
| 6234 | RPS28 | NCCBC14 | Human | Breast | DCIS | 1.12e-23 | -4.67e-01 | 0.2021 |
| Page: 1 2 3 4 5 6 7 8 9 10 11 12 13 14 15 16 17 18 19 20 |
| Tissue | Expression Dynamics | Abbreviation |
| Breast | 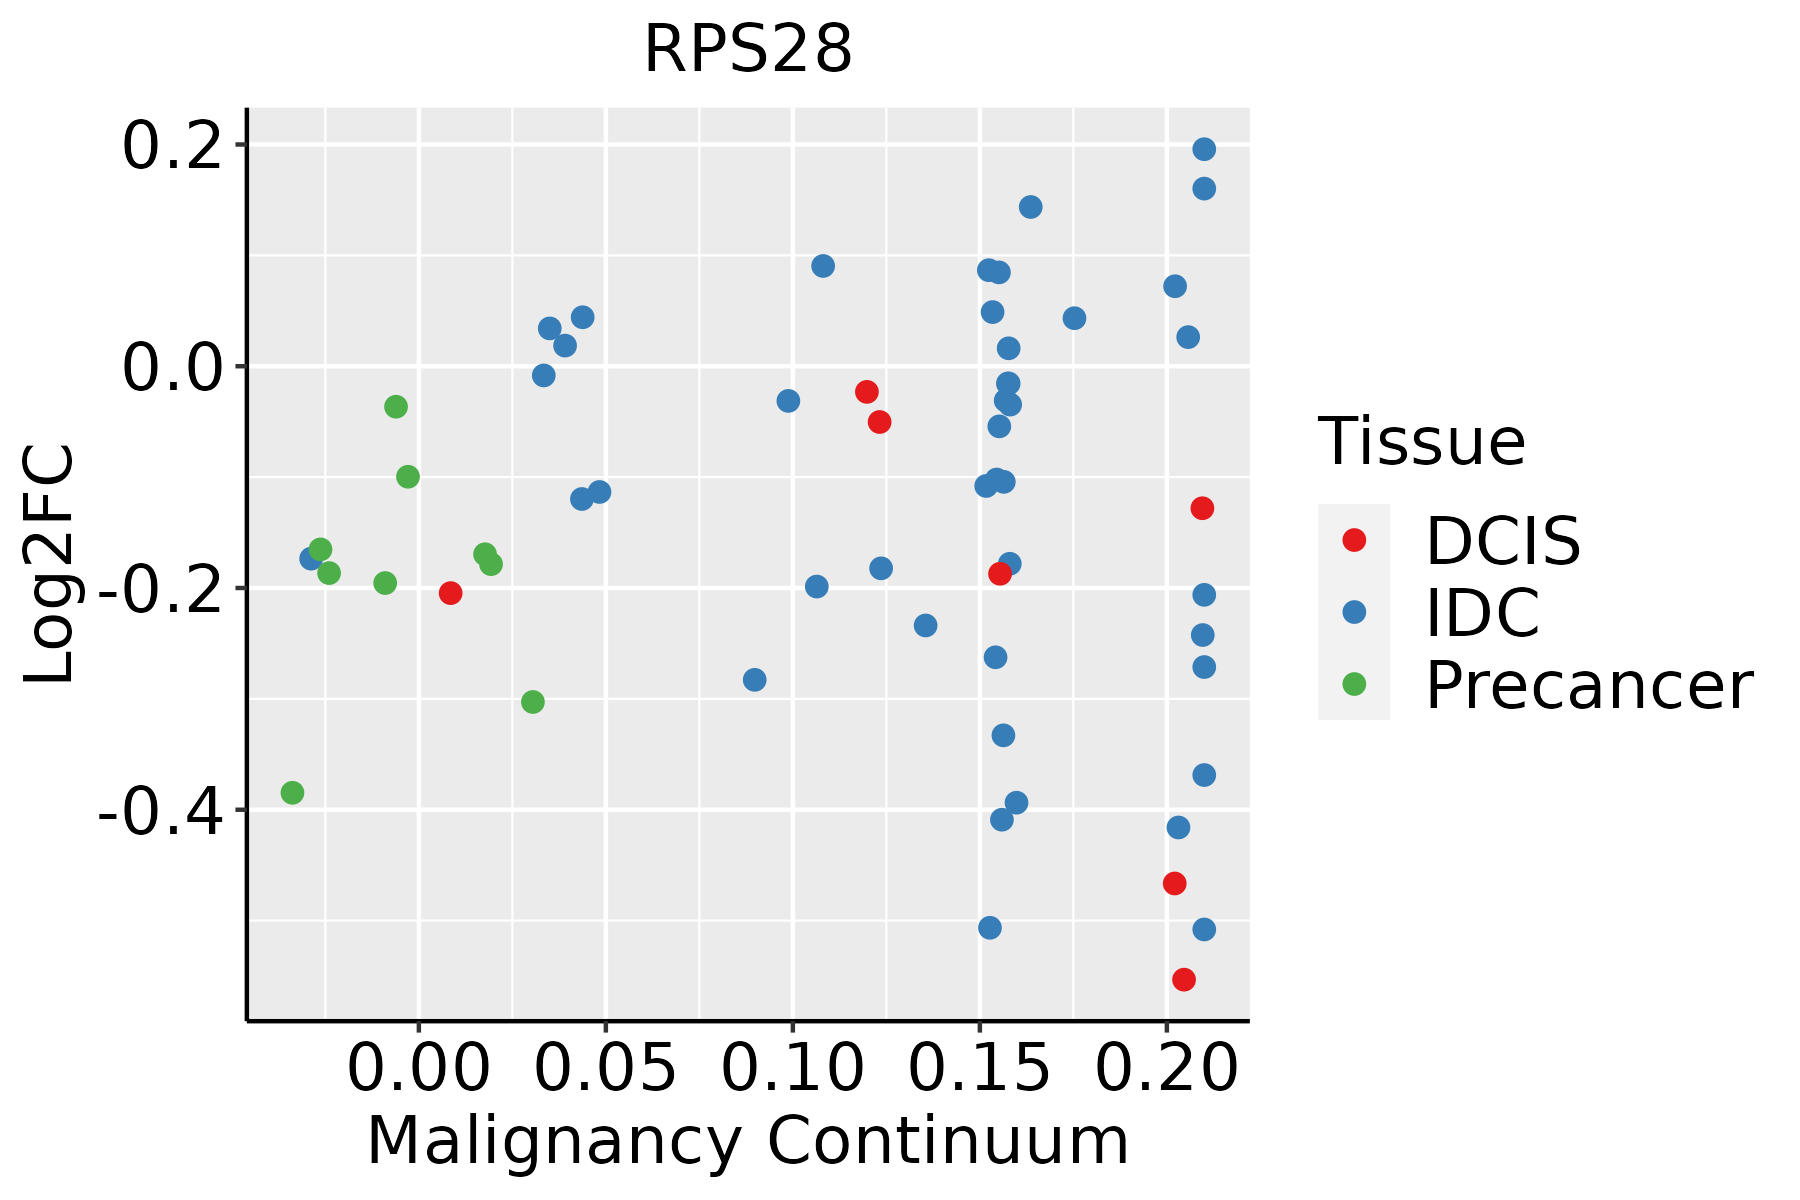 | IDC: Invasive ductal carcinoma |
| DCIS: Ductal carcinoma in situ | ||
| Precancer(BRCA1-mut): Precancerous lesion from BRCA1 mutation carriers | ||
| Cervix | 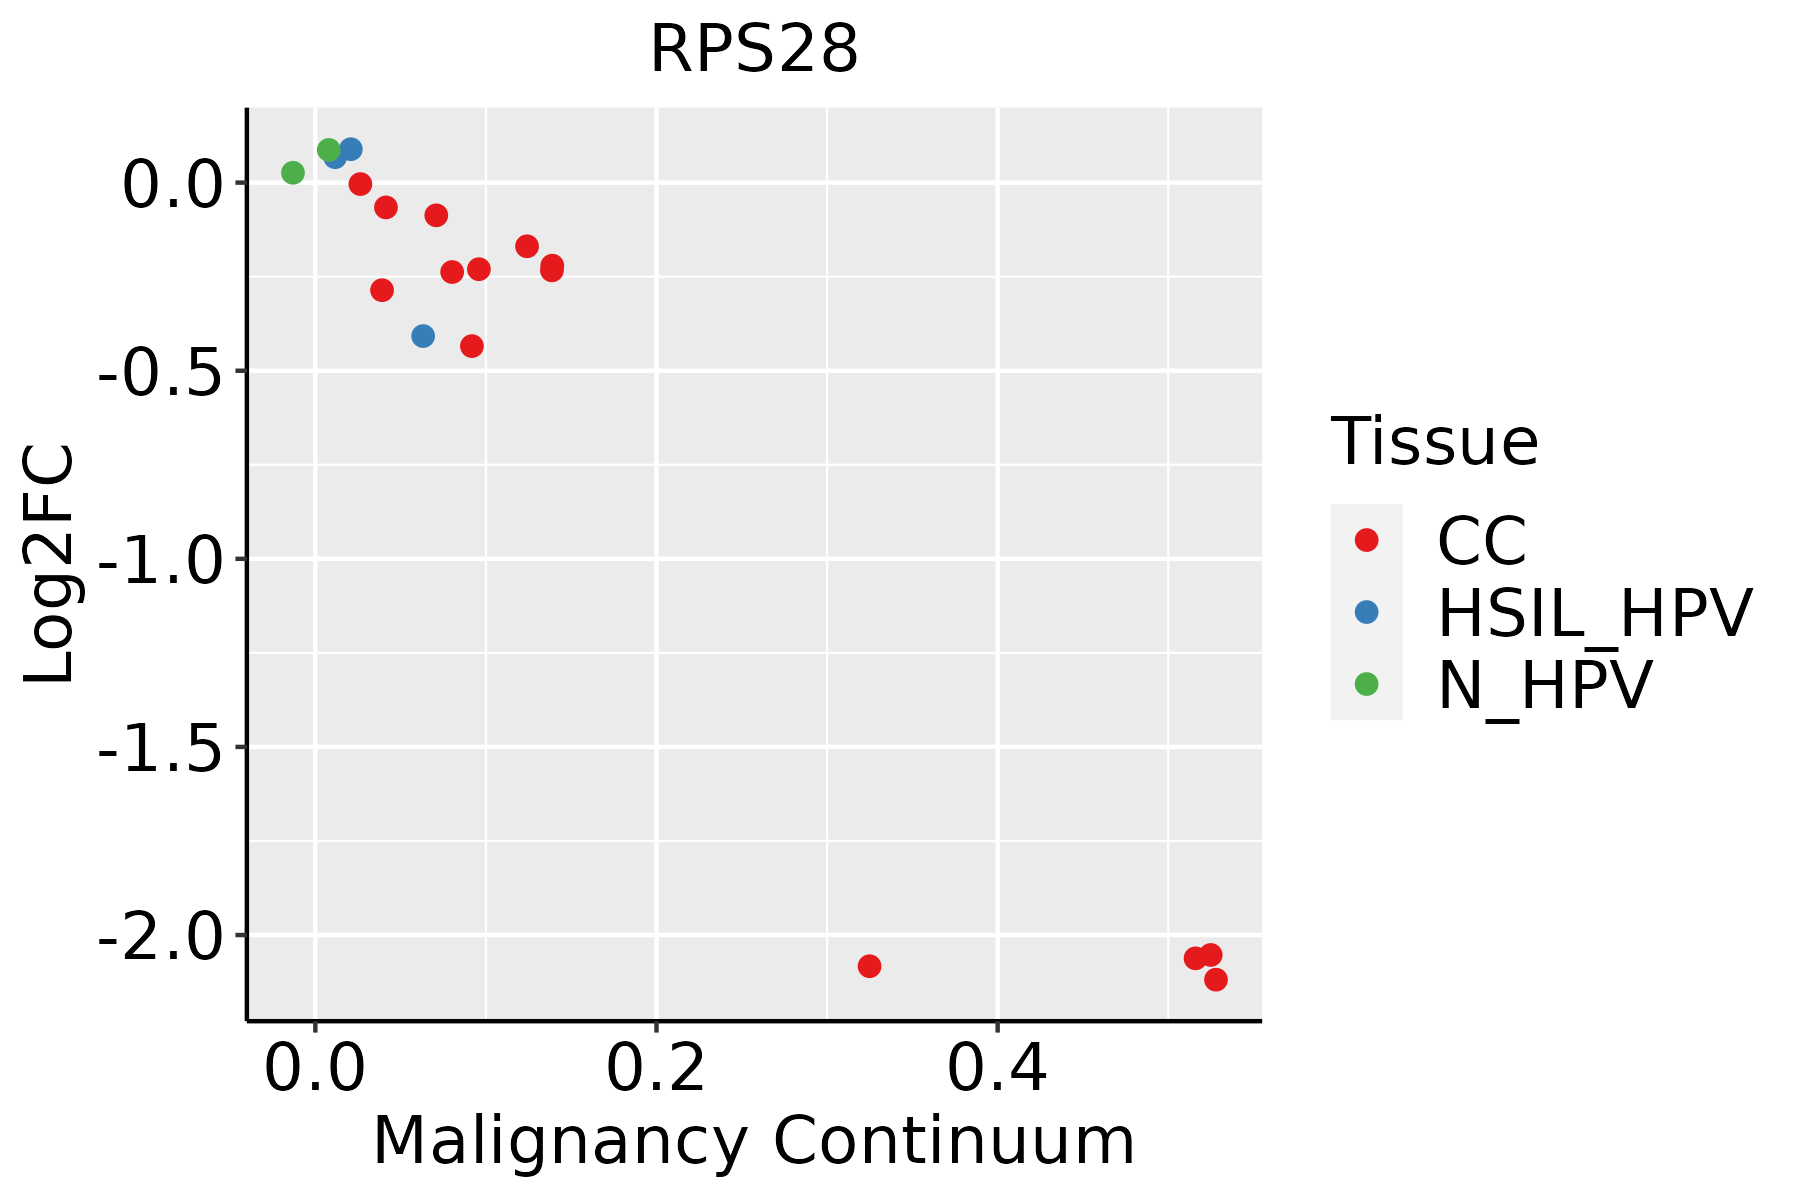 | CC: Cervix cancer |
| HSIL_HPV: HPV-infected high-grade squamous intraepithelial lesions | ||
| N_HPV: HPV-infected normal cervix | ||
| Colorectum (GSE201348) |  | FAP: Familial adenomatous polyposis |
| CRC: Colorectal cancer | ||
| Colorectum (HTA11) | 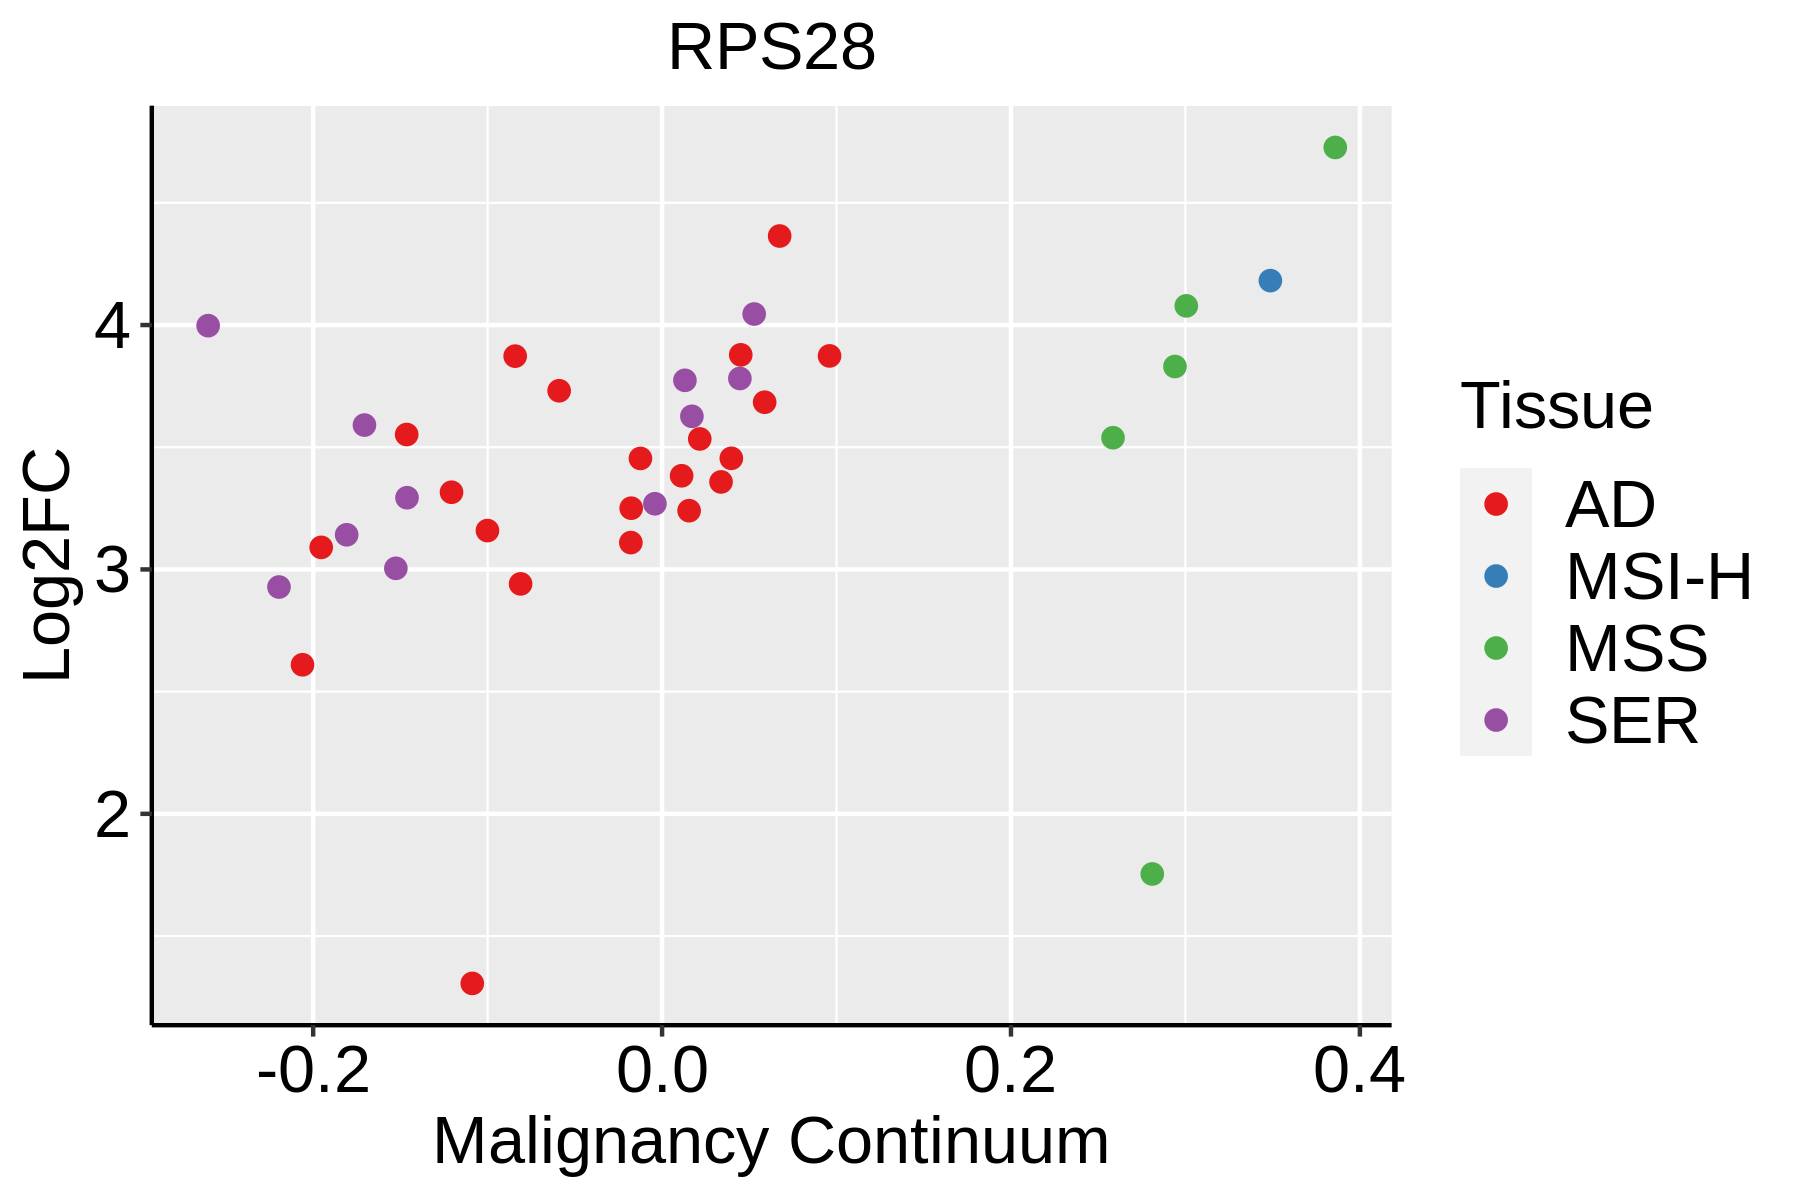 | AD: Adenomas |
| SER: Sessile serrated lesions | ||
| MSI-H: Microsatellite-high colorectal cancer | ||
| MSS: Microsatellite stable colorectal cancer | ||
| Endometrium | 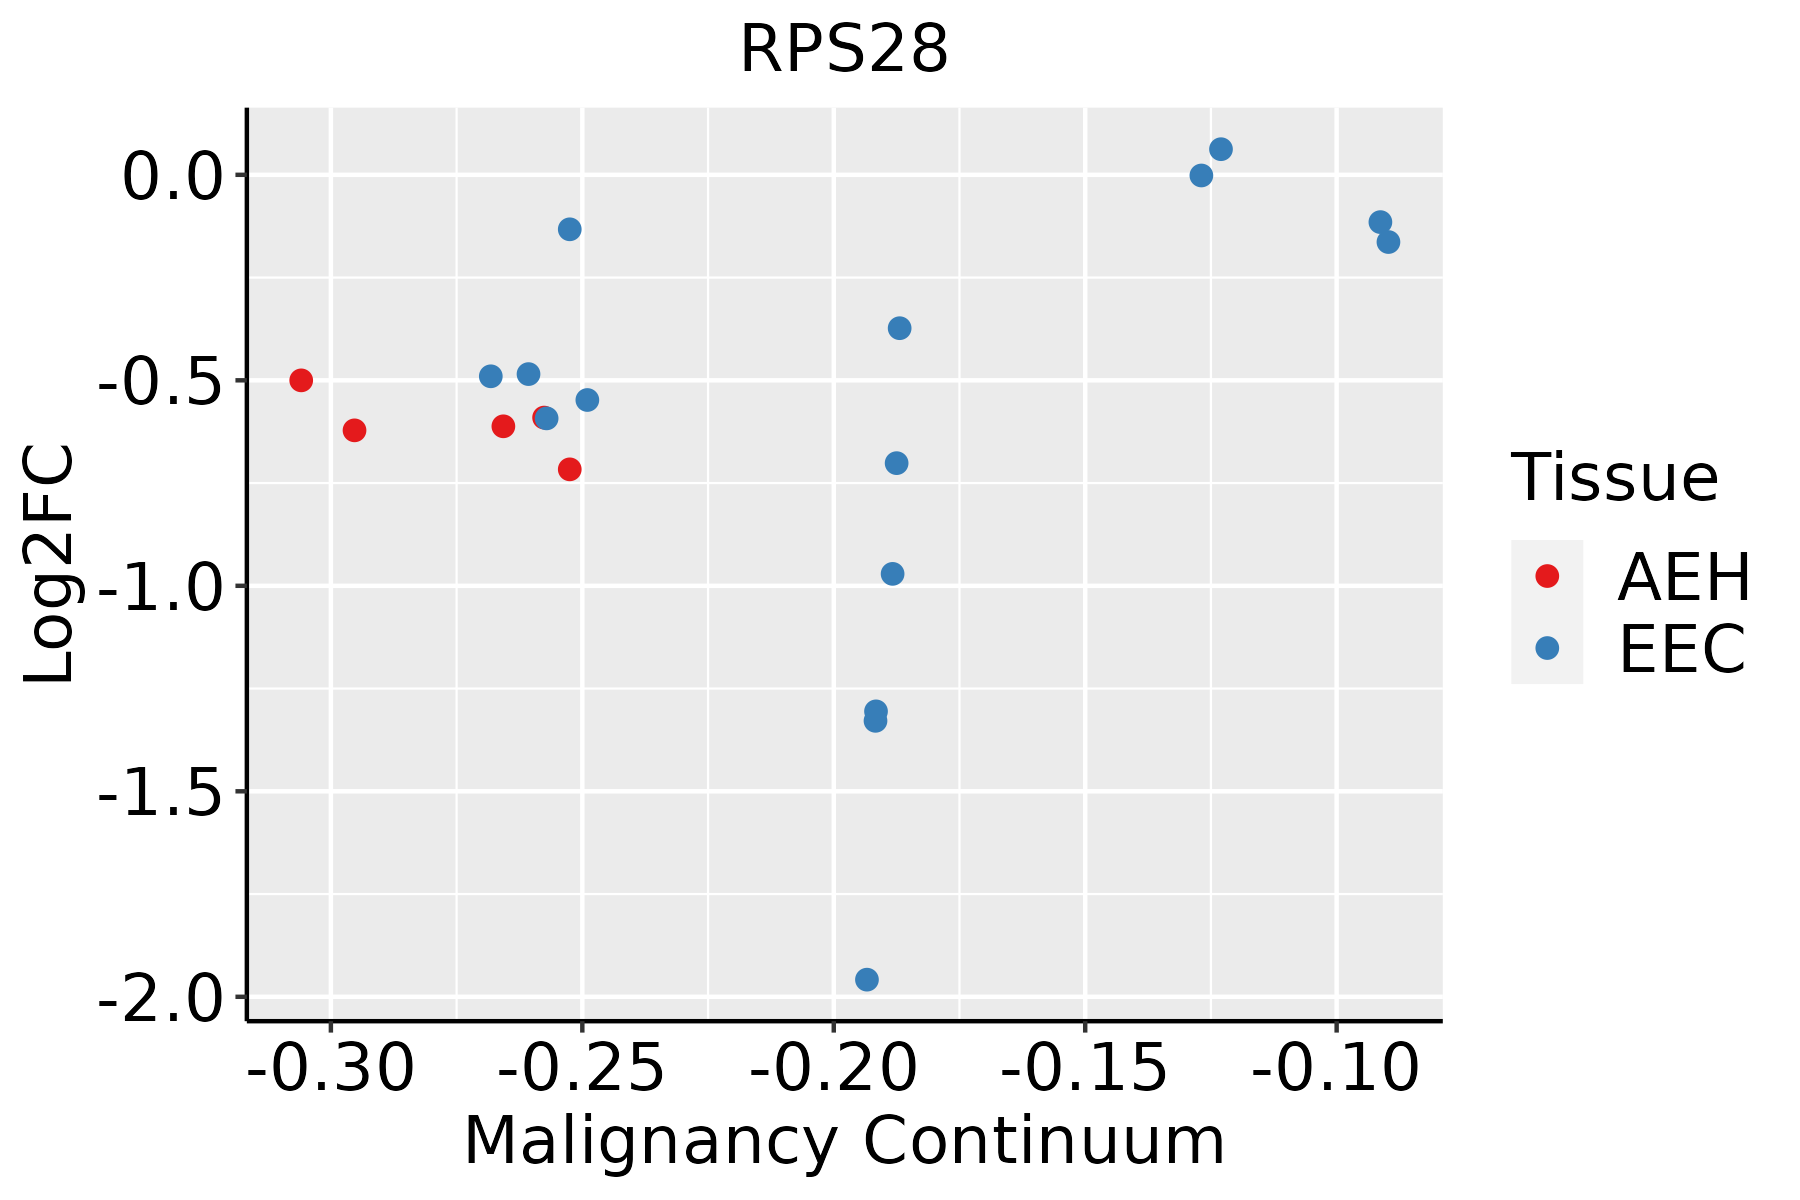 | AEH: Atypical endometrial hyperplasia |
| EEC: Endometrioid Cancer | ||
| Esophagus | 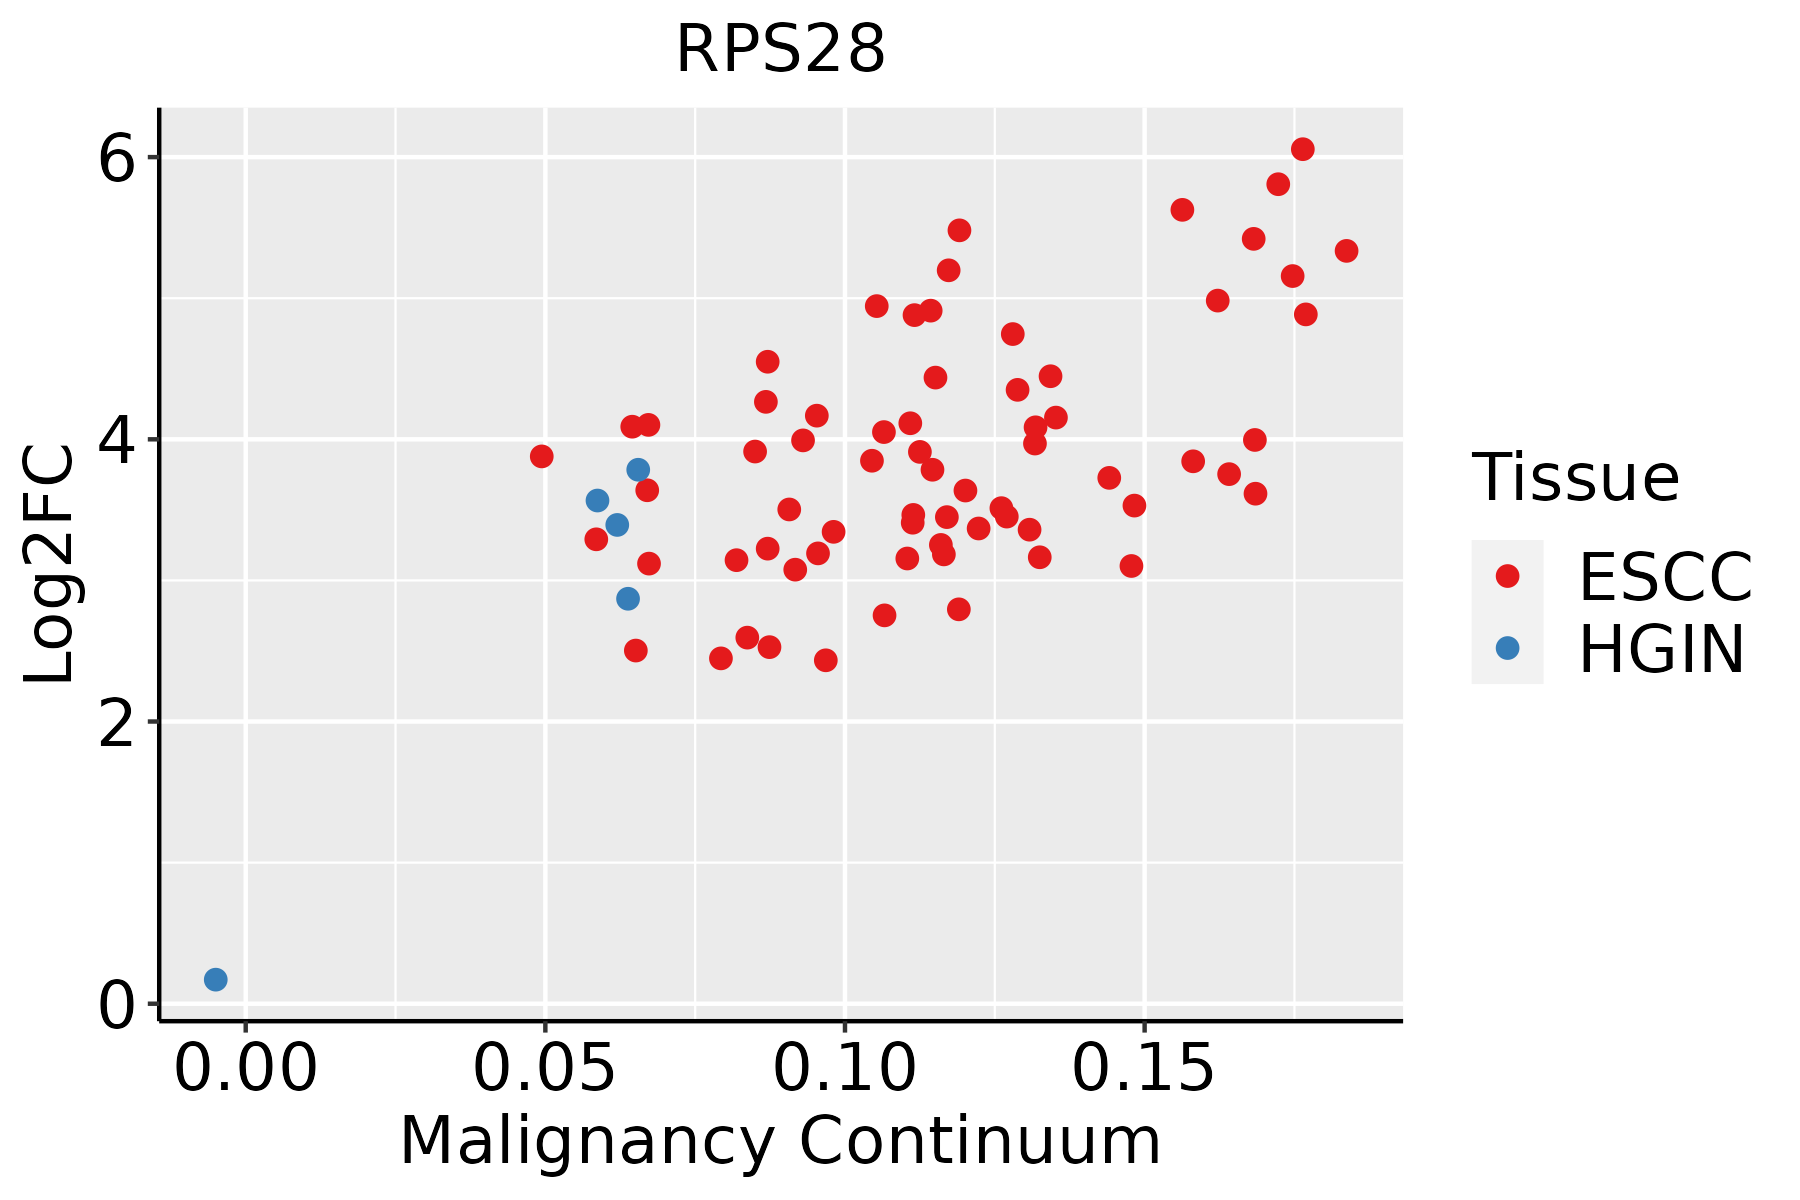 | ESCC: Esophageal squamous cell carcinoma |
| HGIN: High-grade intraepithelial neoplasias | ||
| LGIN: Low-grade intraepithelial neoplasias | ||
| GC | 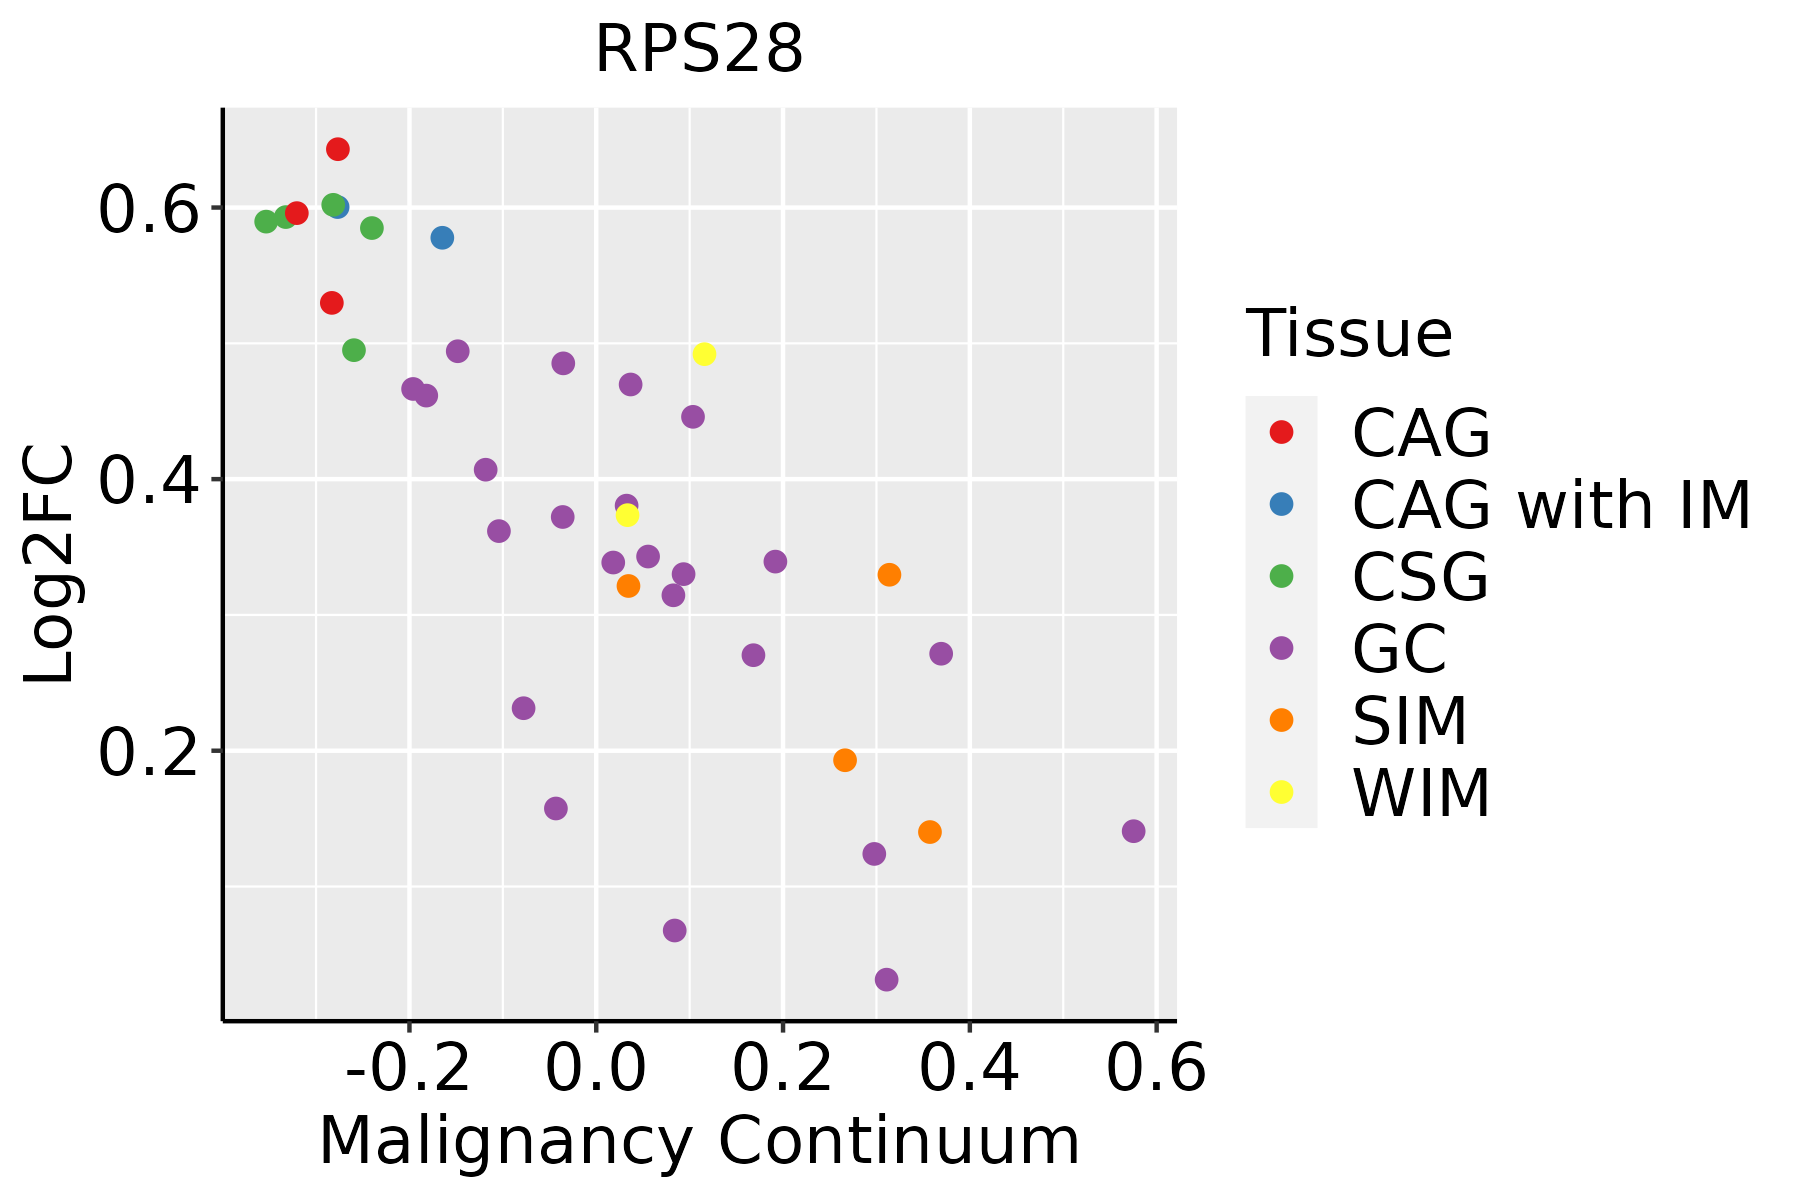 | CAG: Chronic atrophic gastritis |
| CAG with IM: Chronic atrophic gastritis with intestinal metaplasia | ||
| CSG: Chronic superficial gastritis | ||
| GC: Gastric cancer | ||
| SIM: Severe intestinal metaplasia | ||
| WIM: Wild intestinal metaplasia | ||
| Liver |  | HCC: Hepatocellular carcinoma |
| NAFLD: Non-alcoholic fatty liver disease | ||
| Lung | 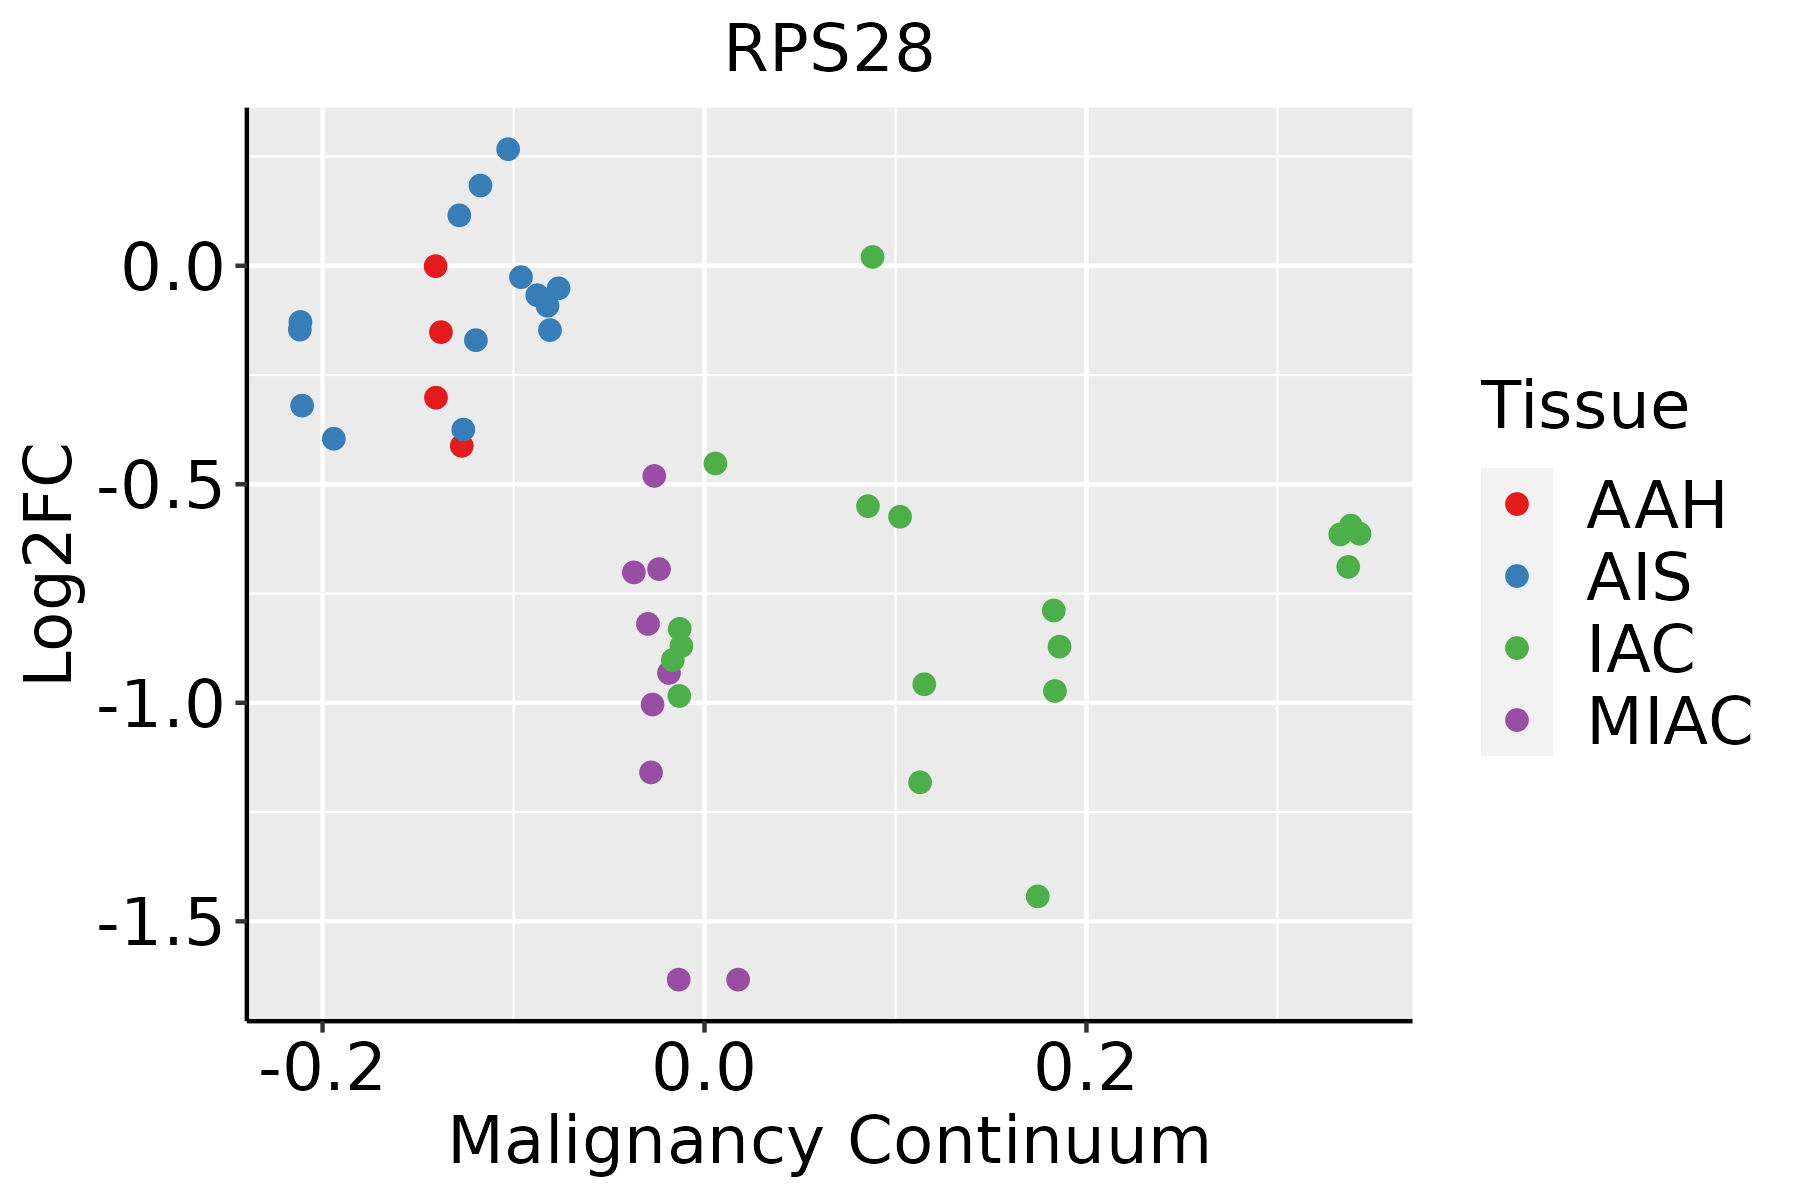 | AAH: Atypical adenomatous hyperplasia |
| AIS: Adenocarcinoma in situ | ||
| IAC: Invasive lung adenocarcinoma | ||
| MIA: Minimally invasive adenocarcinoma | ||
| Oral Cavity | 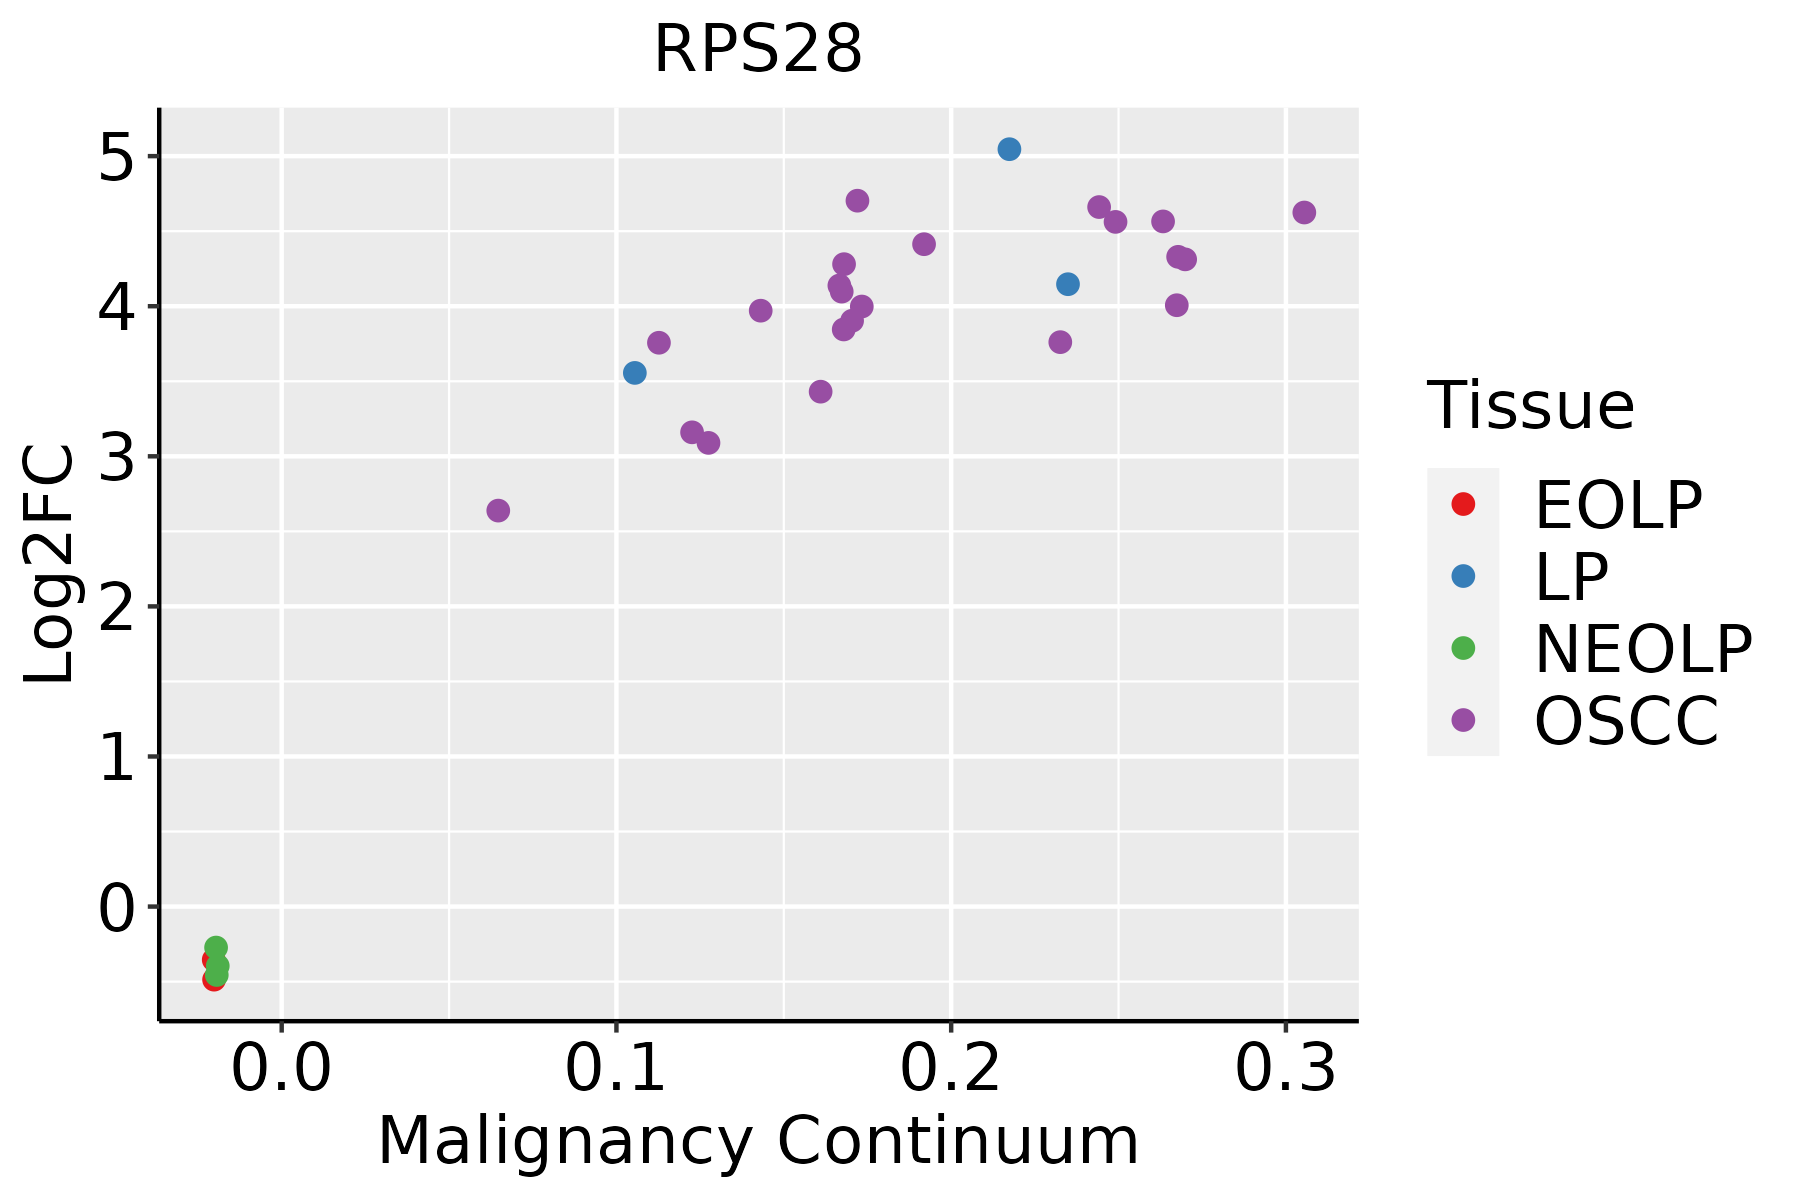 | EOLP: Erosive Oral lichen planus |
| LP: leukoplakia | ||
| NEOLP: Non-erosive oral lichen planus | ||
| OSCC: Oral squamous cell carcinoma | ||
| Prostate | 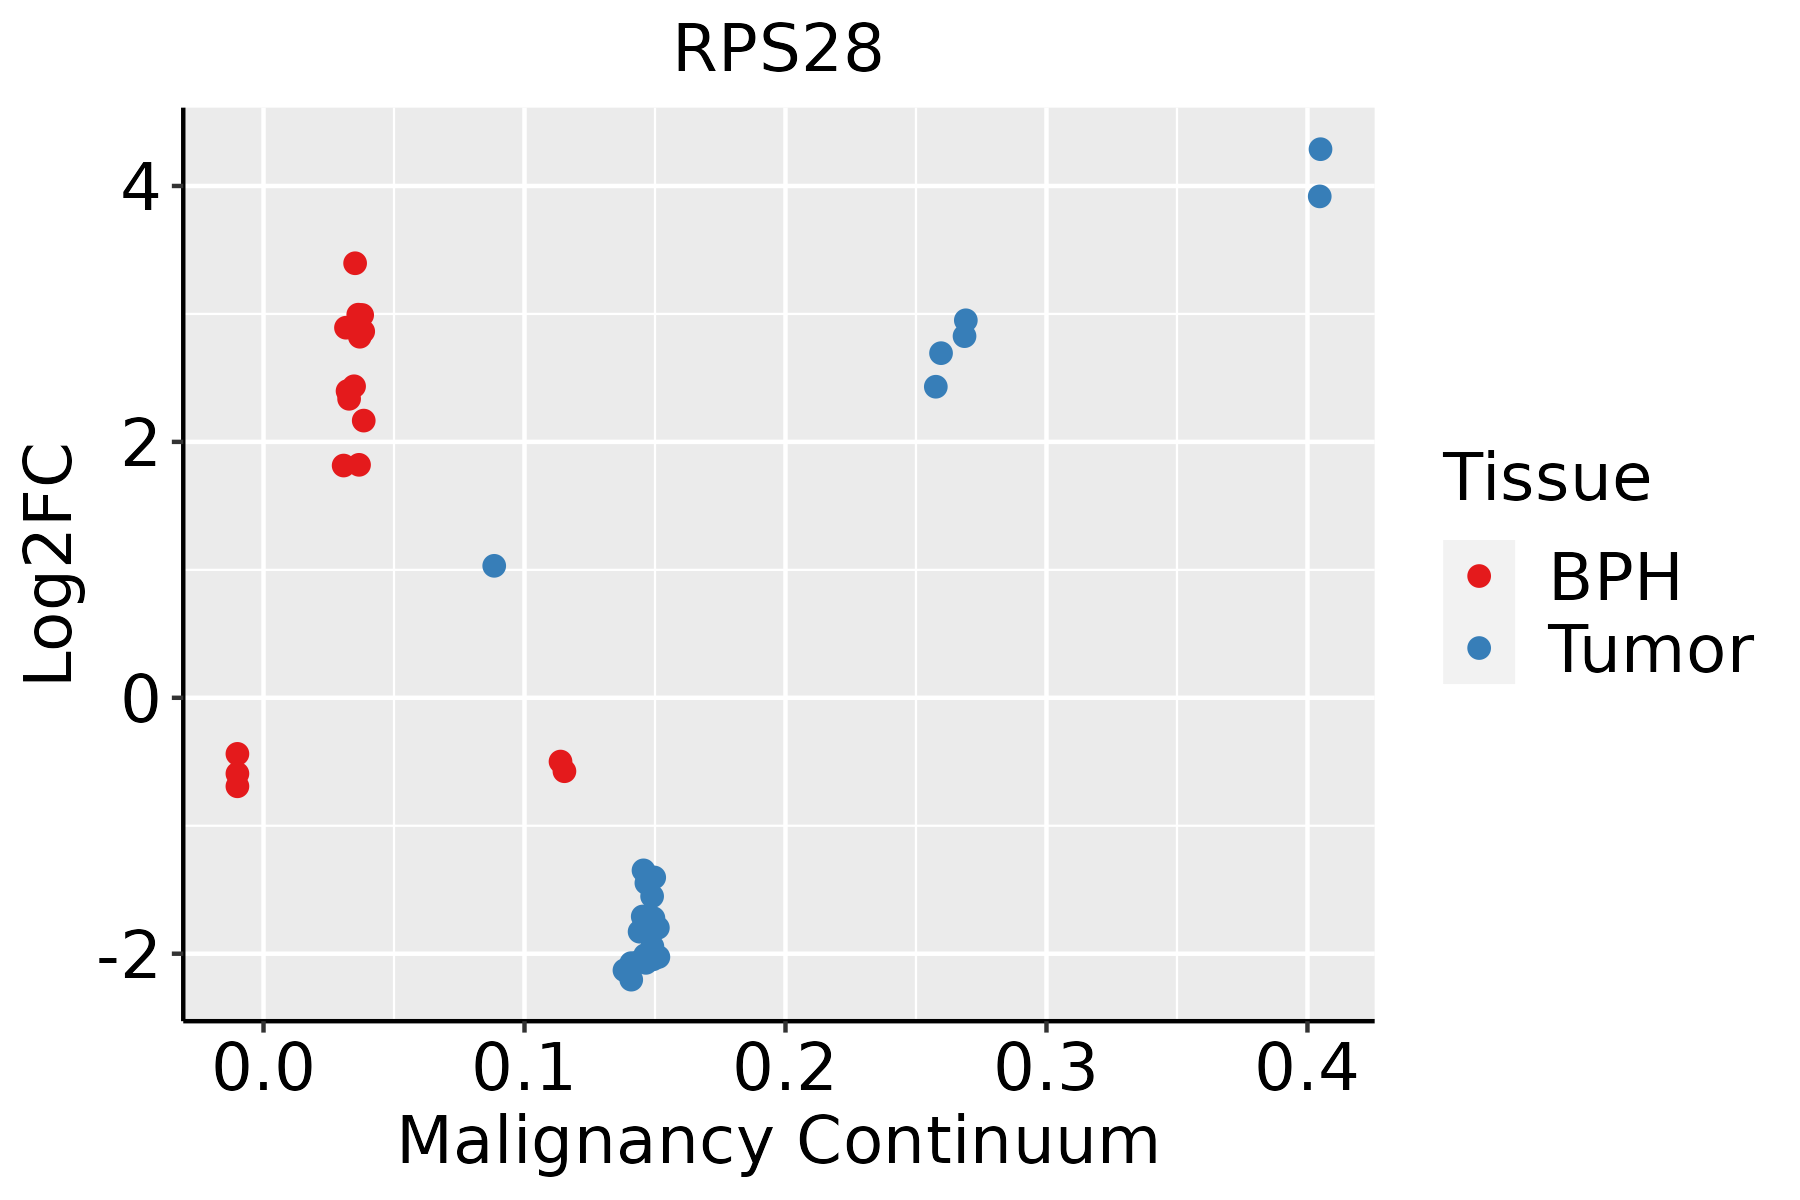 | BPH: Benign Prostatic Hyperplasia |
| Skin | 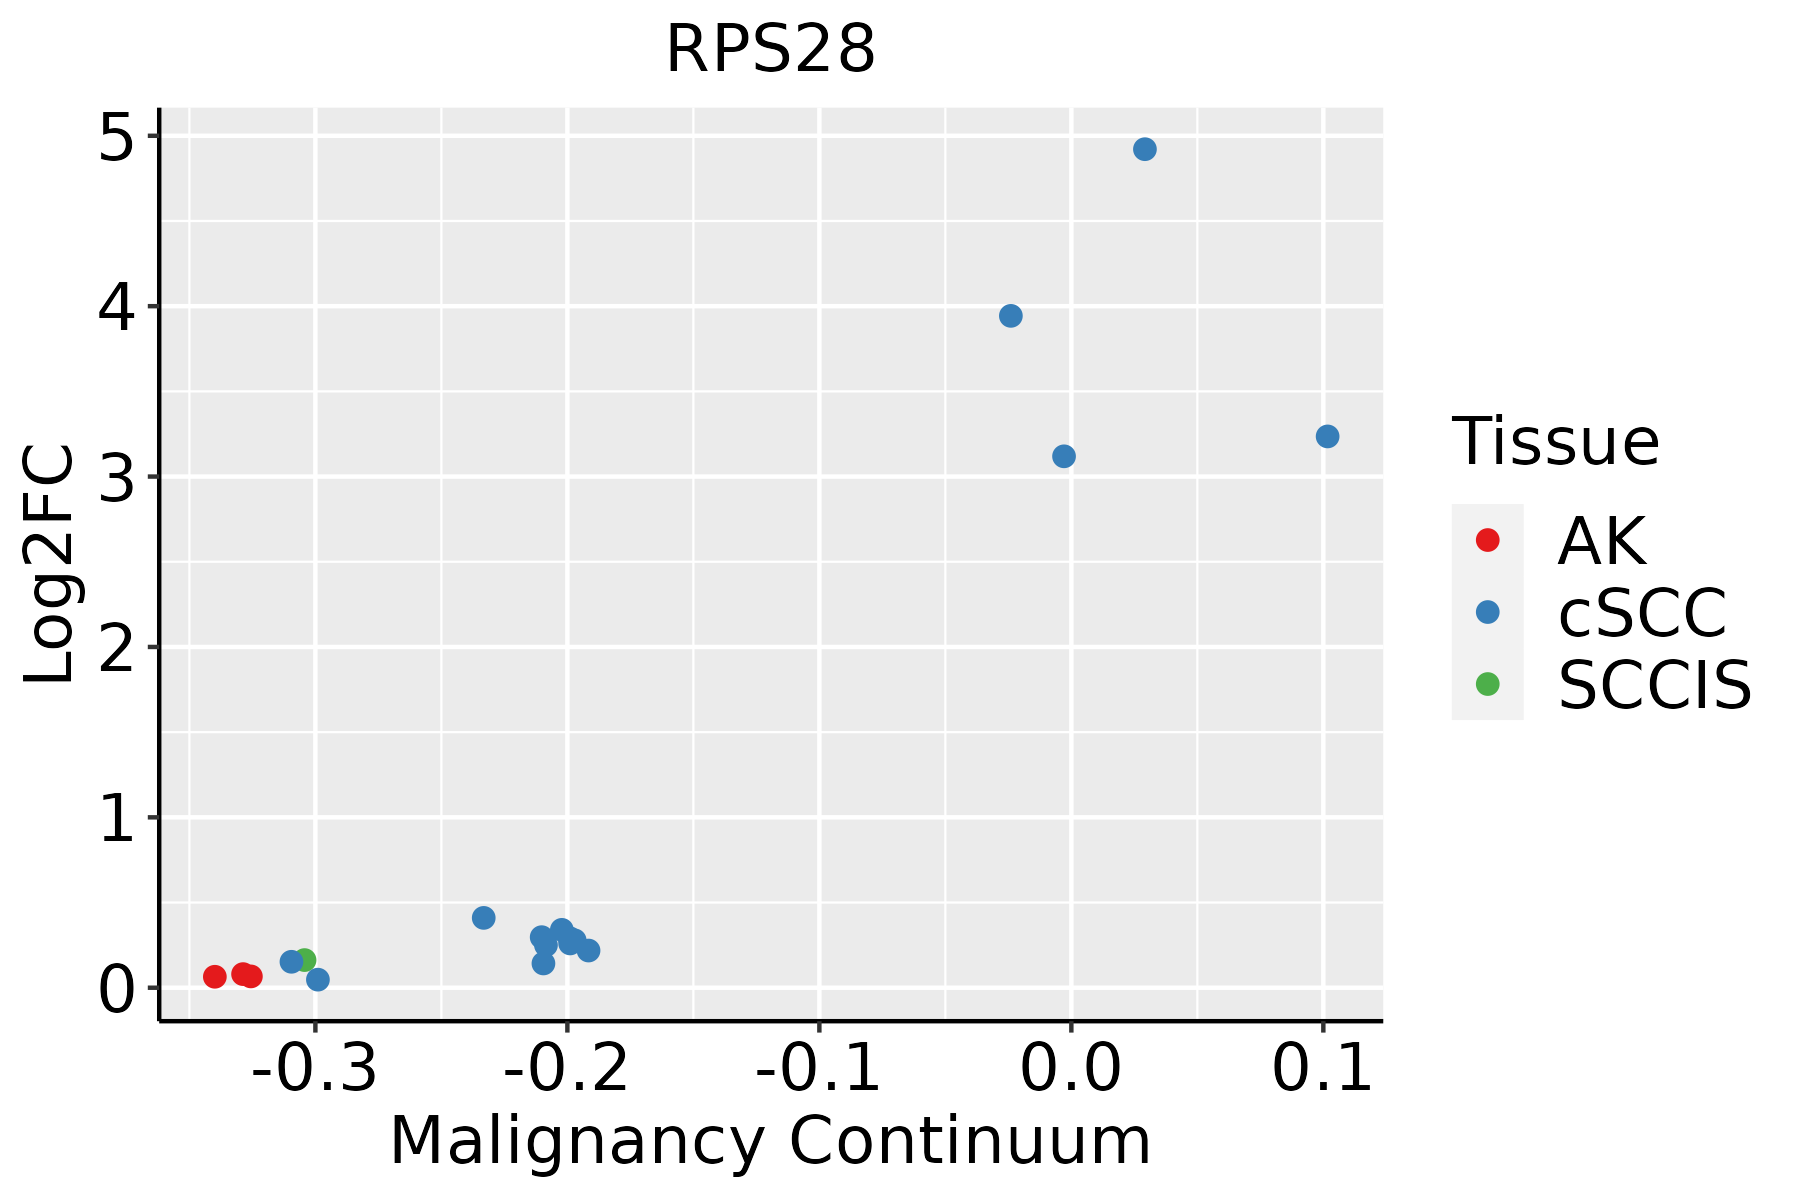 | AK: Actinic keratosis |
| cSCC: Cutaneous squamous cell carcinoma | ||
| SCCIS:squamous cell carcinoma in situ | ||
| Thyroid | 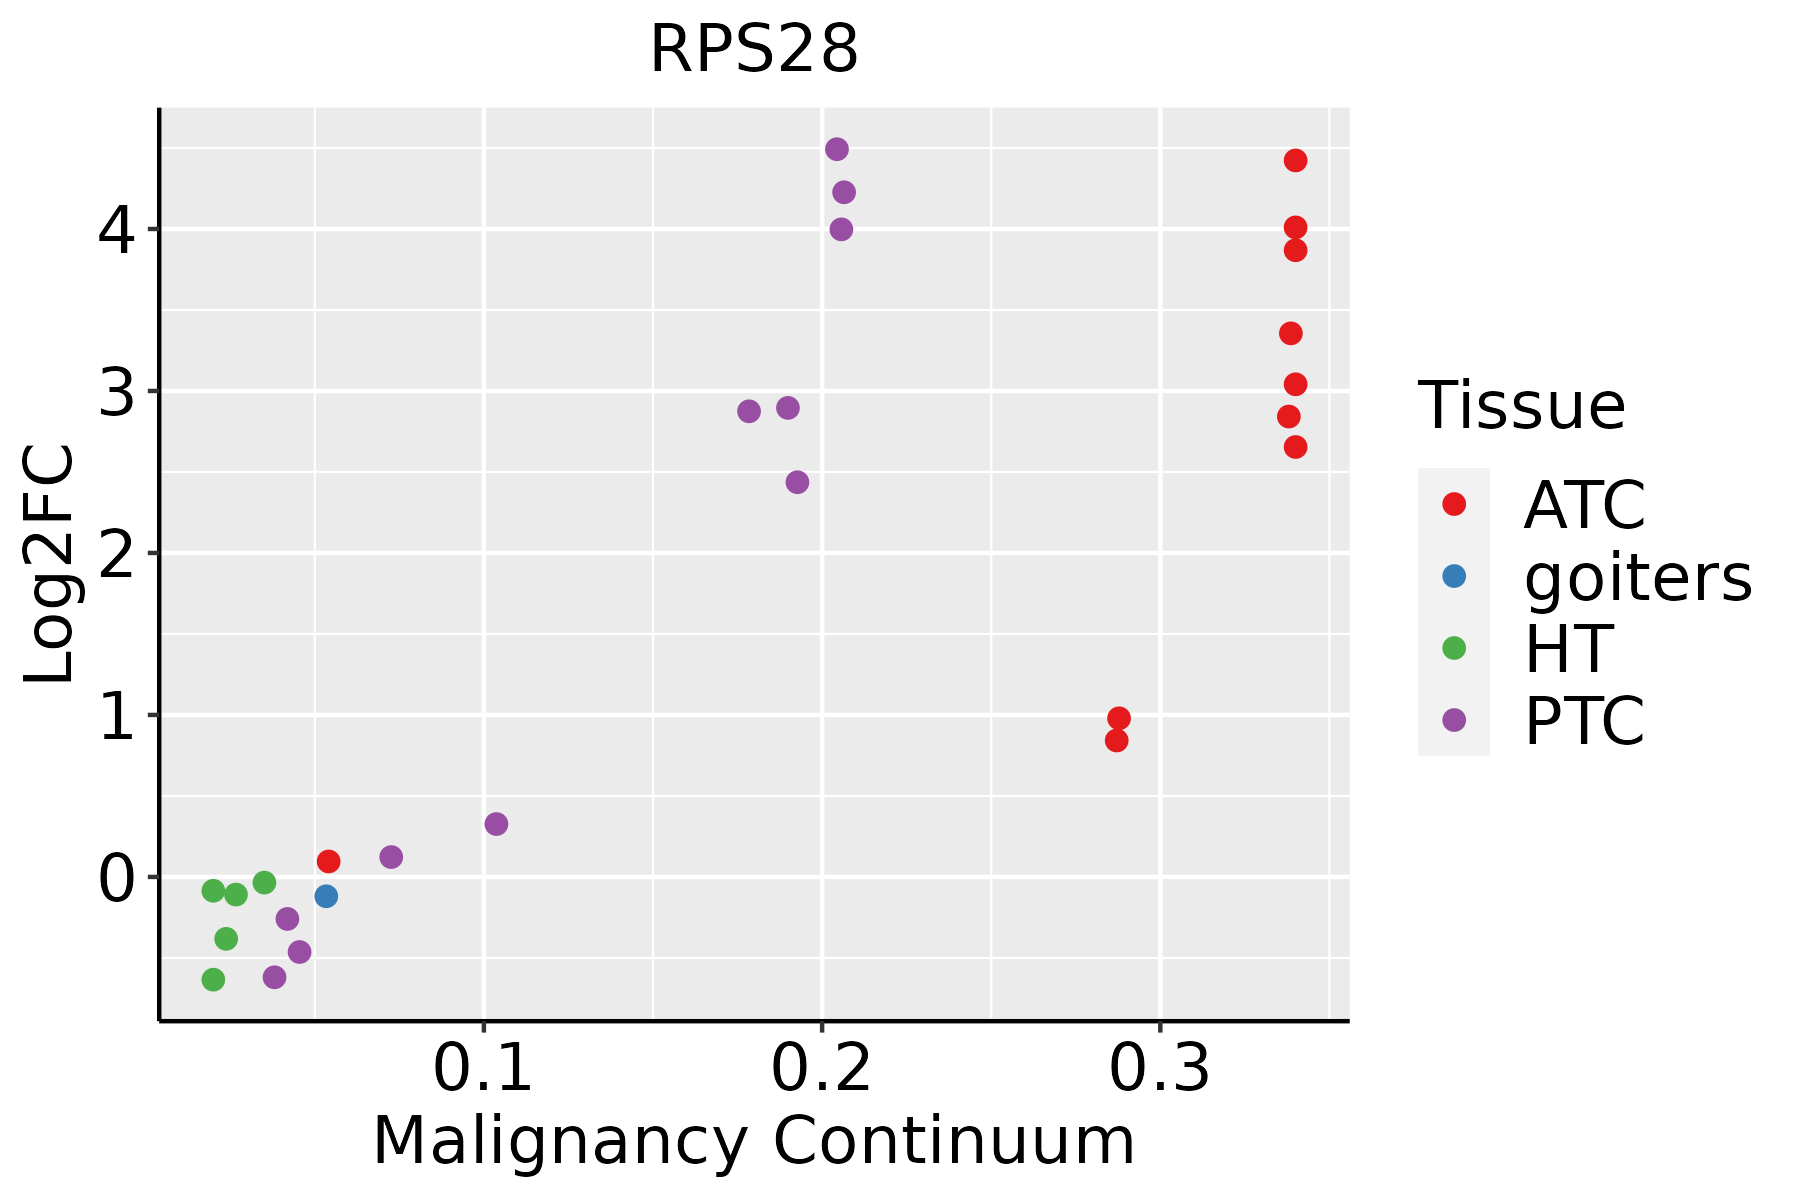 | ATC: Anaplastic thyroid cancer |
| HT: Hashimoto's thyroiditis | ||
| PTC: Papillary thyroid cancer |
| ∗log2FC in expression of this searched gene in stem-like cells from each diseased tissue sample relative to stem-like cells in normal samples in each tissue plotted against the malignancy continuum. Samples are colored based on if they are from different disease stage. |
Top |
Malignant transformation related pathway analysis |
| Find out the enriched GO biological processes and KEGG pathways involved in transition from healthy to precancer to cancer |
| Tissue | Disease Stage | Enriched GO biological Processes |
| Colorectum | AD |  |
| Colorectum | SER |  |
| Colorectum | MSS |  |
| Colorectum | MSI-H |  |
| Colorectum | FAP |  |
| ∗Top 15 enriched GO BP terms are showed in the bar plot of each disease state in each tissue. Each row represents a significant GO biological process which is colored according to the -log10(p.adjust). |
| Page: 1 2 3 4 5 6 7 8 9 |
| GO ID | Tissue | Disease Stage | Description | Gene Ratio | Bg Ratio | pvalue | p.adjust | Count |
| GO:00021819 | Breast | Precancer | cytoplasmic translation | 80/1080 | 148/18723 | 1.59e-59 | 8.54e-56 | 80 |
| GO:00226139 | Breast | Precancer | ribonucleoprotein complex biogenesis | 79/1080 | 463/18723 | 2.11e-18 | 1.03e-15 | 79 |
| GO:00718269 | Breast | Precancer | ribonucleoprotein complex subunit organization | 48/1080 | 227/18723 | 2.68e-15 | 8.45e-13 | 48 |
| GO:00226189 | Breast | Precancer | ribonucleoprotein complex assembly | 47/1080 | 220/18723 | 3.47e-15 | 1.03e-12 | 47 |
| GO:00422549 | Breast | Precancer | ribosome biogenesis | 52/1080 | 299/18723 | 7.35e-13 | 1.51e-10 | 52 |
| GO:00422559 | Breast | Precancer | ribosome assembly | 21/1080 | 61/18723 | 1.06e-11 | 1.53e-09 | 21 |
| GO:00422749 | Breast | Precancer | ribosomal small subunit biogenesis | 21/1080 | 73/18723 | 4.84e-10 | 4.39e-08 | 21 |
| GO:00000289 | Breast | Precancer | ribosomal small subunit assembly | 10/1080 | 19/18723 | 2.24e-08 | 1.50e-06 | 10 |
| GO:00063646 | Breast | Precancer | rRNA processing | 35/1080 | 225/18723 | 7.90e-08 | 4.60e-06 | 35 |
| GO:00160726 | Breast | Precancer | rRNA metabolic process | 36/1080 | 236/18723 | 8.59e-08 | 4.84e-06 | 36 |
| GO:00344705 | Breast | Precancer | ncRNA processing | 42/1080 | 395/18723 | 9.91e-05 | 1.83e-03 | 42 |
| GO:00346604 | Breast | Precancer | ncRNA metabolic process | 45/1080 | 485/18723 | 1.15e-03 | 1.26e-02 | 45 |
| GO:00304902 | Breast | Precancer | maturation of SSU-rRNA | 8/1080 | 50/18723 | 7.39e-03 | 4.90e-02 | 8 |
| GO:000218114 | Breast | IDC | cytoplasmic translation | 82/1434 | 148/18723 | 2.60e-52 | 1.48e-48 | 82 |
| GO:002261314 | Breast | IDC | ribonucleoprotein complex biogenesis | 83/1434 | 463/18723 | 2.01e-13 | 5.20e-11 | 83 |
| GO:007182614 | Breast | IDC | ribonucleoprotein complex subunit organization | 52/1434 | 227/18723 | 5.18e-13 | 1.21e-10 | 52 |
| GO:002261814 | Breast | IDC | ribonucleoprotein complex assembly | 51/1434 | 220/18723 | 5.32e-13 | 1.21e-10 | 51 |
| GO:004225514 | Breast | IDC | ribosome assembly | 21/1434 | 61/18723 | 1.98e-09 | 1.76e-07 | 21 |
| GO:004225414 | Breast | IDC | ribosome biogenesis | 52/1434 | 299/18723 | 1.90e-08 | 1.32e-06 | 52 |
| GO:004227414 | Breast | IDC | ribosomal small subunit biogenesis | 21/1434 | 73/18723 | 7.23e-08 | 4.42e-06 | 21 |
| Page: 1 2 3 4 5 6 7 8 9 10 11 12 13 14 15 16 17 18 19 20 21 22 23 |
| Pathway ID | Tissue | Disease Stage | Description | Gene Ratio | Bg Ratio | pvalue | p.adjust | qvalue | Count |
| hsa0301012 | Stomach | GC | Ribosome | 64/708 | 167/8465 | 2.58e-27 | 8.26e-25 | 5.81e-25 | 64 |
| hsa0517112 | Stomach | GC | Coronavirus disease - COVID-19 | 71/708 | 232/8465 | 2.32e-23 | 3.72e-21 | 2.62e-21 | 71 |
| hsa0301013 | Stomach | GC | Ribosome | 64/708 | 167/8465 | 2.58e-27 | 8.26e-25 | 5.81e-25 | 64 |
| hsa0517113 | Stomach | GC | Coronavirus disease - COVID-19 | 71/708 | 232/8465 | 2.32e-23 | 3.72e-21 | 2.62e-21 | 71 |
| hsa0301021 | Stomach | CAG with IM | Ribosome | 63/640 | 167/8465 | 5.86e-29 | 1.86e-26 | 1.31e-26 | 63 |
| hsa0517121 | Stomach | CAG with IM | Coronavirus disease - COVID-19 | 68/640 | 232/8465 | 9.36e-24 | 1.49e-21 | 1.04e-21 | 68 |
| hsa0301031 | Stomach | CAG with IM | Ribosome | 63/640 | 167/8465 | 5.86e-29 | 1.86e-26 | 1.31e-26 | 63 |
| hsa0517131 | Stomach | CAG with IM | Coronavirus disease - COVID-19 | 68/640 | 232/8465 | 9.36e-24 | 1.49e-21 | 1.04e-21 | 68 |
| hsa0301041 | Stomach | CSG | Ribosome | 64/633 | 167/8465 | 3.70e-30 | 1.17e-27 | 8.41e-28 | 64 |
| hsa0517141 | Stomach | CSG | Coronavirus disease - COVID-19 | 69/633 | 232/8465 | 8.56e-25 | 1.35e-22 | 9.74e-23 | 69 |
| hsa0301051 | Stomach | CSG | Ribosome | 64/633 | 167/8465 | 3.70e-30 | 1.17e-27 | 8.41e-28 | 64 |
| hsa0517151 | Stomach | CSG | Coronavirus disease - COVID-19 | 69/633 | 232/8465 | 8.56e-25 | 1.35e-22 | 9.74e-23 | 69 |
| hsa0301061 | Stomach | CAG | Ribosome | 61/368 | 167/8465 | 2.85e-41 | 8.23e-39 | 6.59e-39 | 61 |
| hsa0517161 | Stomach | CAG | Coronavirus disease - COVID-19 | 63/368 | 232/8465 | 7.19e-34 | 1.04e-31 | 8.32e-32 | 63 |
| hsa0301071 | Stomach | CAG | Ribosome | 61/368 | 167/8465 | 2.85e-41 | 8.23e-39 | 6.59e-39 | 61 |
| hsa0517171 | Stomach | CAG | Coronavirus disease - COVID-19 | 63/368 | 232/8465 | 7.19e-34 | 1.04e-31 | 8.32e-32 | 63 |
| hsa0301081 | Stomach | WIM | Ribosome | 49/284 | 167/8465 | 1.59e-33 | 4.44e-31 | 3.54e-31 | 49 |
| hsa0517181 | Stomach | WIM | Coronavirus disease - COVID-19 | 53/284 | 232/8465 | 3.00e-30 | 4.20e-28 | 3.35e-28 | 53 |
| hsa0301091 | Stomach | WIM | Ribosome | 49/284 | 167/8465 | 1.59e-33 | 4.44e-31 | 3.54e-31 | 49 |
| hsa0517191 | Stomach | WIM | Coronavirus disease - COVID-19 | 53/284 | 232/8465 | 3.00e-30 | 4.20e-28 | 3.35e-28 | 53 |
| Page: 1 2 3 4 5 6 7 8 |
Top |
Cell-cell communication analysis |
| Identification of potential cell-cell interactions between two cell types and their ligand-receptor pairs for different disease states |
| Ligand | Receptor | LRpair | Pathway | Tissue | Disease Stage |
| Page: 1 |
Top |
Single-cell gene regulatory network inference analysis |
| Find out the significant the regulons (TFs) and the target genes of each regulon across cell types for different disease states |
| TF | Cell Type | Tissue | Disease Stage | Target Gene | RSS | Regulon Activity |
| ∗The dot plots of a searched regulon are shown for all cell subpopulations in each disease state of each tissue based on the regulon specific score inferred using pySCENIC and by calculating the average expression. |
| Page: 1 |
Top |
Somatic mutation of malignant transformation related genes |
| Annotation of somatic variants for genes involved in malignant transformation |
| Hugo Symbol | Variant Class | Variant Classification | dbSNP RS | HGVSc | HGVSp | HGVSp Short | SWISSPROT | BIOTYPE | SIFT | PolyPhen | Tumor Sample Barcode | Tissue | Histology | Sex | Age | Stage | Therapy Types | Drugs | Outcome |
| RPS28 | SNV | Missense_Mutation | c.119G>A | p.Arg40Gln | p.R40Q | P62857 | protein_coding | deleterious(0.01) | possibly_damaging(0.632) | TCGA-AD-6895-01 | Colorectum | colon adenocarcinoma | Male | >=65 | III/IV | Unknown | Unknown | SD | |
| RPS28 | SNV | Missense_Mutation | novel | c.102N>A | p.Phe34Leu | p.F34L | P62857 | protein_coding | tolerated(0.1) | benign(0.343) | TCGA-EO-A3AV-01 | Endometrium | uterine corpus endometrioid carcinoma | Female | <65 | III/IV | Chemotherapy | carboplatin | CR |
| RPS28 | SNV | Missense_Mutation | c.178N>C | p.Glu60Gln | p.E60Q | P62857 | protein_coding | deleterious(0.02) | probably_damaging(0.913) | TCGA-55-8205-01 | Lung | lung adenocarcinoma | Female | >=65 | I/II | Chemotherapy | carboplatin | PD | |
| RPS28 | SNV | Missense_Mutation | novel | c.187C>G | p.Arg63Gly | p.R63G | P62857 | protein_coding | deleterious(0) | probably_damaging(0.913) | TCGA-CQ-6222-01 | Oral cavity | head & neck squamous cell carcinoma | Male | <65 | I/II | Unspecific | SD |
| Page: 1 |
Top |
Related drugs of malignant transformation related genes |
| Identification of chemicals and drugs interact with genes involved in malignant transfromation |
| (DGIdb 4.0) |
| Entrez ID | Symbol | Category | Interaction Types | Drug Claim Name | Drug Name | PMIDs |
| Page: 1 |

Copyright 2023-Present -The University of Texas Health Science Center at Houston |