| Tissue | Expression Dynamics | Abbreviation |
| Esophagus | 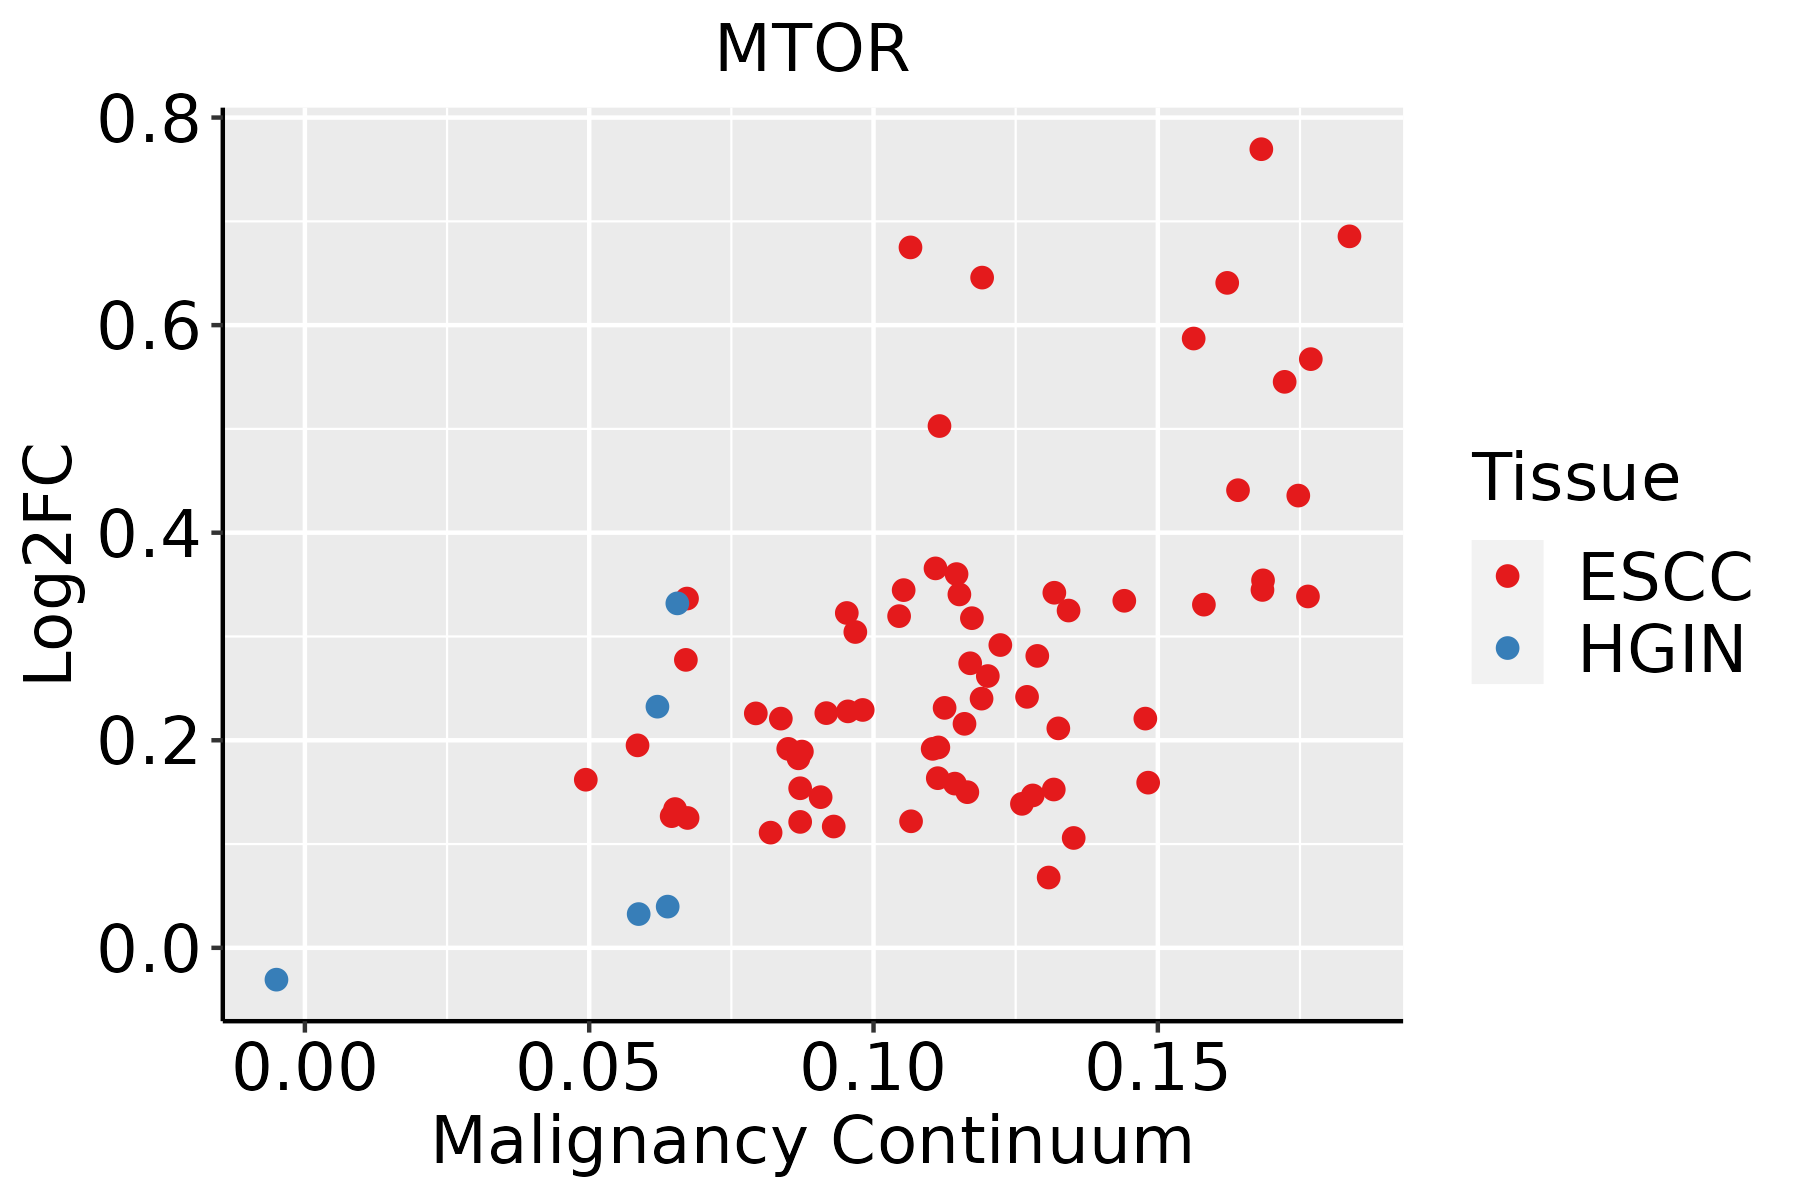 | ESCC: Esophageal squamous cell carcinoma |
| HGIN: High-grade intraepithelial neoplasias |
| LGIN: Low-grade intraepithelial neoplasias |
| Liver |  | HCC: Hepatocellular carcinoma |
| NAFLD: Non-alcoholic fatty liver disease |
| Oral Cavity | 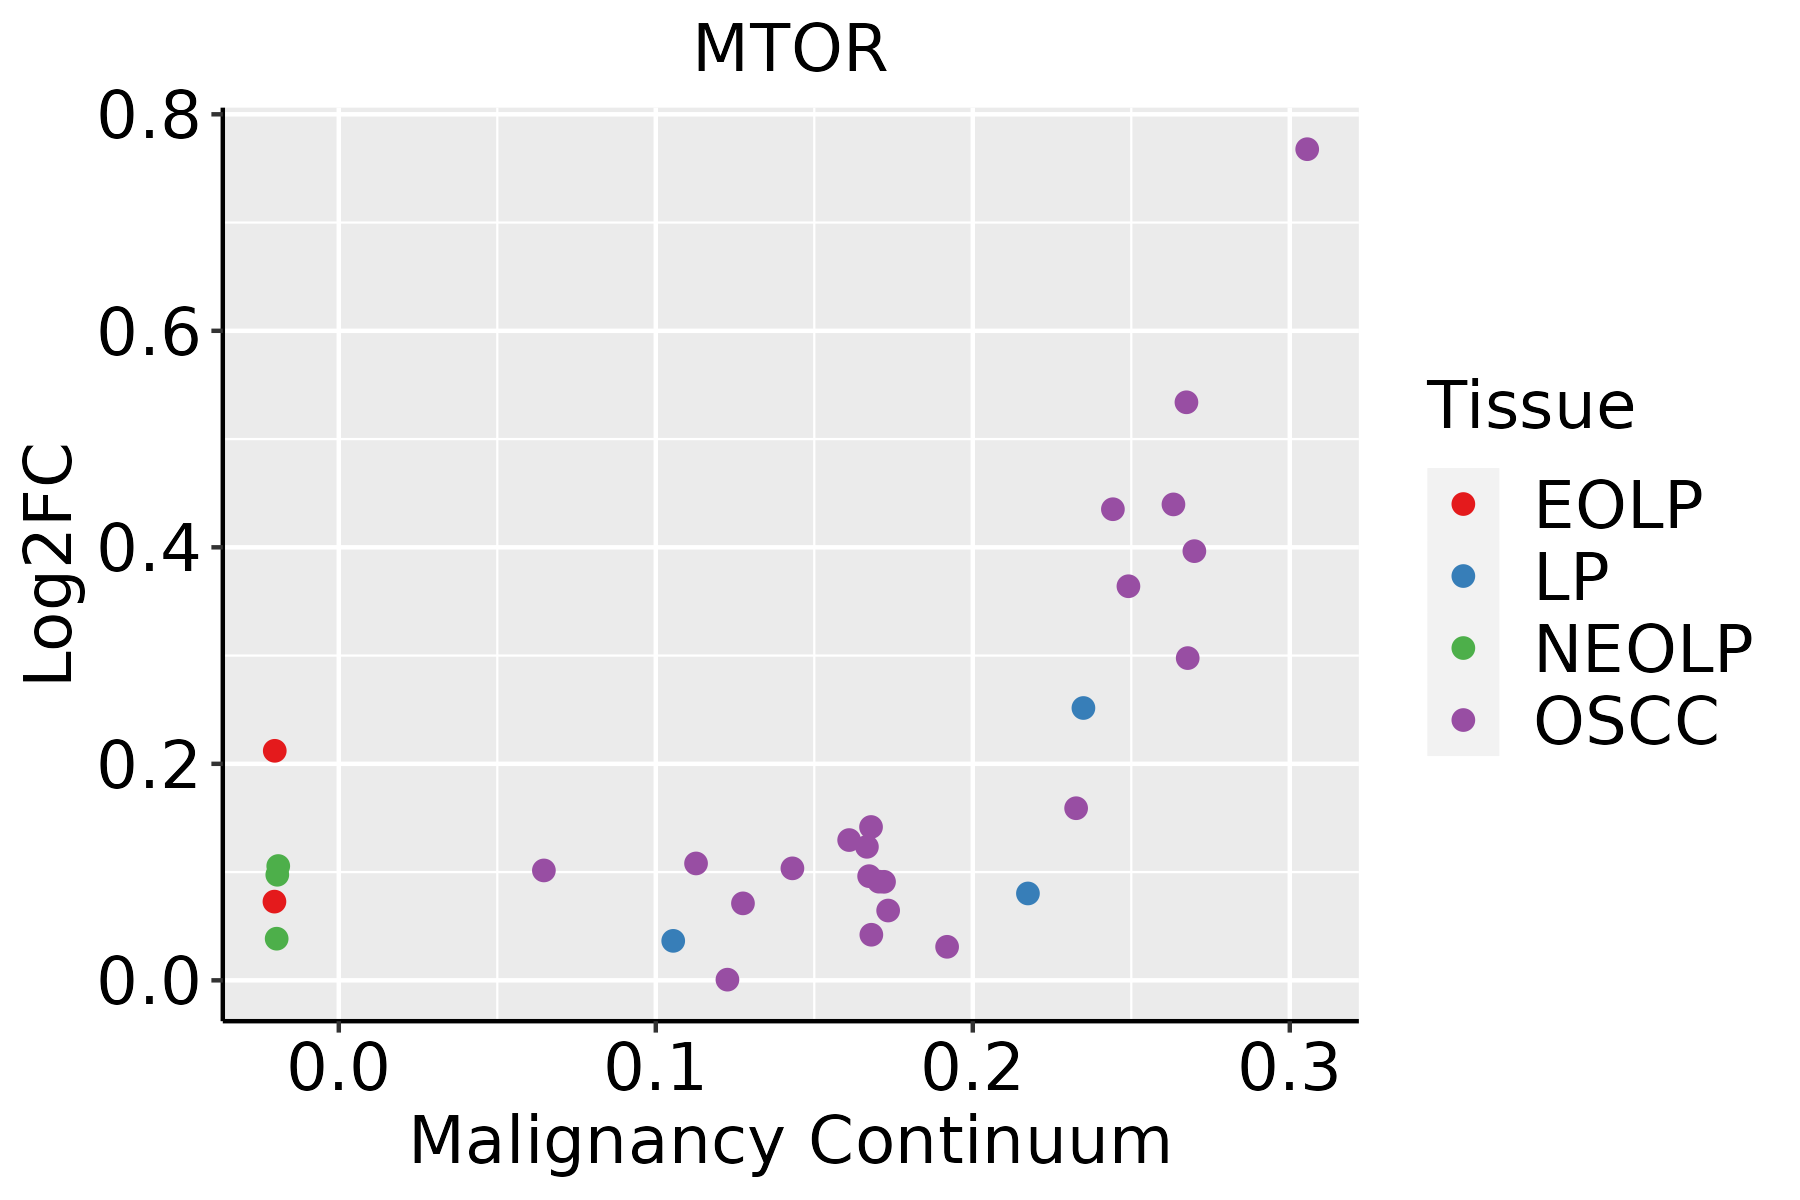 | EOLP: Erosive Oral lichen planus |
| LP: leukoplakia |
| NEOLP: Non-erosive oral lichen planus |
| OSCC: Oral squamous cell carcinoma |
| Prostate | 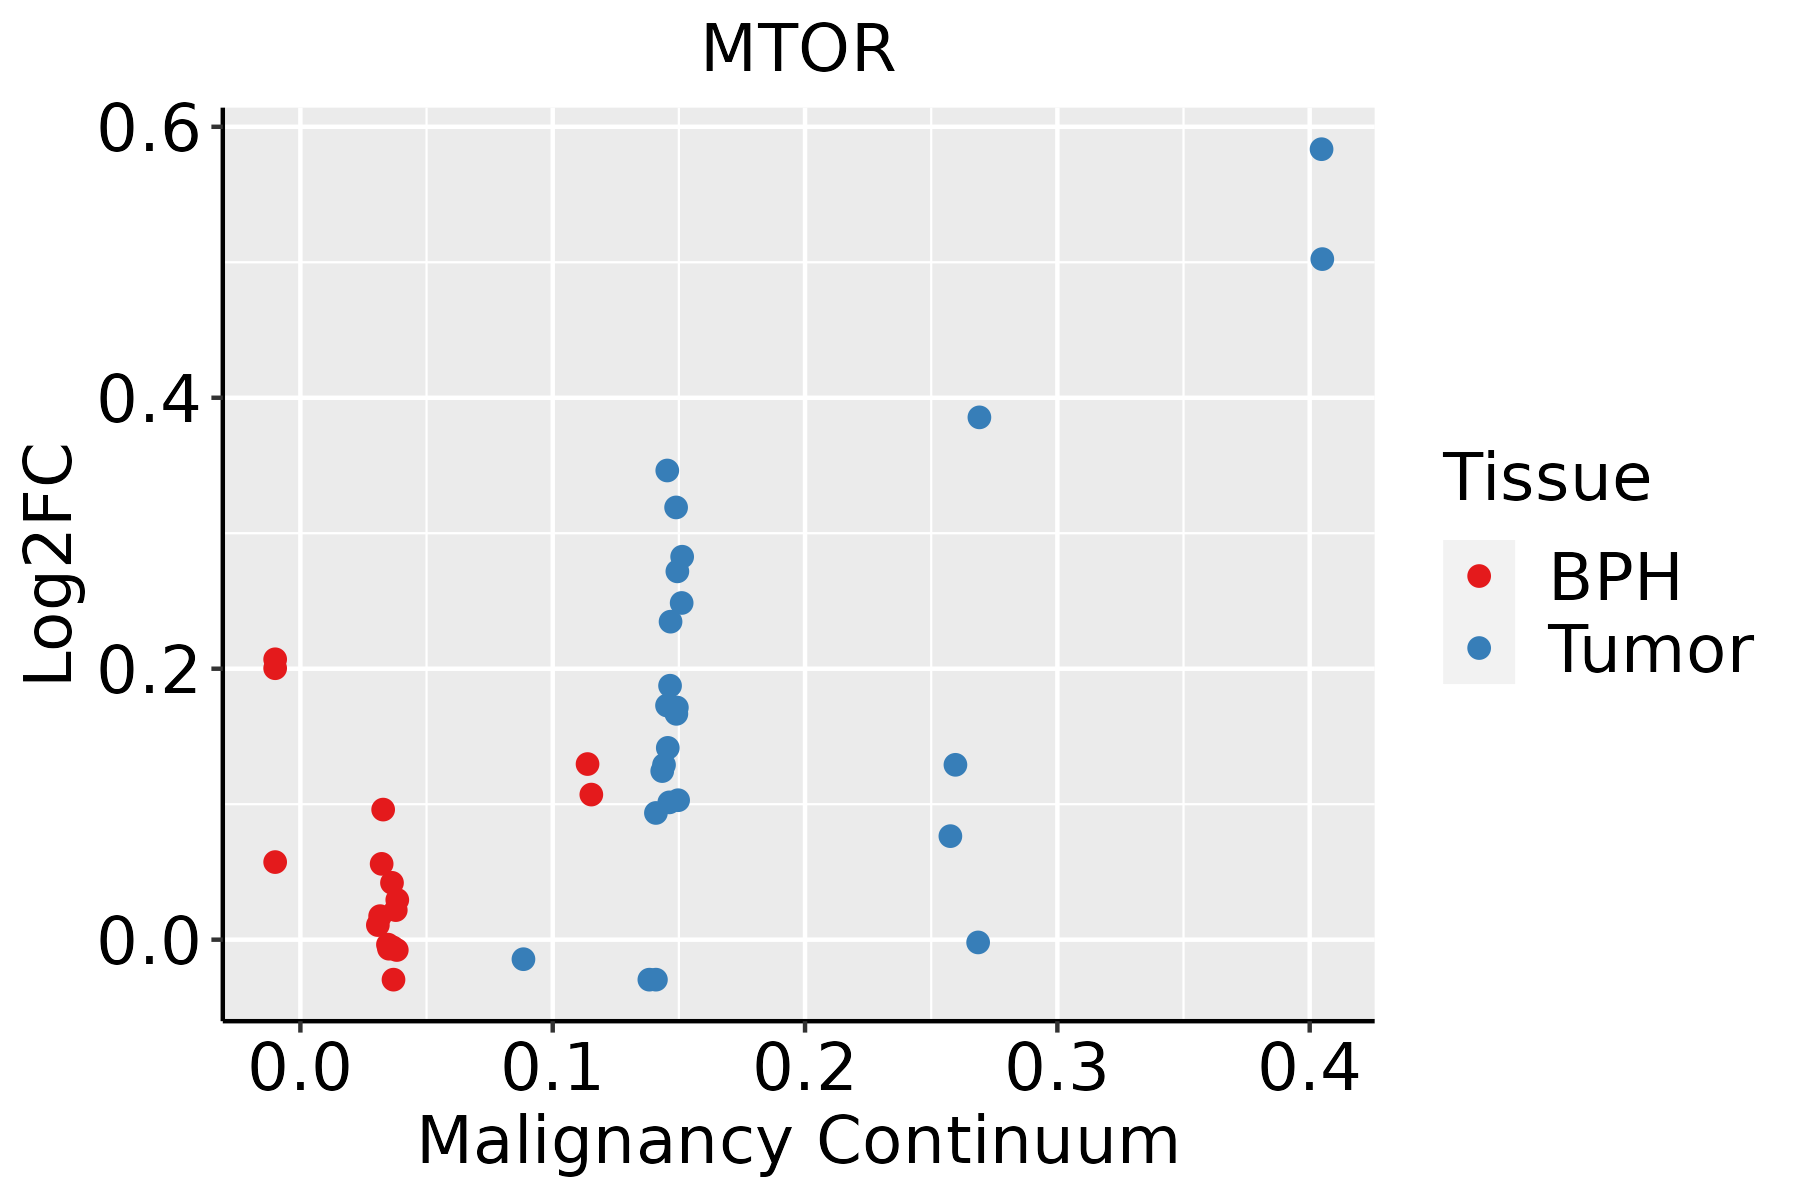 | BPH: Benign Prostatic Hyperplasia |
| GO ID | Tissue | Disease Stage | Description | Gene Ratio | Bg Ratio | pvalue | p.adjust | Count |
| GO:00016678 | Breast | Precancer | ameboidal-type cell migration | 47/1080 | 475/18723 | 2.19e-04 | 3.35e-03 | 47 |
| GO:00160497 | Breast | Precancer | cell growth | 46/1080 | 482/18723 | 5.63e-04 | 7.16e-03 | 46 |
| GO:00192164 | Breast | Precancer | regulation of lipid metabolic process | 34/1080 | 331/18723 | 8.14e-04 | 9.55e-03 | 34 |
| GO:00015587 | Breast | Precancer | regulation of cell growth | 39/1080 | 414/18723 | 1.81e-03 | 1.78e-02 | 39 |
| GO:00011015 | Breast | Precancer | response to acid chemical | 16/1080 | 135/18723 | 4.85e-03 | 3.67e-02 | 16 |
| GO:01501158 | Breast | Precancer | cell-substrate junction organization | 13/1080 | 101/18723 | 5.30e-03 | 3.94e-02 | 13 |
| GO:01501168 | Breast | Precancer | regulation of cell-substrate junction organization | 10/1080 | 71/18723 | 7.33e-03 | 4.88e-02 | 10 |
| GO:000166714 | Breast | IDC | ameboidal-type cell migration | 64/1434 | 475/18723 | 6.65e-06 | 2.05e-04 | 64 |
| GO:001921612 | Breast | IDC | regulation of lipid metabolic process | 45/1434 | 331/18723 | 1.21e-04 | 2.24e-03 | 45 |
| GO:00192184 | Breast | IDC | regulation of steroid metabolic process | 18/1434 | 100/18723 | 5.40e-04 | 6.96e-03 | 18 |
| GO:001604913 | Breast | IDC | cell growth | 56/1434 | 482/18723 | 1.16e-03 | 1.26e-02 | 56 |
| GO:000155813 | Breast | IDC | regulation of cell growth | 49/1434 | 414/18723 | 1.55e-03 | 1.55e-02 | 49 |
| GO:000110112 | Breast | IDC | response to acid chemical | 20/1434 | 135/18723 | 3.28e-03 | 2.75e-02 | 20 |
| GO:00431126 | Breast | IDC | receptor metabolic process | 23/1434 | 166/18723 | 4.04e-03 | 3.25e-02 | 23 |
| GO:00432003 | Breast | IDC | response to amino acid | 17/1434 | 116/18723 | 7.13e-03 | 4.92e-02 | 17 |
| GO:000166723 | Breast | DCIS | ameboidal-type cell migration | 62/1390 | 475/18723 | 9.60e-06 | 2.56e-04 | 62 |
| GO:001921621 | Breast | DCIS | regulation of lipid metabolic process | 43/1390 | 331/18723 | 2.37e-04 | 3.71e-03 | 43 |
| GO:001604923 | Breast | DCIS | cell growth | 54/1390 | 482/18723 | 1.60e-03 | 1.59e-02 | 54 |
| GO:000155822 | Breast | DCIS | regulation of cell growth | 47/1390 | 414/18723 | 2.39e-03 | 2.16e-02 | 47 |
| GO:004311213 | Breast | DCIS | receptor metabolic process | 23/1390 | 166/18723 | 2.75e-03 | 2.41e-02 | 23 |
| Pathway ID | Tissue | Disease Stage | Description | Gene Ratio | Bg Ratio | pvalue | p.adjust | qvalue | Count |
| hsa0521231 | Liver | HCC | Pancreatic cancer | 54/4020 | 76/8465 | 2.50e-05 | 1.64e-04 | 9.12e-05 | 54 |
| hsa0522511 | Liver | HCC | Hepatocellular carcinoma | 106/4020 | 168/8465 | 2.87e-05 | 1.85e-04 | 1.03e-04 | 106 |
| hsa0501731 | Liver | HCC | Spinocerebellar ataxia | 92/4020 | 143/8465 | 3.20e-05 | 1.88e-04 | 1.04e-04 | 92 |
| hsa0421131 | Liver | HCC | Longevity regulating pathway | 61/4020 | 89/8465 | 4.46e-05 | 2.37e-04 | 1.32e-04 | 61 |
| hsa0415251 | Liver | HCC | AMPK signaling pathway | 77/4020 | 121/8465 | 2.32e-04 | 1.11e-03 | 6.18e-04 | 77 |
| hsa0406632 | Liver | HCC | HIF-1 signaling pathway | 70/4020 | 109/8465 | 2.96e-04 | 1.36e-03 | 7.57e-04 | 70 |
| hsa051653 | Liver | HCC | Human papillomavirus infection | 188/4020 | 331/8465 | 3.34e-04 | 1.49e-03 | 8.29e-04 | 188 |
| hsa0517012 | Liver | HCC | Human immunodeficiency virus 1 infection | 125/4020 | 212/8465 | 4.51e-04 | 1.94e-03 | 1.08e-03 | 125 |
| hsa0415011 | Liver | HCC | mTOR signaling pathway | 95/4020 | 156/8465 | 4.70e-04 | 1.99e-03 | 1.11e-03 | 95 |
| hsa0520531 | Liver | HCC | Proteoglycans in cancer | 121/4020 | 205/8465 | 5.22e-04 | 2.18e-03 | 1.21e-03 | 121 |
| hsa0516332 | Liver | HCC | Human cytomegalovirus infection | 131/4020 | 225/8465 | 6.86e-04 | 2.77e-03 | 1.54e-03 | 131 |
| hsa0491913 | Liver | HCC | Thyroid hormone signaling pathway | 75/4020 | 121/8465 | 8.76e-04 | 3.38e-03 | 1.88e-03 | 75 |
| hsa0401211 | Liver | HCC | ErbB signaling pathway | 54/4020 | 85/8465 | 2.02e-03 | 7.07e-03 | 3.93e-03 | 54 |
| hsa049203 | Liver | HCC | Adipocytokine signaling pathway | 45/4020 | 69/8465 | 2.19e-03 | 7.55e-03 | 4.20e-03 | 45 |
| hsa0421311 | Liver | HCC | Longevity regulating pathway - multiple species | 41/4020 | 62/8465 | 2.30e-03 | 7.86e-03 | 4.37e-03 | 41 |
| hsa0516731 | Liver | HCC | Kaposi sarcoma-associated herpesvirus infection | 111/4020 | 194/8465 | 3.78e-03 | 1.16e-02 | 6.45e-03 | 111 |
| hsa0521411 | Liver | HCC | Glioma | 47/4020 | 75/8465 | 5.67e-03 | 1.62e-02 | 9.02e-03 | 47 |
| hsa0152131 | Liver | HCC | EGFR tyrosine kinase inhibitor resistance | 48/4020 | 79/8465 | 1.19e-02 | 2.99e-02 | 1.66e-02 | 48 |
| hsa015221 | Liver | HCC | Endocrine resistance | 58/4020 | 98/8465 | 1.28e-02 | 3.19e-02 | 1.78e-02 | 58 |
| hsa0523031 | Liver | HCC | Central carbon metabolism in cancer | 43/4020 | 70/8465 | 1.30e-02 | 3.19e-02 | 1.78e-02 | 43 |
| Hugo Symbol | Variant Class | Variant Classification | dbSNP RS | HGVSc | HGVSp | HGVSp Short | SWISSPROT | BIOTYPE | SIFT | PolyPhen | Tumor Sample Barcode | Tissue | Histology | Sex | Age | Stage | Therapy Types | Drugs | Outcome |
| MTOR | SNV | Missense_Mutation | novel | c.7184A>G | p.Asn2395Ser | p.N2395S | P42345 | protein_coding | tolerated(1) | possibly_damaging(0.703) | TCGA-A2-A0D2-01 | Breast | breast invasive carcinoma | Female | <65 | I/II | Chemotherapy | adriamycin | SD |
| MTOR | SNV | Missense_Mutation | | c.7498N>T | p.Ile2500Phe | p.I2500F | P42345 | protein_coding | deleterious(0) | probably_damaging(0.926) | TCGA-A8-A06Y-01 | Breast | breast invasive carcinoma | Female | >=65 | I/II | Hormone Therapy | anastrozole | PD |
| MTOR | SNV | Missense_Mutation | rs769877976 | c.25G>A | p.Ala9Thr | p.A9T | P42345 | protein_coding | deleterious_low_confidence(0.01) | possibly_damaging(0.835) | TCGA-A8-A08S-01 | Breast | breast invasive carcinoma | Female | >=65 | I/II | Hormone Therapy | anastrozole | SD |
| MTOR | SNV | Missense_Mutation | novel | c.6287N>T | p.Asp2096Val | p.D2096V | P42345 | protein_coding | deleterious(0) | probably_damaging(0.998) | TCGA-AN-A03Y-01 | Breast | breast invasive carcinoma | Female | >=65 | I/II | Unknown | Unknown | SD |
| MTOR | SNV | Missense_Mutation | novel | c.3142A>C | p.Ile1048Leu | p.I1048L | P42345 | protein_coding | tolerated(1) | benign(0) | TCGA-AN-A046-01 | Breast | breast invasive carcinoma | Female | >=65 | I/II | Unknown | Unknown | SD |
| MTOR | SNV | Missense_Mutation | novel | c.5276N>G | p.Leu1759Arg | p.L1759R | P42345 | protein_coding | tolerated(0.51) | probably_damaging(0.995) | TCGA-BH-A0AZ-01 | Breast | breast invasive carcinoma | Female | <65 | III/IV | Chemotherapy | doxorubicin | CR |
| MTOR | SNV | Missense_Mutation | | c.397N>G | p.Leu133Val | p.L133V | P42345 | protein_coding | deleterious(0) | possibly_damaging(0.563) | TCGA-BH-A0DZ-01 | Breast | breast invasive carcinoma | Female | <65 | I/II | Chemotherapy | docetaxel | SD |
| MTOR | SNV | Missense_Mutation | | c.4835N>C | p.Arg1612Pro | p.R1612P | P42345 | protein_coding | deleterious(0) | probably_damaging(0.992) | TCGA-BH-A0EE-01 | Breast | breast invasive carcinoma | Female | >=65 | I/II | Chemotherapy | docetaxel | SD |
| MTOR | SNV | Missense_Mutation | novel | c.3722N>G | p.Gln1241Arg | p.Q1241R | P42345 | protein_coding | tolerated(0.44) | benign(0.003) | TCGA-BH-A0HA-01 | Breast | breast invasive carcinoma | Female | <65 | I/II | Unknown | Unknown | SD |
| MTOR | SNV | Missense_Mutation | | c.7162N>C | p.Glu2388Gln | p.E2388Q | P42345 | protein_coding | deleterious(0) | probably_damaging(0.998) | TCGA-BH-A0HP-01 | Breast | breast invasive carcinoma | Female | >=65 | III/IV | Chemotherapy | doxorubicin | SD |
| Entrez ID | Symbol | Category | Interaction Types | Drug Claim Name | Drug Name | PMIDs |
| 2475 | MTOR | DRUG RESISTANCE, CLINICALLY ACTIONABLE, SERINE THREONINE KINASE, KINASE, DRUGGABLE GENOME, PHOSPHATIDYLINOSITOL 3 KINASE, ENZYME | | QUINACRINE | QUINACRINE | |
| 2475 | MTOR | DRUG RESISTANCE, CLINICALLY ACTIONABLE, SERINE THREONINE KINASE, KINASE, DRUGGABLE GENOME, PHOSPHATIDYLINOSITOL 3 KINASE, ENZYME | inhibitor | BEZ235 | DACTOLISIB | |
| 2475 | MTOR | DRUG RESISTANCE, CLINICALLY ACTIONABLE, SERINE THREONINE KINASE, KINASE, DRUGGABLE GENOME, PHOSPHATIDYLINOSITOL 3 KINASE, ENZYME | | TCMDC-125575 | CHEMBL587620 | |
| 2475 | MTOR | DRUG RESISTANCE, CLINICALLY ACTIONABLE, SERINE THREONINE KINASE, KINASE, DRUGGABLE GENOME, PHOSPHATIDYLINOSITOL 3 KINASE, ENZYME | | PERPHENAZINE | PERPHENAZINE | |
| 2475 | MTOR | DRUG RESISTANCE, CLINICALLY ACTIONABLE, SERINE THREONINE KINASE, KINASE, DRUGGABLE GENOME, PHOSPHATIDYLINOSITOL 3 KINASE, ENZYME | | PAZOPANIB | PAZOPANIB | 24625776 |
| 2475 | MTOR | DRUG RESISTANCE, CLINICALLY ACTIONABLE, SERINE THREONINE KINASE, KINASE, DRUGGABLE GENOME, PHOSPHATIDYLINOSITOL 3 KINASE, ENZYME | inhibitor | 249565693 | | |
| 2475 | MTOR | DRUG RESISTANCE, CLINICALLY ACTIONABLE, SERINE THREONINE KINASE, KINASE, DRUGGABLE GENOME, PHOSPHATIDYLINOSITOL 3 KINASE, ENZYME | | CAFFEIC ACID PHENETHYL ESTER | CAFFEIC ACID PHENETHYL ESTER | |
| 2475 | MTOR | DRUG RESISTANCE, CLINICALLY ACTIONABLE, SERINE THREONINE KINASE, KINASE, DRUGGABLE GENOME, PHOSPHATIDYLINOSITOL 3 KINASE, ENZYME | | AZD2014 | VISTUSERTIB | |
| 2475 | MTOR | DRUG RESISTANCE, CLINICALLY ACTIONABLE, SERINE THREONINE KINASE, KINASE, DRUGGABLE GENOME, PHOSPHATIDYLINOSITOL 3 KINASE, ENZYME | | GDC-0980/RG7422 | | |
| 2475 | MTOR | DRUG RESISTANCE, CLINICALLY ACTIONABLE, SERINE THREONINE KINASE, KINASE, DRUGGABLE GENOME, PHOSPHATIDYLINOSITOL 3 KINASE, ENZYME | | EVEROLIMUS | EVEROLIMUS | 24625776,25295501 |


