
|
|||||
|
 | |
| |
| |
| |
| |
| |
|
Gene: GNG12 |
Gene summary for GNG12 |
| Gene information | Species | Human | Gene symbol | GNG12 | Gene ID | 55970 |
| Gene name | G protein subunit gamma 12 | |
| Gene Alias | GNG12 | |
| Cytomap | 1p31.3 | |
| Gene Type | protein-coding | GO ID | GO:0002237 | UniProtAcc | Q9UBI6 |
Top |
Malignant transformation analysis |
| Identification of the aberrant gene expression in precancerous and cancerous lesions by comparing the gene expression of stem-like cells in diseased tissues with normal stem cells |
| Entrez ID | Symbol | Replicates | Species | Organ | Tissue | Adj P-value | Log2FC | Malignancy |
| 55970 | GNG12 | CCI_1 | Human | Cervix | CC | 7.68e-06 | 7.34e-01 | 0.528 |
| 55970 | GNG12 | CCI_2 | Human | Cervix | CC | 5.80e-11 | 1.18e+00 | 0.5249 |
| 55970 | GNG12 | CCI_3 | Human | Cervix | CC | 1.04e-05 | 6.95e-01 | 0.516 |
| 55970 | GNG12 | Tumor | Human | Cervix | CC | 1.28e-06 | 3.02e-01 | 0.1241 |
| 55970 | GNG12 | sample3 | Human | Cervix | CC | 1.74e-13 | 3.39e-01 | 0.1387 |
| 55970 | GNG12 | T3 | Human | Cervix | CC | 9.78e-10 | 3.40e-01 | 0.1389 |
| 55970 | GNG12 | HTA11_3410_2000001011 | Human | Colorectum | AD | 1.34e-03 | -2.23e-01 | 0.0155 |
| 55970 | GNG12 | HTA11_347_2000001011 | Human | Colorectum | AD | 5.64e-11 | 5.94e-01 | -0.1954 |
| 55970 | GNG12 | HTA11_99999970781_79442 | Human | Colorectum | MSS | 3.23e-02 | -1.61e-01 | 0.294 |
| 55970 | GNG12 | HTA11_99999965104_69814 | Human | Colorectum | MSS | 3.88e-03 | 4.55e-01 | 0.281 |
| 55970 | GNG12 | HTA11_99999974143_84620 | Human | Colorectum | MSS | 2.99e-05 | -3.42e-01 | 0.3005 |
| 55970 | GNG12 | A015-C-203 | Human | Colorectum | FAP | 1.30e-27 | -4.75e-01 | -0.1294 |
| 55970 | GNG12 | A015-C-204 | Human | Colorectum | FAP | 1.32e-02 | -2.89e-01 | -0.0228 |
| 55970 | GNG12 | A014-C-040 | Human | Colorectum | FAP | 1.08e-05 | -6.15e-01 | -0.1184 |
| 55970 | GNG12 | A002-C-201 | Human | Colorectum | FAP | 3.65e-10 | -3.80e-01 | 0.0324 |
| 55970 | GNG12 | A001-C-119 | Human | Colorectum | FAP | 1.71e-13 | -6.00e-01 | -0.1557 |
| 55970 | GNG12 | A001-C-108 | Human | Colorectum | FAP | 6.13e-12 | -3.27e-01 | -0.0272 |
| 55970 | GNG12 | A002-C-205 | Human | Colorectum | FAP | 1.85e-17 | -4.85e-01 | -0.1236 |
| 55970 | GNG12 | A001-C-104 | Human | Colorectum | FAP | 7.46e-07 | -3.35e-01 | 0.0184 |
| 55970 | GNG12 | A015-C-005 | Human | Colorectum | FAP | 1.45e-03 | -3.57e-01 | -0.0336 |
| Page: 1 2 3 4 5 6 7 8 9 |
| Tissue | Expression Dynamics | Abbreviation |
| Cervix | 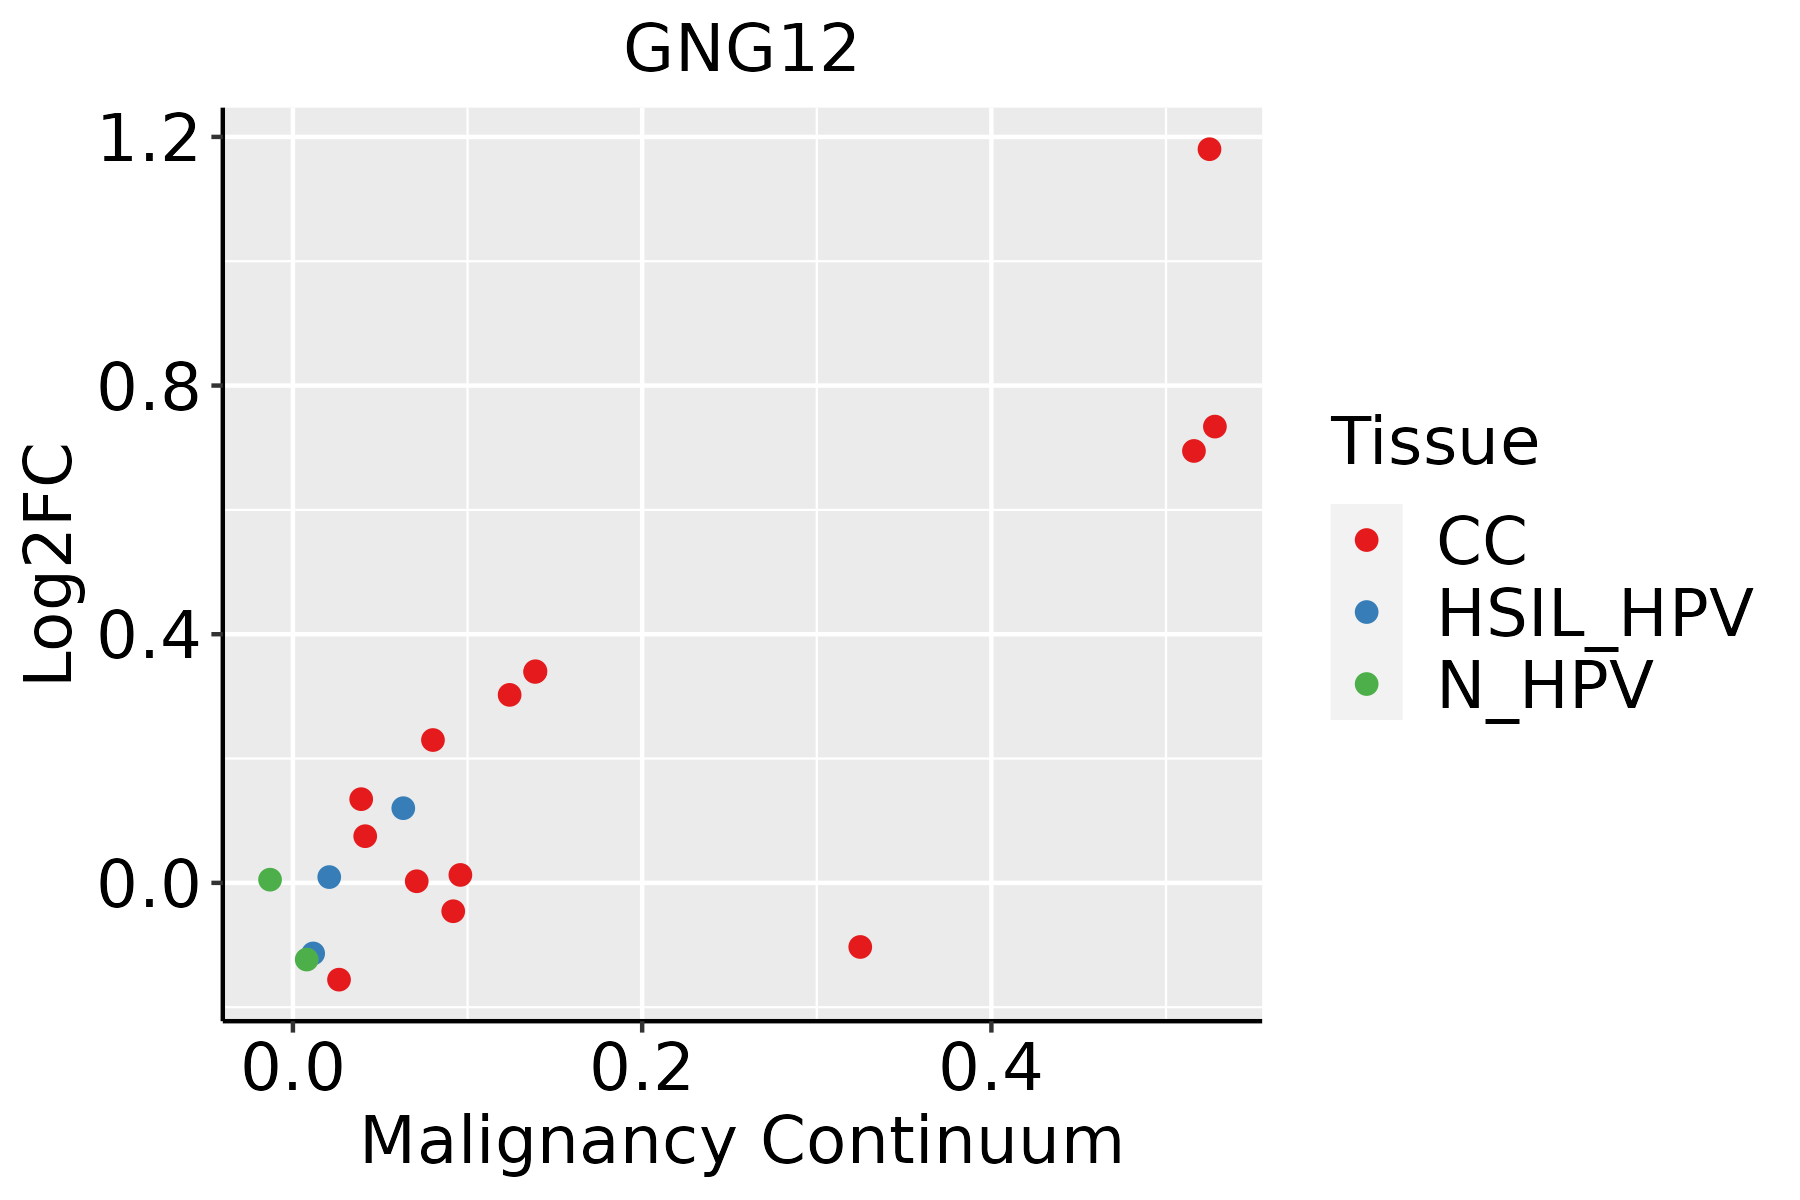 | CC: Cervix cancer |
| HSIL_HPV: HPV-infected high-grade squamous intraepithelial lesions | ||
| N_HPV: HPV-infected normal cervix | ||
| Colorectum (GSE201348) |  | FAP: Familial adenomatous polyposis |
| CRC: Colorectal cancer | ||
| Colorectum (HTA11) |  | AD: Adenomas |
| SER: Sessile serrated lesions | ||
| MSI-H: Microsatellite-high colorectal cancer | ||
| MSS: Microsatellite stable colorectal cancer | ||
| Esophagus | 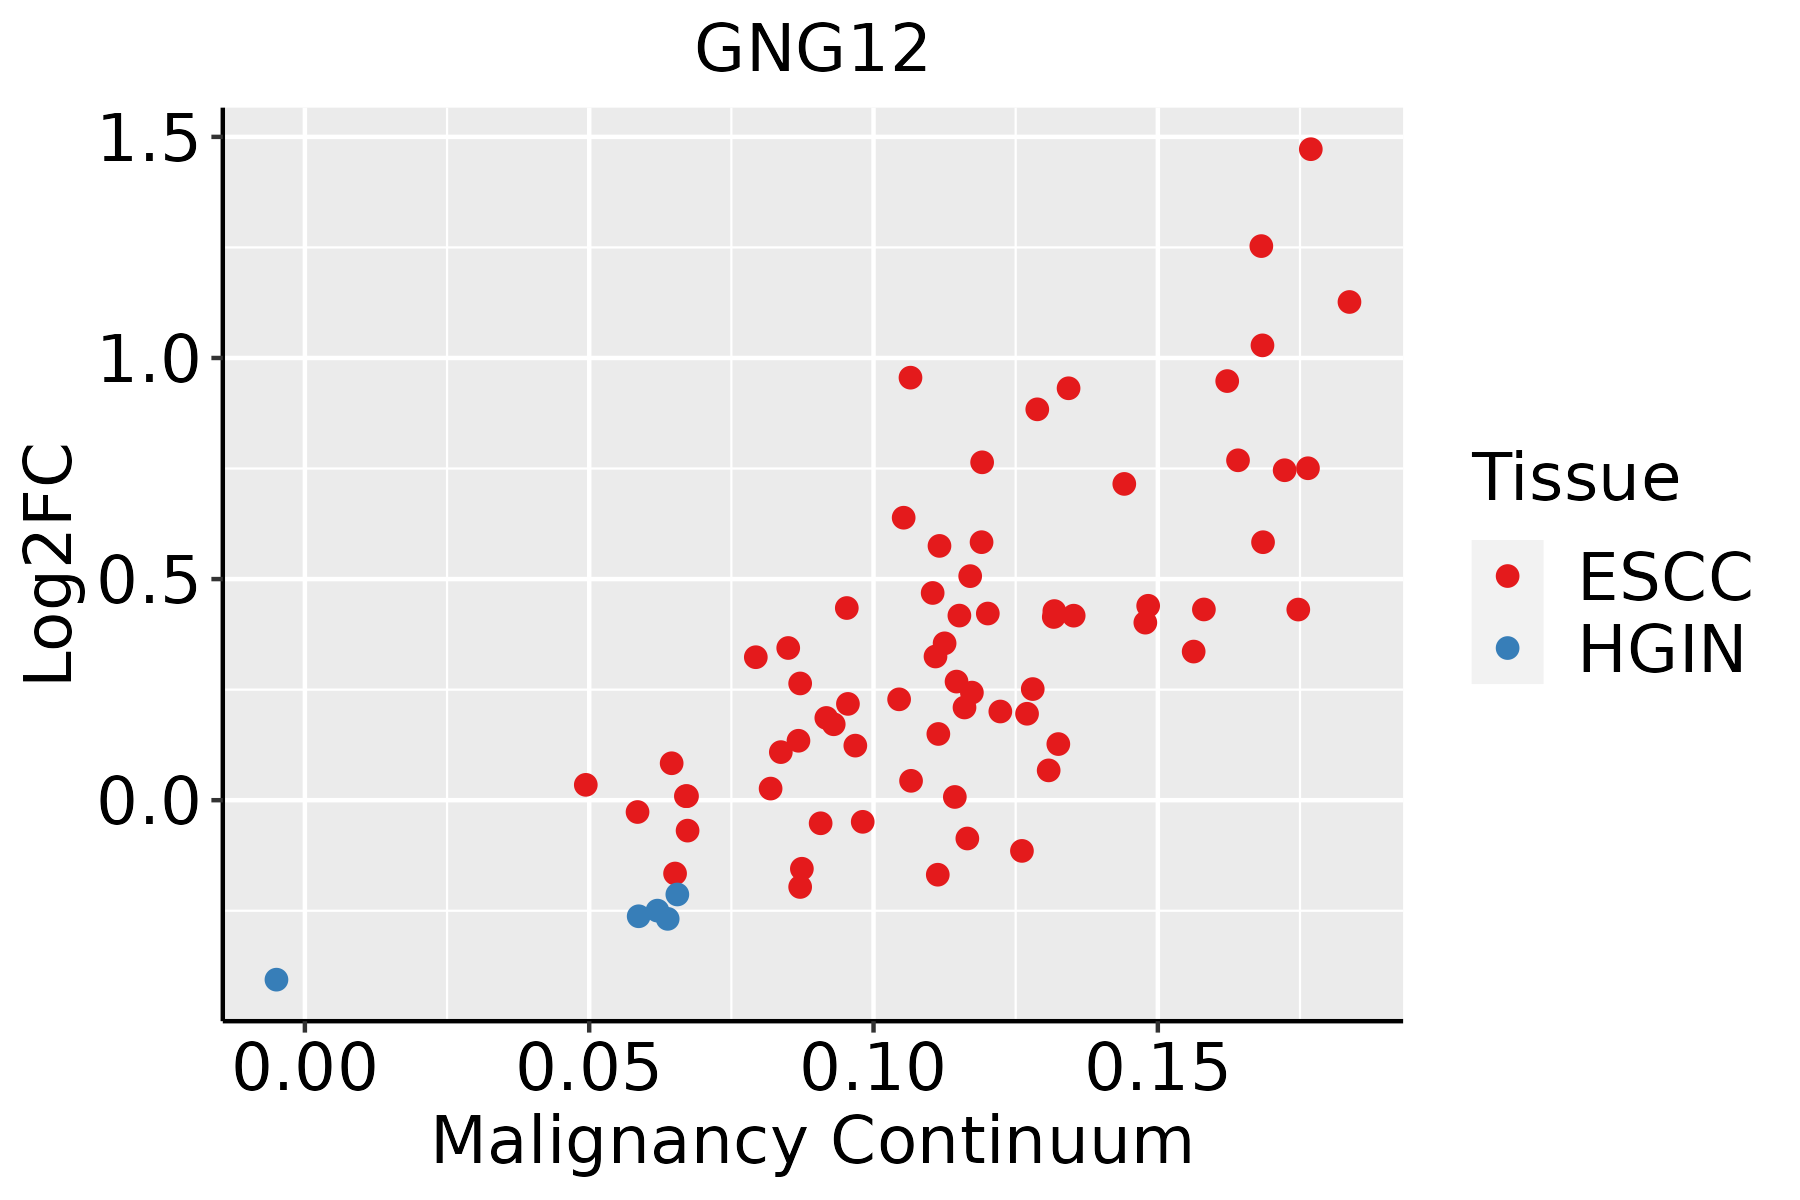 | ESCC: Esophageal squamous cell carcinoma |
| HGIN: High-grade intraepithelial neoplasias | ||
| LGIN: Low-grade intraepithelial neoplasias | ||
| Liver | 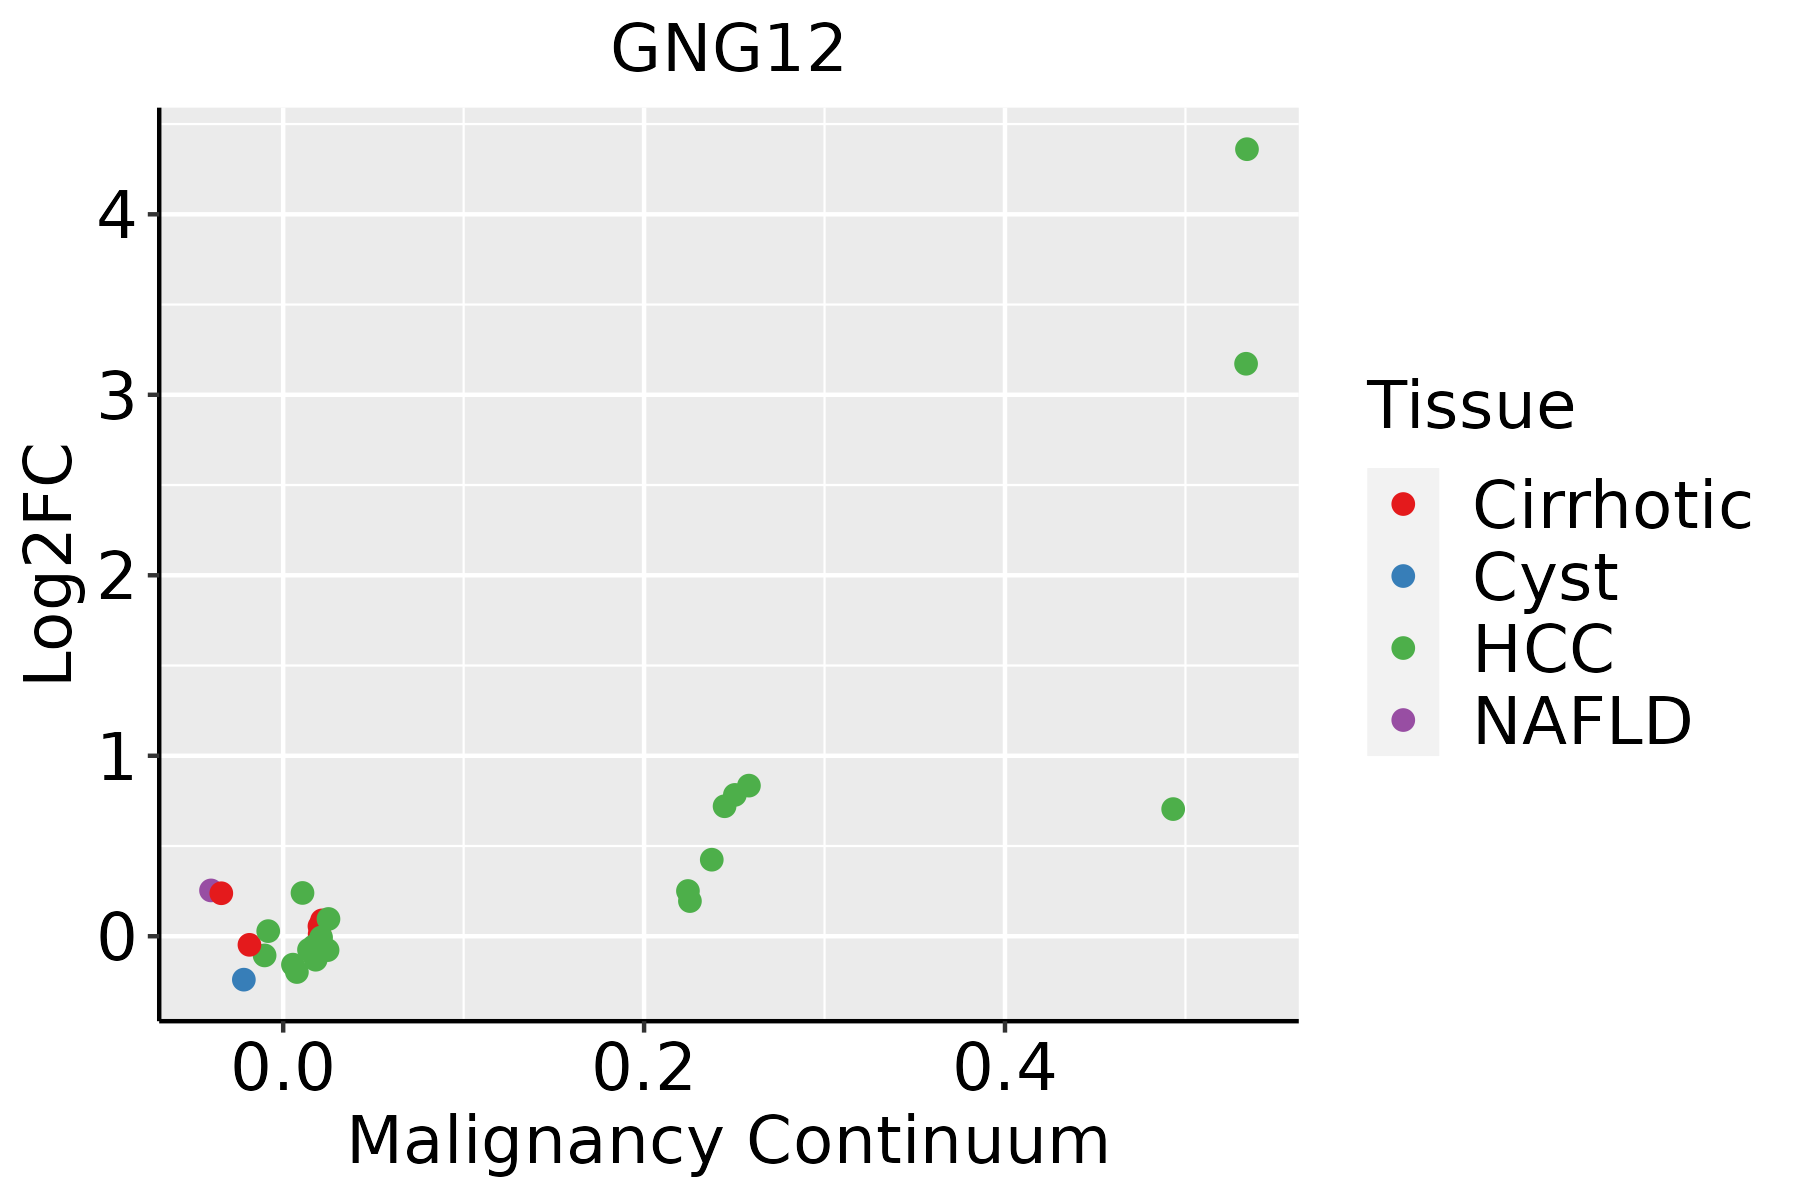 | HCC: Hepatocellular carcinoma |
| NAFLD: Non-alcoholic fatty liver disease | ||
| Oral Cavity | 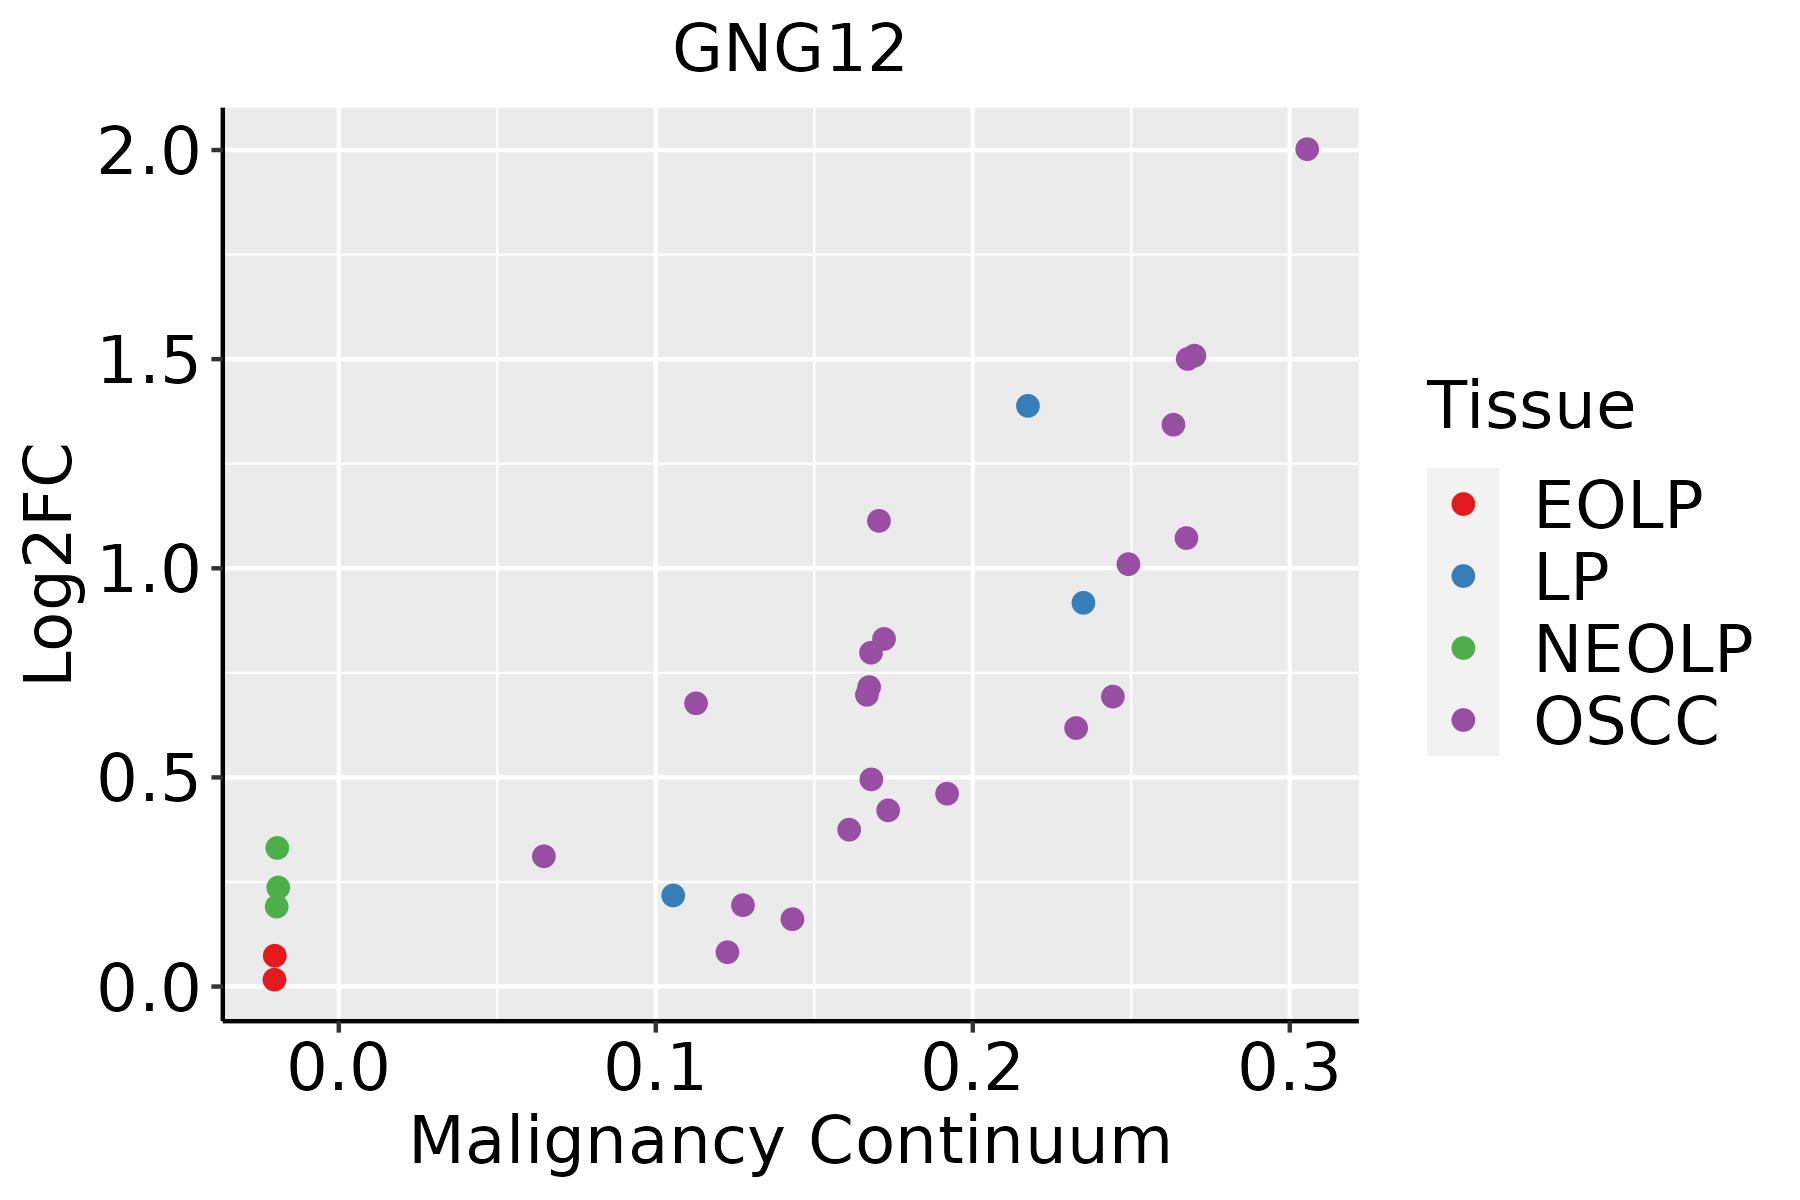 | EOLP: Erosive Oral lichen planus |
| LP: leukoplakia | ||
| NEOLP: Non-erosive oral lichen planus | ||
| OSCC: Oral squamous cell carcinoma | ||
| Prostate |  | BPH: Benign Prostatic Hyperplasia |
| Skin | 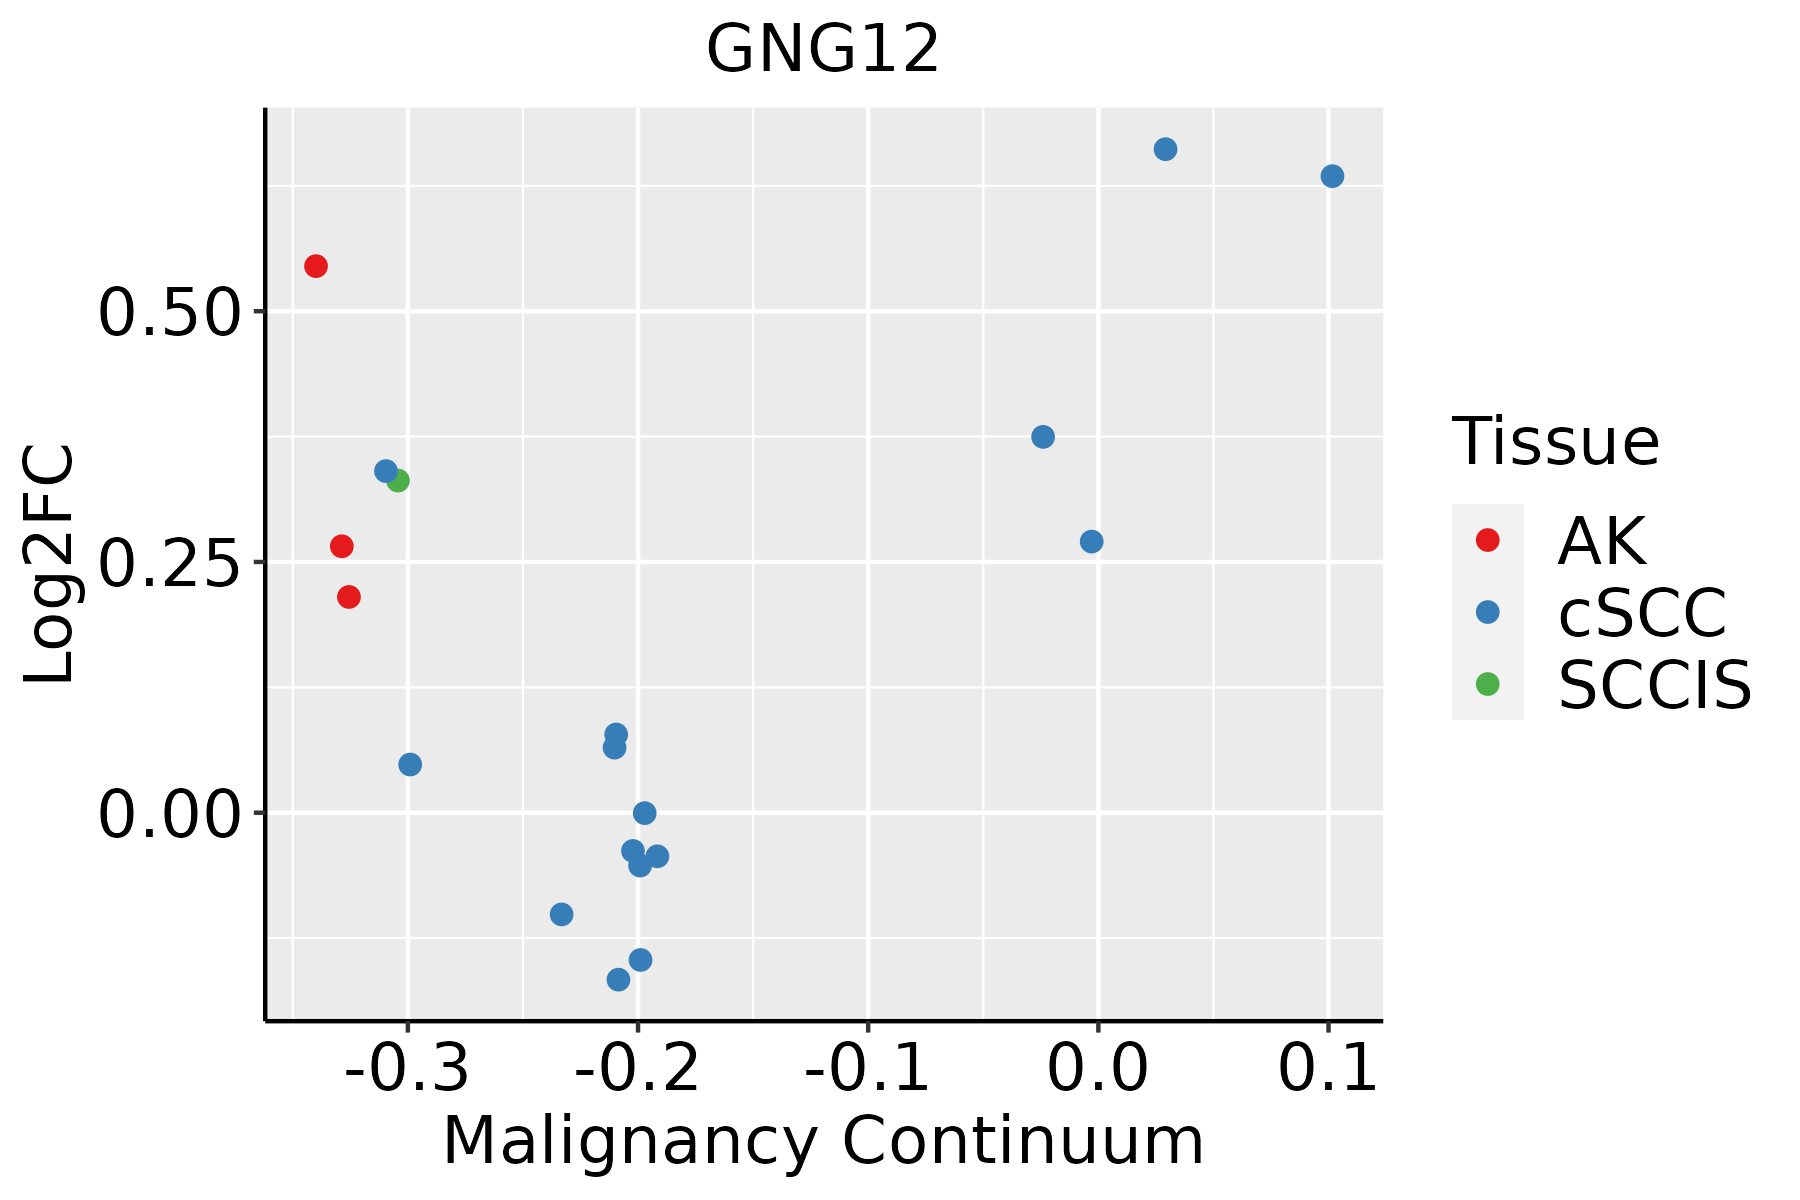 | AK: Actinic keratosis |
| cSCC: Cutaneous squamous cell carcinoma | ||
| SCCIS:squamous cell carcinoma in situ | ||
| Thyroid | 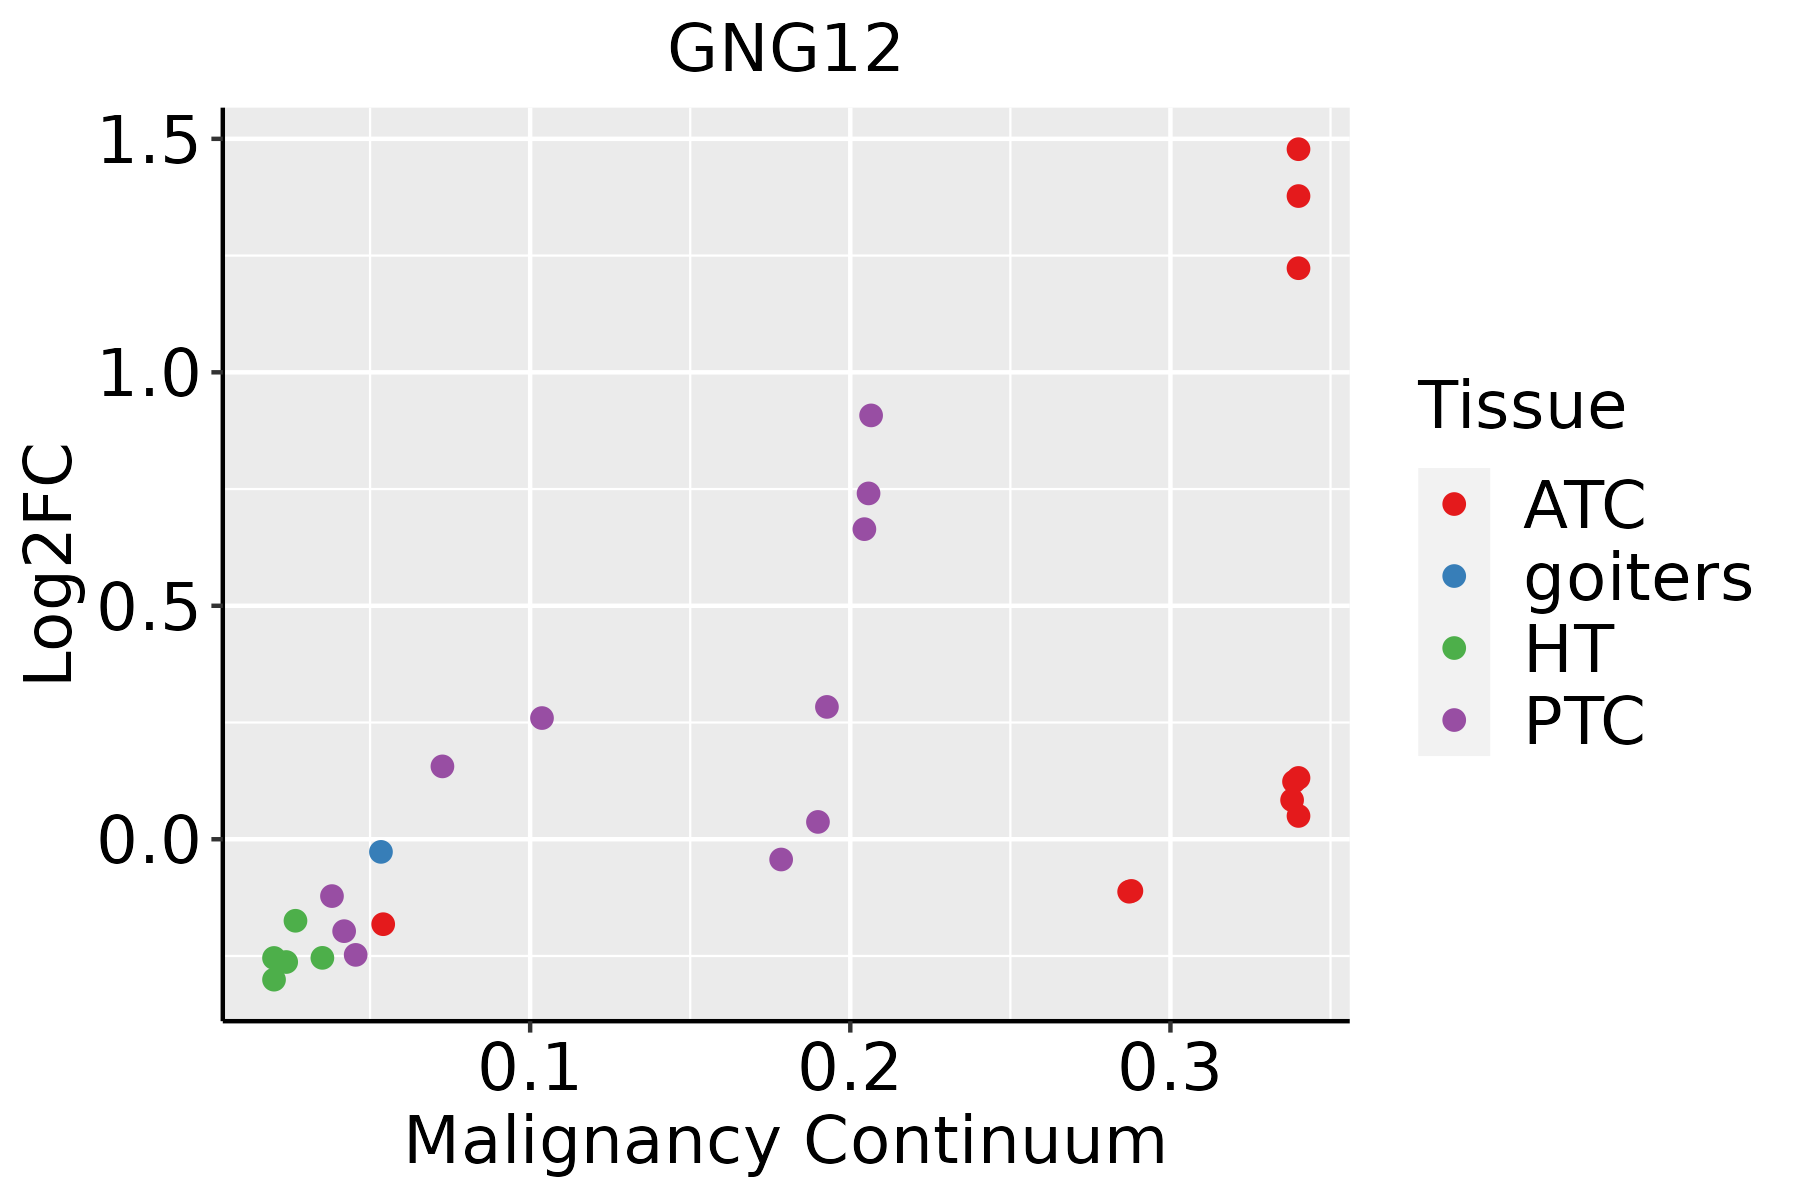 | ATC: Anaplastic thyroid cancer |
| HT: Hashimoto's thyroiditis | ||
| PTC: Papillary thyroid cancer |
| ∗log2FC in expression of this searched gene in stem-like cells from each diseased tissue sample relative to stem-like cells in normal samples in each tissue plotted against the malignancy continuum. Samples are colored based on if they are from different disease stage. |
Top |
Malignant transformation related pathway analysis |
| Find out the enriched GO biological processes and KEGG pathways involved in transition from healthy to precancer to cancer |
| Tissue | Disease Stage | Enriched GO biological Processes |
| Colorectum | AD |  |
| Colorectum | SER |  |
| Colorectum | MSS |  |
| Colorectum | MSI-H |  |
| Colorectum | FAP |  |
| ∗Top 15 enriched GO BP terms are showed in the bar plot of each disease state in each tissue. Each row represents a significant GO biological process which is colored according to the -log10(p.adjust). |
| Page: 1 2 3 4 5 6 7 8 9 |
| GO ID | Tissue | Disease Stage | Description | Gene Ratio | Bg Ratio | pvalue | p.adjust | Count |
| GO:00022379 | Cervix | CC | response to molecule of bacterial origin | 78/2311 | 363/18723 | 5.55e-07 | 2.06e-05 | 78 |
| GO:00324969 | Cervix | CC | response to lipopolysaccharide | 74/2311 | 343/18723 | 9.15e-07 | 3.25e-05 | 74 |
| GO:00219873 | Cervix | CC | cerebral cortex development | 25/2311 | 114/18723 | 2.81e-03 | 1.88e-02 | 25 |
| GO:00309003 | Cervix | CC | forebrain development | 64/2311 | 379/18723 | 5.53e-03 | 3.19e-02 | 64 |
| GO:00215433 | Cervix | CC | pallium development | 32/2311 | 169/18723 | 8.73e-03 | 4.48e-02 | 32 |
| GO:0021987 | Colorectum | FAP | cerebral cortex development | 28/2622 | 114/18723 | 1.80e-03 | 1.55e-02 | 28 |
| GO:0021543 | Colorectum | FAP | pallium development | 36/2622 | 169/18723 | 6.06e-03 | 3.81e-02 | 36 |
| GO:0030900 | Colorectum | FAP | forebrain development | 70/2622 | 379/18723 | 8.64e-03 | 4.98e-02 | 70 |
| GO:00309001 | Colorectum | CRC | forebrain development | 66/2078 | 379/18723 | 1.36e-04 | 2.57e-03 | 66 |
| GO:00219871 | Colorectum | CRC | cerebral cortex development | 24/2078 | 114/18723 | 1.45e-03 | 1.57e-02 | 24 |
| GO:00215431 | Colorectum | CRC | pallium development | 32/2078 | 169/18723 | 1.74e-03 | 1.79e-02 | 32 |
| GO:0021537 | Colorectum | CRC | telencephalon development | 43/2078 | 248/18723 | 2.01e-03 | 2.01e-02 | 43 |
| GO:003249619 | Esophagus | ESCC | response to lipopolysaccharide | 191/8552 | 343/18723 | 1.11e-04 | 7.73e-04 | 191 |
| GO:000223719 | Esophagus | ESCC | response to molecule of bacterial origin | 194/8552 | 363/18723 | 1.64e-03 | 7.61e-03 | 194 |
| GO:00215436 | Esophagus | ESCC | pallium development | 94/8552 | 169/18723 | 5.79e-03 | 2.14e-02 | 94 |
| GO:00324966 | Liver | Cirrhotic | response to lipopolysaccharide | 111/4634 | 343/18723 | 8.15e-04 | 5.95e-03 | 111 |
| GO:00022376 | Liver | Cirrhotic | response to molecule of bacterial origin | 113/4634 | 363/18723 | 3.23e-03 | 1.81e-02 | 113 |
| GO:003249611 | Liver | HCC | response to lipopolysaccharide | 174/7958 | 343/18723 | 1.19e-03 | 6.62e-03 | 174 |
| GO:000223711 | Liver | HCC | response to molecule of bacterial origin | 181/7958 | 363/18723 | 2.58e-03 | 1.24e-02 | 181 |
| GO:003249617 | Oral cavity | OSCC | response to lipopolysaccharide | 178/7305 | 343/18723 | 7.27e-07 | 1.03e-05 | 178 |
| Page: 1 2 3 |
| Pathway ID | Tissue | Disease Stage | Description | Gene Ratio | Bg Ratio | pvalue | p.adjust | qvalue | Count |
| hsa0517028 | Oral cavity | LP | Human immunodeficiency virus 1 infection | 92/2418 | 212/8465 | 2.18e-06 | 2.20e-05 | 1.42e-05 | 92 |
| hsa05167210 | Oral cavity | LP | Kaposi sarcoma-associated herpesvirus infection | 84/2418 | 194/8465 | 6.66e-06 | 5.16e-05 | 3.33e-05 | 84 |
| hsa0516329 | Oral cavity | LP | Human cytomegalovirus infection | 85/2418 | 225/8465 | 1.55e-03 | 6.89e-03 | 4.45e-03 | 85 |
| hsa0517037 | Oral cavity | LP | Human immunodeficiency virus 1 infection | 92/2418 | 212/8465 | 2.18e-06 | 2.20e-05 | 1.42e-05 | 92 |
| hsa0516737 | Oral cavity | LP | Kaposi sarcoma-associated herpesvirus infection | 84/2418 | 194/8465 | 6.66e-06 | 5.16e-05 | 3.33e-05 | 84 |
| hsa0516337 | Oral cavity | LP | Human cytomegalovirus infection | 85/2418 | 225/8465 | 1.55e-03 | 6.89e-03 | 4.45e-03 | 85 |
| hsa0481020 | Prostate | BPH | Regulation of actin cytoskeleton | 80/1718 | 229/8465 | 1.23e-07 | 1.31e-06 | 8.10e-07 | 80 |
| hsa0516727 | Prostate | BPH | Kaposi sarcoma-associated herpesvirus infection | 69/1718 | 194/8465 | 4.22e-07 | 4.10e-06 | 2.54e-06 | 69 |
| hsa0516326 | Prostate | BPH | Human cytomegalovirus infection | 74/1718 | 225/8465 | 4.87e-06 | 3.92e-05 | 2.43e-05 | 74 |
| hsa041515 | Prostate | BPH | PI3K-Akt signaling pathway | 104/1718 | 354/8465 | 2.07e-05 | 1.55e-04 | 9.61e-05 | 104 |
| hsa0472325 | Prostate | BPH | Retrograde endocannabinoid signaling | 51/1718 | 148/8465 | 3.59e-05 | 2.57e-04 | 1.59e-04 | 51 |
| hsa0401010 | Prostate | BPH | MAPK signaling pathway | 87/1718 | 302/8465 | 2.05e-04 | 1.13e-03 | 6.98e-04 | 87 |
| hsa0517020 | Prostate | BPH | Human immunodeficiency virus 1 infection | 60/1718 | 212/8465 | 2.96e-03 | 1.12e-02 | 6.92e-03 | 60 |
| hsa049266 | Prostate | BPH | Relaxin signaling pathway | 39/1718 | 129/8465 | 4.55e-03 | 1.55e-02 | 9.58e-03 | 39 |
| hsa0472810 | Prostate | BPH | Dopaminergic synapse | 38/1718 | 132/8465 | 1.19e-02 | 3.55e-02 | 2.20e-02 | 38 |
| hsa04810110 | Prostate | BPH | Regulation of actin cytoskeleton | 80/1718 | 229/8465 | 1.23e-07 | 1.31e-06 | 8.10e-07 | 80 |
| hsa05167112 | Prostate | BPH | Kaposi sarcoma-associated herpesvirus infection | 69/1718 | 194/8465 | 4.22e-07 | 4.10e-06 | 2.54e-06 | 69 |
| hsa05163111 | Prostate | BPH | Human cytomegalovirus infection | 74/1718 | 225/8465 | 4.87e-06 | 3.92e-05 | 2.43e-05 | 74 |
| hsa0415112 | Prostate | BPH | PI3K-Akt signaling pathway | 104/1718 | 354/8465 | 2.07e-05 | 1.55e-04 | 9.61e-05 | 104 |
| hsa04723111 | Prostate | BPH | Retrograde endocannabinoid signaling | 51/1718 | 148/8465 | 3.59e-05 | 2.57e-04 | 1.59e-04 | 51 |
| Page: 1 2 3 4 5 6 7 8 |
Top |
Cell-cell communication analysis |
| Identification of potential cell-cell interactions between two cell types and their ligand-receptor pairs for different disease states |
| Ligand | Receptor | LRpair | Pathway | Tissue | Disease Stage |
| Page: 1 |
Top |
Single-cell gene regulatory network inference analysis |
| Find out the significant the regulons (TFs) and the target genes of each regulon across cell types for different disease states |
| TF | Cell Type | Tissue | Disease Stage | Target Gene | RSS | Regulon Activity |
| ∗The dot plots of a searched regulon are shown for all cell subpopulations in each disease state of each tissue based on the regulon specific score inferred using pySCENIC and by calculating the average expression. |
| Page: 1 |
Top |
Somatic mutation of malignant transformation related genes |
| Annotation of somatic variants for genes involved in malignant transformation |
| Hugo Symbol | Variant Class | Variant Classification | dbSNP RS | HGVSc | HGVSp | HGVSp Short | SWISSPROT | BIOTYPE | SIFT | PolyPhen | Tumor Sample Barcode | Tissue | Histology | Sex | Age | Stage | Therapy Types | Drugs | Outcome |
| GNG12 | SNV | Missense_Mutation | novel | c.211N>G | p.Ile71Val | p.I71V | Q9UBI6 | protein_coding | tolerated(0.14) | benign(0.026) | TCGA-VS-A94Z-01 | Cervix | cervical & endocervical cancer | Female | <65 | I/II | Chemotherapy | cisplatin | CR |
| GNG12 | deletion | Frame_Shift_Del | c.202delA | p.Thr68LeufsTer22 | p.T68Lfs*22 | Q9UBI6 | protein_coding | TCGA-2W-A8YY-01 | Cervix | cervical & endocervical cancer | Female | <65 | I/II | Chemotherapy | cisplatin | CR | |||
| GNG12 | SNV | Missense_Mutation | novel | c.102G>T | p.Lys34Asn | p.K34N | Q9UBI6 | protein_coding | deleterious(0.02) | probably_damaging(0.911) | TCGA-AD-6964-01 | Colorectum | colon adenocarcinoma | Male | <65 | III/IV | Chemotherapy | folfox | PD |
| GNG12 | SNV | Missense_Mutation | rs139638442 | c.137A>G | p.His46Arg | p.H46R | Q9UBI6 | protein_coding | deleterious(0.03) | possibly_damaging(0.602) | TCGA-DM-A1HB-01 | Colorectum | colon adenocarcinoma | Male | >=65 | III/IV | Unknown | Unknown | SD |
| GNG12 | deletion | Frame_Shift_Del | c.202delA | p.Thr68LeufsTer22 | p.T68Lfs*22 | Q9UBI6 | protein_coding | TCGA-A6-2686-01 | Colorectum | colon adenocarcinoma | Female | >=65 | I/II | Unknown | Unknown | SD | |||
| GNG12 | insertion | Frame_Shift_Ins | novel | c.202dupA | p.Thr68AsnfsTer9 | p.T68Nfs*9 | Q9UBI6 | protein_coding | TCGA-A6-5665-01 | Colorectum | colon adenocarcinoma | Female | >=65 | I/II | Unknown | Unknown | PD | ||
| GNG12 | deletion | Frame_Shift_Del | c.202delA | p.Thr68LeufsTer22 | p.T68Lfs*22 | Q9UBI6 | protein_coding | TCGA-A6-6781-01 | Colorectum | colon adenocarcinoma | Male | <65 | III/IV | Chemotherapy | oxaliplatin | SD | |||
| GNG12 | deletion | Frame_Shift_Del | c.202delN | p.Thr68LeufsTer22 | p.T68Lfs*22 | Q9UBI6 | protein_coding | TCGA-AA-3663-01 | Colorectum | colon adenocarcinoma | Male | <65 | I/II | Unknown | Unknown | SD | |||
| GNG12 | deletion | Frame_Shift_Del | c.202delN | p.Thr68LeufsTer22 | p.T68Lfs*22 | Q9UBI6 | protein_coding | TCGA-AD-6889-01 | Colorectum | colon adenocarcinoma | Male | >=65 | I/II | Chemotherapy | xeloda | PD | |||
| GNG12 | deletion | Frame_Shift_Del | c.202delN | p.Thr68LeufsTer22 | p.T68Lfs*22 | Q9UBI6 | protein_coding | TCGA-AD-A5EJ-01 | Colorectum | colon adenocarcinoma | Female | >=65 | I/II | Unknown | Unknown | SD |
| Page: 1 2 3 4 |
Top |
Related drugs of malignant transformation related genes |
| Identification of chemicals and drugs interact with genes involved in malignant transfromation |
| (DGIdb 4.0) |
| Entrez ID | Symbol | Category | Interaction Types | Drug Claim Name | Drug Name | PMIDs |
| Page: 1 |

Copyright 2023-Present -The University of Texas Health Science Center at Houston |