
|
|||||
|
 | |
| |
| |
| |
| |
| |
|
Gene: ARAF |
Gene summary for ARAF |
| Gene information | Species | Human | Gene symbol | ARAF | Gene ID | 369 |
| Gene name | A-Raf proto-oncogene, serine/threonine kinase | |
| Gene Alias | A-RAF | |
| Cytomap | Xp11.3 | |
| Gene Type | protein-coding | GO ID | GO:0000165 | UniProtAcc | P10398 |
Top |
Malignant transformation analysis |
| Identification of the aberrant gene expression in precancerous and cancerous lesions by comparing the gene expression of stem-like cells in diseased tissues with normal stem cells |
| Entrez ID | Symbol | Replicates | Species | Organ | Tissue | Adj P-value | Log2FC | Malignancy |
| 369 | ARAF | LZE4T | Human | Esophagus | ESCC | 4.91e-05 | 1.73e-01 | 0.0811 |
| 369 | ARAF | LZE7T | Human | Esophagus | ESCC | 2.54e-02 | 1.88e-01 | 0.0667 |
| 369 | ARAF | LZE8T | Human | Esophagus | ESCC | 2.89e-08 | 1.65e-01 | 0.067 |
| 369 | ARAF | LZE20T | Human | Esophagus | ESCC | 3.73e-02 | 1.29e-01 | 0.0662 |
| 369 | ARAF | LZE24T | Human | Esophagus | ESCC | 1.61e-05 | 2.26e-01 | 0.0596 |
| 369 | ARAF | P1T-E | Human | Esophagus | ESCC | 7.77e-05 | 2.17e-01 | 0.0875 |
| 369 | ARAF | P2T-E | Human | Esophagus | ESCC | 5.91e-32 | 4.51e-01 | 0.1177 |
| 369 | ARAF | P4T-E | Human | Esophagus | ESCC | 8.61e-10 | 3.02e-01 | 0.1323 |
| 369 | ARAF | P5T-E | Human | Esophagus | ESCC | 1.06e-11 | 2.03e-01 | 0.1327 |
| 369 | ARAF | P8T-E | Human | Esophagus | ESCC | 3.11e-32 | 6.07e-01 | 0.0889 |
| 369 | ARAF | P9T-E | Human | Esophagus | ESCC | 1.66e-11 | 2.77e-01 | 0.1131 |
| 369 | ARAF | P10T-E | Human | Esophagus | ESCC | 1.99e-15 | 2.61e-01 | 0.116 |
| 369 | ARAF | P11T-E | Human | Esophagus | ESCC | 1.26e-18 | 5.62e-01 | 0.1426 |
| 369 | ARAF | P12T-E | Human | Esophagus | ESCC | 7.89e-23 | 2.72e-01 | 0.1122 |
| 369 | ARAF | P15T-E | Human | Esophagus | ESCC | 4.20e-15 | 2.67e-01 | 0.1149 |
| 369 | ARAF | P16T-E | Human | Esophagus | ESCC | 1.33e-20 | 3.58e-01 | 0.1153 |
| 369 | ARAF | P17T-E | Human | Esophagus | ESCC | 2.20e-06 | 3.36e-01 | 0.1278 |
| 369 | ARAF | P19T-E | Human | Esophagus | ESCC | 1.12e-06 | 5.70e-01 | 0.1662 |
| 369 | ARAF | P20T-E | Human | Esophagus | ESCC | 2.78e-19 | 4.49e-01 | 0.1124 |
| 369 | ARAF | P21T-E | Human | Esophagus | ESCC | 3.52e-20 | 2.84e-01 | 0.1617 |
| Page: 1 2 3 4 5 6 |
| Tissue | Expression Dynamics | Abbreviation |
| Esophagus | 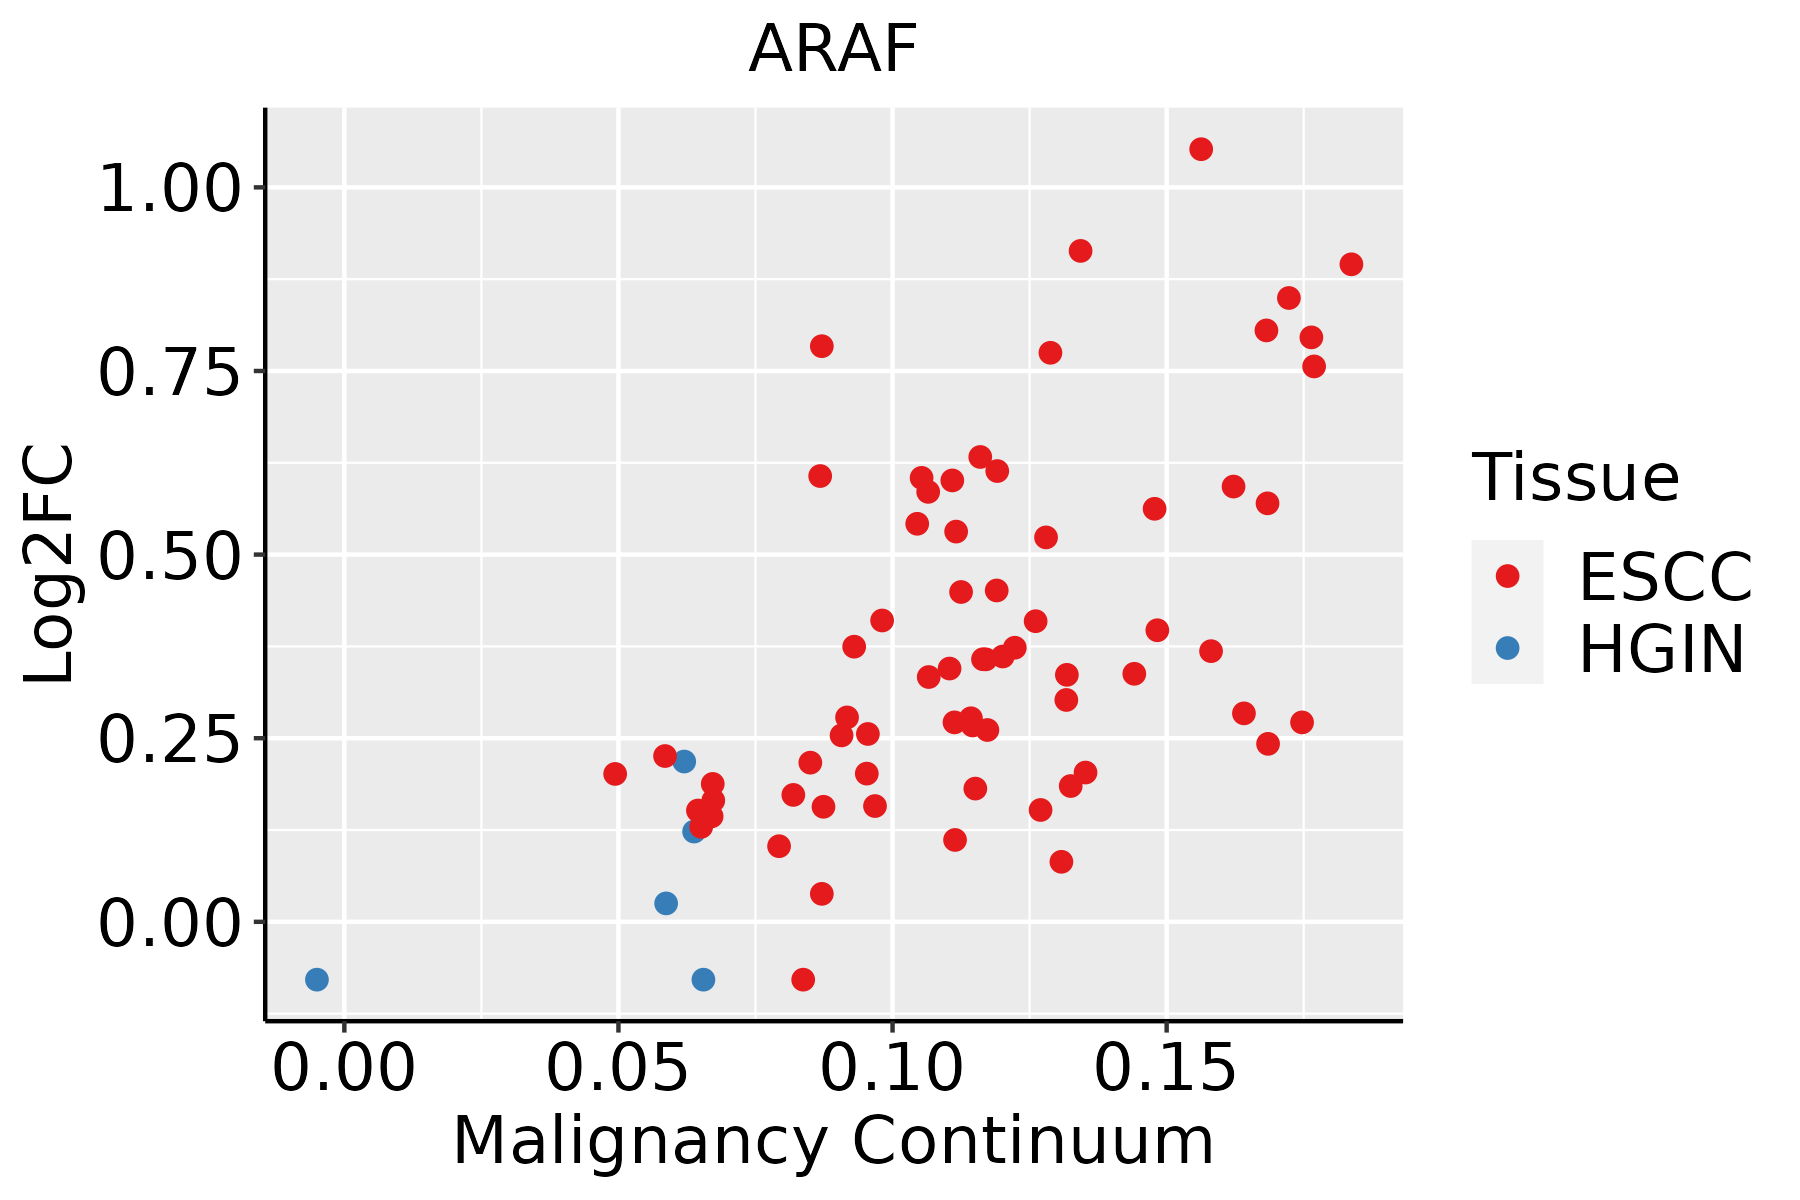 | ESCC: Esophageal squamous cell carcinoma |
| HGIN: High-grade intraepithelial neoplasias | ||
| LGIN: Low-grade intraepithelial neoplasias | ||
| Liver | 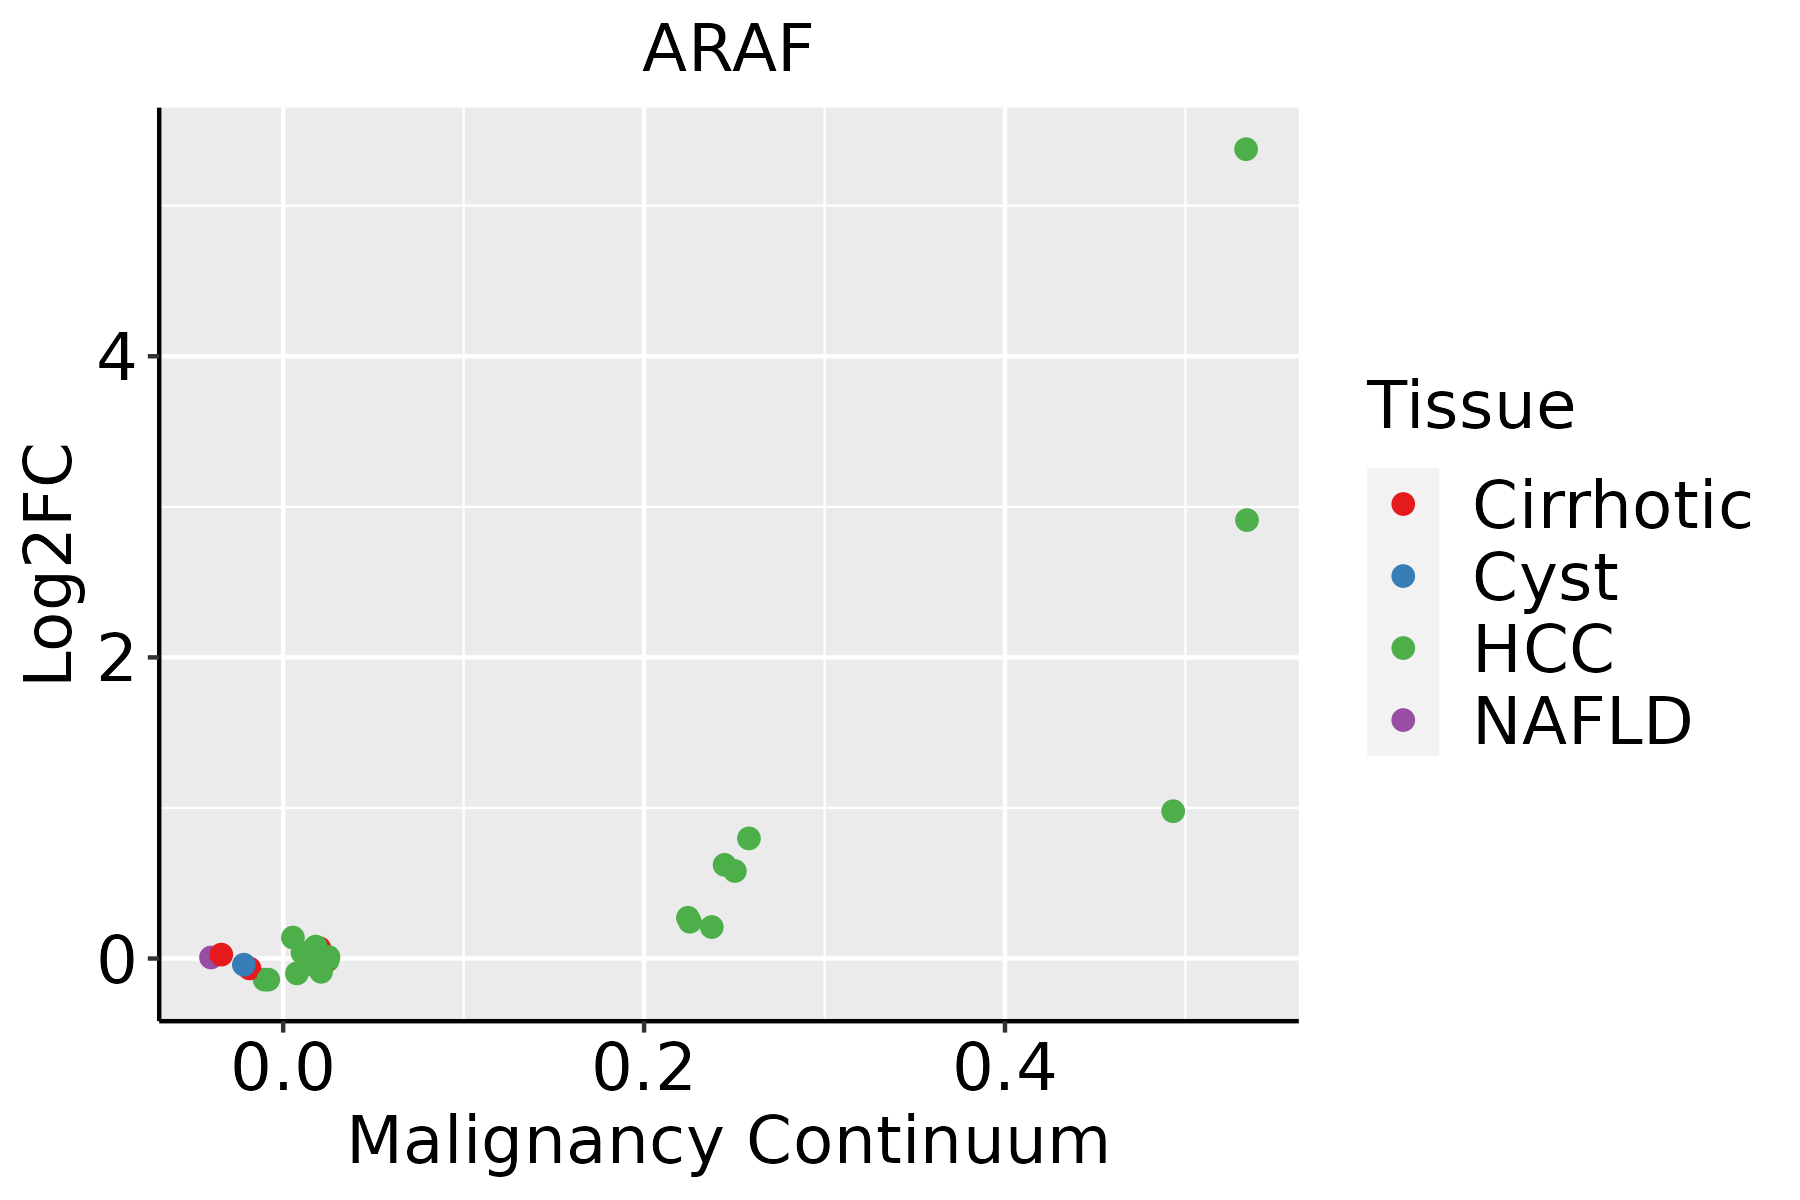 | HCC: Hepatocellular carcinoma |
| NAFLD: Non-alcoholic fatty liver disease | ||
| Oral Cavity |  | EOLP: Erosive Oral lichen planus |
| LP: leukoplakia | ||
| NEOLP: Non-erosive oral lichen planus | ||
| OSCC: Oral squamous cell carcinoma | ||
| Skin | 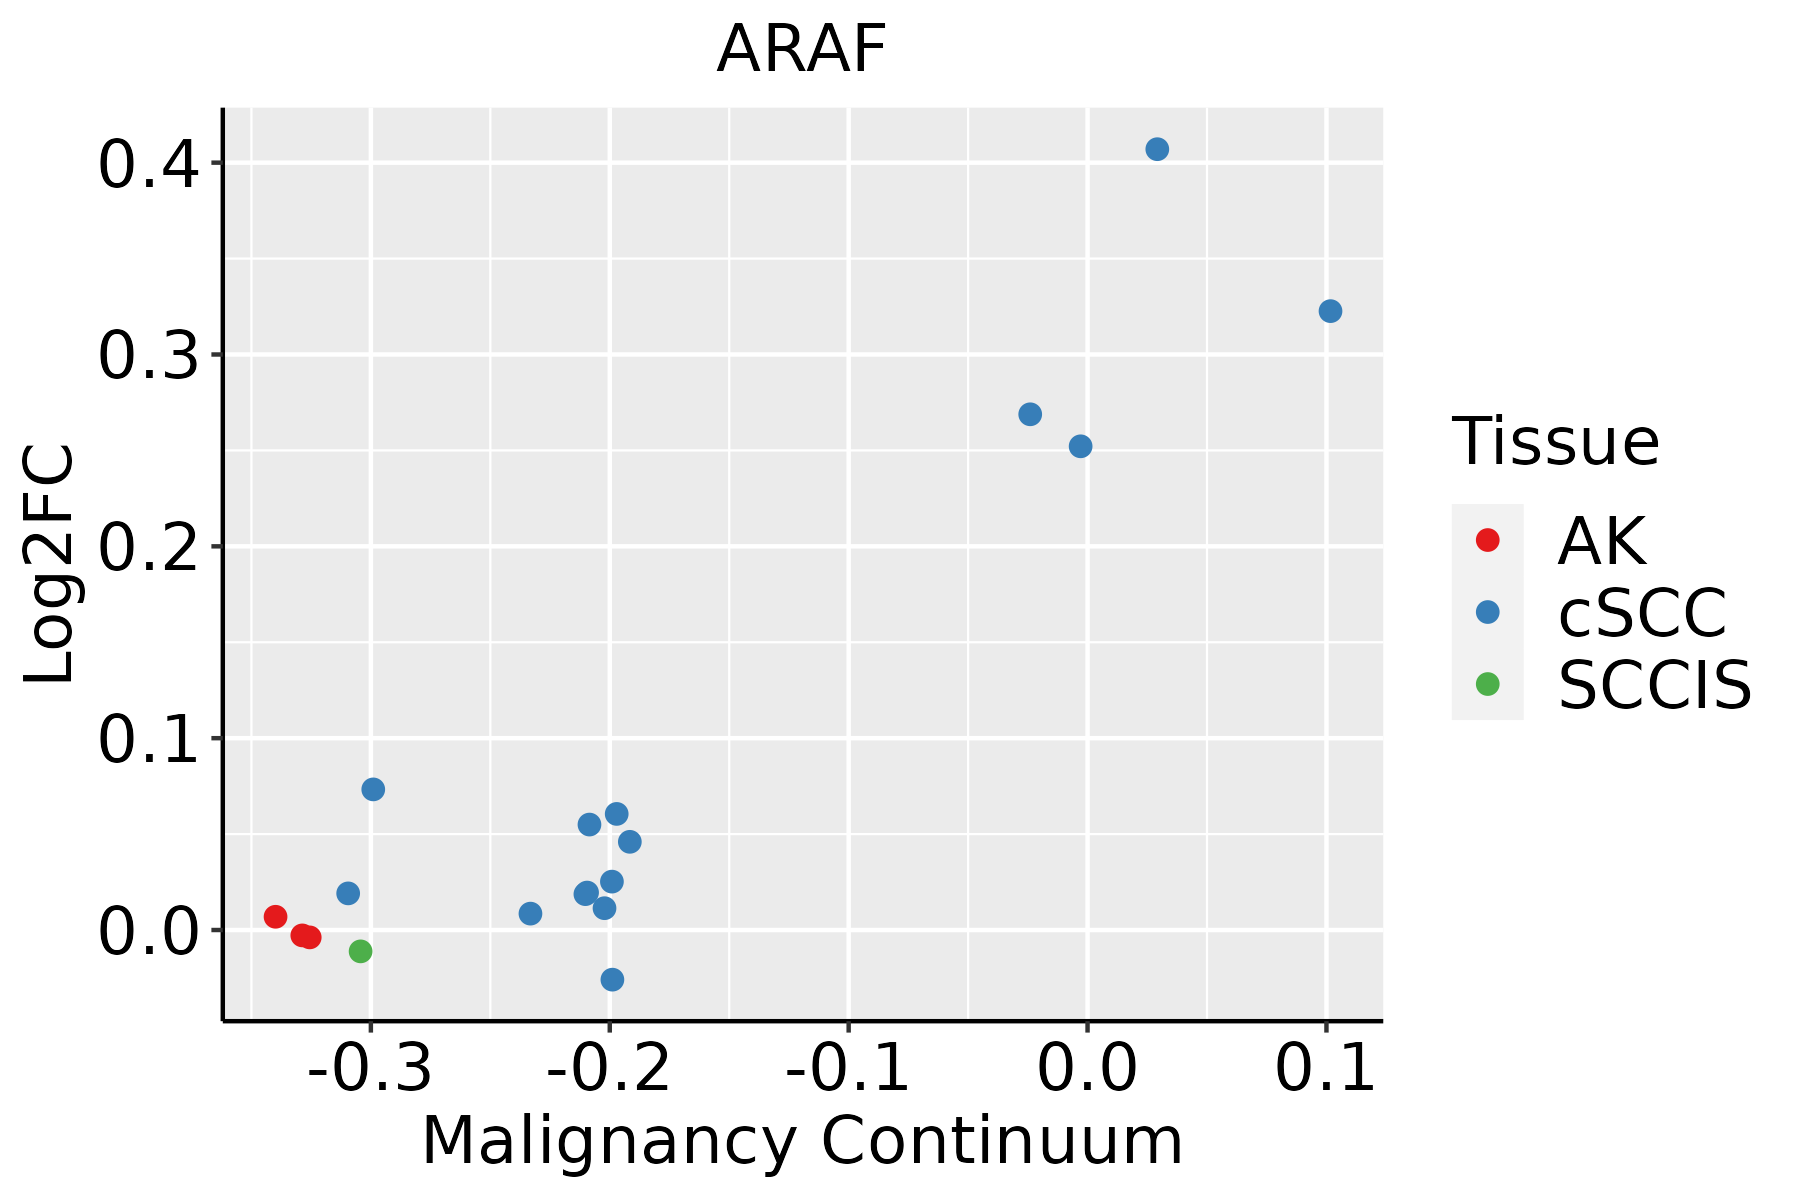 | AK: Actinic keratosis |
| cSCC: Cutaneous squamous cell carcinoma | ||
| SCCIS:squamous cell carcinoma in situ | ||
| Thyroid |  | ATC: Anaplastic thyroid cancer |
| HT: Hashimoto's thyroiditis | ||
| PTC: Papillary thyroid cancer |
| ∗log2FC in expression of this searched gene in stem-like cells from each diseased tissue sample relative to stem-like cells in normal samples in each tissue plotted against the malignancy continuum. Samples are colored based on if they are from different disease stage. |
Top |
Malignant transformation related pathway analysis |
| Find out the enriched GO biological processes and KEGG pathways involved in transition from healthy to precancer to cancer |
| Tissue | Disease Stage | Enriched GO biological Processes |
| Colorectum | AD |  |
| Colorectum | SER |  |
| Colorectum | MSS |  |
| Colorectum | MSI-H |  |
| Colorectum | FAP |  |
| ∗Top 15 enriched GO BP terms are showed in the bar plot of each disease state in each tissue. Each row represents a significant GO biological process which is colored according to the -log10(p.adjust). |
| Page: 1 2 3 4 5 6 7 8 9 |
| GO ID | Tissue | Disease Stage | Description | Gene Ratio | Bg Ratio | pvalue | p.adjust | Count |
| GO:001095913 | Breast | IDC | regulation of metal ion transport | 52/1434 | 406/18723 | 1.76e-04 | 2.97e-03 | 52 |
| GO:0051924 | Breast | IDC | regulation of calcium ion transport | 32/1434 | 255/18723 | 3.94e-03 | 3.22e-02 | 32 |
| GO:001095921 | Breast | DCIS | regulation of metal ion transport | 50/1390 | 406/18723 | 2.86e-04 | 4.22e-03 | 50 |
| GO:0010959 | Colorectum | FAP | regulation of metal ion transport | 83/2622 | 406/18723 | 2.06e-04 | 2.96e-03 | 83 |
| GO:00109597 | Endometrium | AEH | regulation of metal ion transport | 66/2100 | 406/18723 | 1.24e-03 | 1.07e-02 | 66 |
| GO:001095914 | Endometrium | EEC | regulation of metal ion transport | 70/2168 | 406/18723 | 4.12e-04 | 4.35e-03 | 70 |
| GO:0010498111 | Esophagus | ESCC | proteasomal protein catabolic process | 369/8552 | 490/18723 | 1.13e-41 | 1.80e-38 | 369 |
| GO:0043161111 | Esophagus | ESCC | proteasome-mediated ubiquitin-dependent protein catabolic process | 312/8552 | 412/18723 | 3.53e-36 | 4.48e-33 | 312 |
| GO:0042176111 | Esophagus | ESCC | regulation of protein catabolic process | 280/8552 | 391/18723 | 8.65e-26 | 2.39e-23 | 280 |
| GO:1903362111 | Esophagus | ESCC | regulation of cellular protein catabolic process | 188/8552 | 255/18723 | 5.12e-20 | 6.62e-18 | 188 |
| GO:1903050111 | Esophagus | ESCC | regulation of proteolysis involved in cellular protein catabolic process | 163/8552 | 221/18723 | 1.44e-17 | 1.27e-15 | 163 |
| GO:0061136111 | Esophagus | ESCC | regulation of proteasomal protein catabolic process | 142/8552 | 187/18723 | 2.40e-17 | 2.00e-15 | 142 |
| GO:0032434111 | Esophagus | ESCC | regulation of proteasomal ubiquitin-dependent protein catabolic process | 107/8552 | 134/18723 | 4.06e-16 | 2.93e-14 | 107 |
| GO:2000058111 | Esophagus | ESCC | regulation of ubiquitin-dependent protein catabolic process | 125/8552 | 164/18723 | 1.17e-15 | 7.76e-14 | 125 |
| GO:00182099 | Esophagus | ESCC | peptidyl-serine modification | 196/8552 | 338/18723 | 3.07e-06 | 3.47e-05 | 196 |
| GO:001810515 | Esophagus | ESCC | peptidyl-serine phosphorylation | 184/8552 | 315/18723 | 3.22e-06 | 3.61e-05 | 184 |
| GO:00319294 | Esophagus | ESCC | TOR signaling | 79/8552 | 126/18723 | 8.57e-05 | 6.21e-04 | 79 |
| GO:00320061 | Esophagus | ESCC | regulation of TOR signaling | 63/8552 | 104/18723 | 1.55e-03 | 7.29e-03 | 63 |
| GO:00331355 | Esophagus | ESCC | regulation of peptidyl-serine phosphorylation | 81/8552 | 144/18723 | 6.79e-03 | 2.48e-02 | 81 |
| GO:00331383 | Esophagus | ESCC | positive regulation of peptidyl-serine phosphorylation | 61/8552 | 108/18723 | 1.54e-02 | 4.96e-02 | 61 |
| Page: 1 2 3 4 5 6 |
| Pathway ID | Tissue | Disease Stage | Description | Gene Ratio | Bg Ratio | pvalue | p.adjust | qvalue | Count |
| hsa0516111 | Liver | HCC | Hepatitis B | 91/4020 | 162/8465 | 1.56e-02 | 3.76e-02 | 2.09e-02 | 91 |
| hsa052211 | Liver | HCC | Acute myeloid leukemia | 41/4020 | 67/8465 | 1.64e-02 | 3.90e-02 | 2.17e-02 | 41 |
| hsa0501028 | Oral cavity | OSCC | Alzheimer disease | 244/3704 | 384/8465 | 1.18e-15 | 3.60e-14 | 1.83e-14 | 244 |
| hsa0502228 | Oral cavity | OSCC | Pathways of neurodegeneration - multiple diseases | 292/3704 | 476/8465 | 1.60e-15 | 4.47e-14 | 2.28e-14 | 292 |
| hsa0520830 | Oral cavity | OSCC | Chemical carcinogenesis - reactive oxygen species | 150/3704 | 223/8465 | 6.45e-13 | 1.20e-11 | 6.11e-12 | 150 |
| hsa0521210 | Oral cavity | OSCC | Pancreatic cancer | 60/3704 | 76/8465 | 3.32e-10 | 4.45e-09 | 2.26e-09 | 60 |
| hsa0521018 | Oral cavity | OSCC | Colorectal cancer | 66/3704 | 86/8465 | 3.99e-10 | 4.95e-09 | 2.52e-09 | 66 |
| hsa051608 | Oral cavity | OSCC | Hepatitis C | 103/3704 | 157/8465 | 2.17e-08 | 1.96e-07 | 9.99e-08 | 103 |
| hsa0520526 | Oral cavity | OSCC | Proteoglycans in cancer | 128/3704 | 205/8465 | 4.00e-08 | 3.12e-07 | 1.59e-07 | 128 |
| hsa0522018 | Oral cavity | OSCC | Chronic myeloid leukemia | 56/3704 | 76/8465 | 1.04e-07 | 7.43e-07 | 3.78e-07 | 56 |
| hsa051618 | Oral cavity | OSCC | Hepatitis B | 103/3704 | 162/8465 | 2.34e-07 | 1.51e-06 | 7.69e-07 | 103 |
| hsa0521116 | Oral cavity | OSCC | Renal cell carcinoma | 51/3704 | 69/8465 | 3.30e-07 | 2.05e-06 | 1.04e-06 | 51 |
| hsa040688 | Oral cavity | OSCC | FoxO signaling pathway | 85/3704 | 131/8465 | 7.50e-07 | 4.33e-06 | 2.21e-06 | 85 |
| hsa0521510 | Oral cavity | OSCC | Prostate cancer | 66/3704 | 97/8465 | 1.05e-06 | 5.89e-06 | 3.00e-06 | 66 |
| hsa015219 | Oral cavity | OSCC | EGFR tyrosine kinase inhibitor resistance | 54/3704 | 79/8465 | 8.11e-06 | 3.72e-05 | 1.89e-05 | 54 |
| hsa015226 | Oral cavity | OSCC | Endocrine resistance | 63/3704 | 98/8465 | 3.09e-05 | 1.31e-04 | 6.67e-05 | 63 |
| hsa049108 | Oral cavity | OSCC | Insulin signaling pathway | 83/3704 | 137/8465 | 4.83e-05 | 2.00e-04 | 1.02e-04 | 83 |
| hsa0401014 | Oral cavity | OSCC | MAPK signaling pathway | 165/3704 | 302/8465 | 7.11e-05 | 2.74e-04 | 1.40e-04 | 165 |
| hsa0481026 | Oral cavity | OSCC | Regulation of actin cytoskeleton | 129/3704 | 229/8465 | 7.14e-05 | 2.74e-04 | 1.40e-04 | 129 |
| hsa0401216 | Oral cavity | OSCC | ErbB signaling pathway | 55/3704 | 85/8465 | 7.46e-05 | 2.81e-04 | 1.43e-04 | 55 |
| Page: 1 2 3 4 5 6 7 8 9 |
Top |
Cell-cell communication analysis |
| Identification of potential cell-cell interactions between two cell types and their ligand-receptor pairs for different disease states |
| Ligand | Receptor | LRpair | Pathway | Tissue | Disease Stage |
| Page: 1 |
Top |
Single-cell gene regulatory network inference analysis |
| Find out the significant the regulons (TFs) and the target genes of each regulon across cell types for different disease states |
| TF | Cell Type | Tissue | Disease Stage | Target Gene | RSS | Regulon Activity |
| ∗The dot plots of a searched regulon are shown for all cell subpopulations in each disease state of each tissue based on the regulon specific score inferred using pySCENIC and by calculating the average expression. |
| Page: 1 |
Top |
Somatic mutation of malignant transformation related genes |
| Annotation of somatic variants for genes involved in malignant transformation |
| Hugo Symbol | Variant Class | Variant Classification | dbSNP RS | HGVSc | HGVSp | HGVSp Short | SWISSPROT | BIOTYPE | SIFT | PolyPhen | Tumor Sample Barcode | Tissue | Histology | Sex | Age | Stage | Therapy Types | Drugs | Outcome |
| ARAF | SNV | Missense_Mutation | novel | c.1089N>C | p.Lys363Asn | p.K363N | protein_coding | deleterious(0) | probably_damaging(0.975) | TCGA-5L-AAT1-01 | Breast | breast invasive carcinoma | Female | <65 | III/IV | Hormone Therapy | letrozol | SD | |
| ARAF | SNV | Missense_Mutation | novel | c.766N>C | p.Thr256Pro | p.T256P | protein_coding | tolerated(0.42) | benign(0) | TCGA-A2-A0EW-01 | Breast | breast invasive carcinoma | Female | <65 | III/IV | Chemotherapy | adriamycin | PD | |
| ARAF | SNV | Missense_Mutation | novel | c.486G>T | p.Gln162His | p.Q162H | protein_coding | tolerated(0.12) | benign(0.359) | TCGA-AN-A046-01 | Breast | breast invasive carcinoma | Female | >=65 | I/II | Unknown | Unknown | SD | |
| ARAF | SNV | Missense_Mutation | c.1213G>A | p.Asp405Asn | p.D405N | protein_coding | deleterious(0.02) | possibly_damaging(0.872) | TCGA-AN-A046-01 | Breast | breast invasive carcinoma | Female | >=65 | I/II | Unknown | Unknown | SD | ||
| ARAF | SNV | Missense_Mutation | rs764281834 | c.1745N>A | p.Arg582Gln | p.R582Q | protein_coding | deleterious(0.02) | benign(0.068) | TCGA-AO-A03V-01 | Breast | breast invasive carcinoma | Female | <65 | I/II | Chemotherapy | fluorouracil | SD | |
| ARAF | SNV | Missense_Mutation | rs777037087 | c.572G>A | p.Arg191His | p.R191H | protein_coding | tolerated(0.35) | benign(0.042) | TCGA-AO-A128-01 | Breast | breast invasive carcinoma | Female | <65 | I/II | Chemotherapy | doxorubicin | SD | |
| ARAF | SNV | Missense_Mutation | rs62636600 | c.370N>T | p.Arg124Cys | p.R124C | protein_coding | deleterious(0.03) | probably_damaging(0.999) | TCGA-B6-A0RQ-01 | Breast | breast invasive carcinoma | Female | >=65 | I/II | Unknown | Unknown | SD | |
| ARAF | SNV | Missense_Mutation | novel | c.766N>C | p.Thr256Pro | p.T256P | protein_coding | tolerated(0.42) | benign(0) | TCGA-BH-A1F5-01 | Breast | breast invasive carcinoma | Female | <65 | I/II | Unknown | Unknown | SD | |
| ARAF | SNV | Missense_Mutation | c.1810N>A | p.Ala604Thr | p.A604T | protein_coding | tolerated(1) | benign(0) | TCGA-BH-A1F5-01 | Breast | breast invasive carcinoma | Female | <65 | I/II | Unknown | Unknown | SD | ||
| ARAF | SNV | Missense_Mutation | c.1496N>A | p.Gly499Glu | p.G499E | protein_coding | deleterious(0) | probably_damaging(1) | TCGA-BH-A204-01 | Breast | breast invasive carcinoma | Female | >=65 | I/II | Unknown | Unknown | SD |
| Page: 1 2 3 4 5 6 7 8 9 |
Top |
Related drugs of malignant transformation related genes |
| Identification of chemicals and drugs interact with genes involved in malignant transfromation |
| (DGIdb 4.0) |
| Entrez ID | Symbol | Category | Interaction Types | Drug Claim Name | Drug Name | PMIDs |
| 369 | ARAF | CLINICALLY ACTIONABLE, SERINE THREONINE KINASE, KINASE, DRUGGABLE GENOME, ENZYME | sorafenib | SORAFENIB | 24569458 | |
| 369 | ARAF | CLINICALLY ACTIONABLE, SERINE THREONINE KINASE, KINASE, DRUGGABLE GENOME, ENZYME | inhibitor | LGX818 | ENCORAFENIB | |
| 369 | ARAF | CLINICALLY ACTIONABLE, SERINE THREONINE KINASE, KINASE, DRUGGABLE GENOME, ENZYME | inhibitor | 310264724 | LY-3009120 | |
| 369 | ARAF | CLINICALLY ACTIONABLE, SERINE THREONINE KINASE, KINASE, DRUGGABLE GENOME, ENZYME | Sorafenib | SORAFENIB | ||
| 369 | ARAF | CLINICALLY ACTIONABLE, SERINE THREONINE KINASE, KINASE, DRUGGABLE GENOME, ENZYME | inhibitor | CHEMBL3545195 | LY-3009120 | |
| 369 | ARAF | CLINICALLY ACTIONABLE, SERINE THREONINE KINASE, KINASE, DRUGGABLE GENOME, ENZYME | Cobimetinib | COBIMETINIB | ||
| 369 | ARAF | CLINICALLY ACTIONABLE, SERINE THREONINE KINASE, KINASE, DRUGGABLE GENOME, ENZYME | inhibitor | CHEMBL3348923 | MLN-2480 | |
| 369 | ARAF | CLINICALLY ACTIONABLE, SERINE THREONINE KINASE, KINASE, DRUGGABLE GENOME, ENZYME | inhibitor | 310264739 | LIFIRAFENIB | |
| 369 | ARAF | CLINICALLY ACTIONABLE, SERINE THREONINE KINASE, KINASE, DRUGGABLE GENOME, ENZYME | inhibitor | 1096708-71-2 | ||
| 369 | ARAF | CLINICALLY ACTIONABLE, SERINE THREONINE KINASE, KINASE, DRUGGABLE GENOME, ENZYME | inhibitor | XL281 | XL-281 |
| Page: 1 2 |

Copyright 2023-Present -The University of Texas Health Science Center at Houston |