
|
|||||
|
 | |
| |
| |
| |
| |
| |
|
Gene: SLC25A4 |
Gene summary for SLC25A4 |
| Gene information | Species | Human | Gene symbol | SLC25A4 | Gene ID | 291 |
| Gene name | solute carrier family 25 member 4 | |
| Gene Alias | AAC1 | |
| Cytomap | 4q35.1 | |
| Gene Type | protein-coding | GO ID | GO:0000002 | UniProtAcc | A0A0S2Z3H3 |
Top |
Malignant transformation analysis |
| Identification of the aberrant gene expression in precancerous and cancerous lesions by comparing the gene expression of stem-like cells in diseased tissues with normal stem cells |
| Entrez ID | Symbol | Replicates | Species | Organ | Tissue | Adj P-value | Log2FC | Malignancy |
| 291 | SLC25A4 | HTA11_347_2000001011 | Human | Colorectum | AD | 3.04e-12 | 3.77e-01 | -0.1954 |
| 291 | SLC25A4 | HTA11_1391_2000001011 | Human | Colorectum | AD | 1.16e-02 | 2.12e-01 | -0.059 |
| 291 | SLC25A4 | HTA11_99999970781_79442 | Human | Colorectum | MSS | 5.27e-11 | 3.83e-01 | 0.294 |
| 291 | SLC25A4 | LZE4T | Human | Esophagus | ESCC | 1.03e-10 | 3.89e-01 | 0.0811 |
| 291 | SLC25A4 | LZE5T | Human | Esophagus | ESCC | 1.93e-06 | 2.91e-01 | 0.0514 |
| 291 | SLC25A4 | LZE7T | Human | Esophagus | ESCC | 8.49e-08 | 8.72e-01 | 0.0667 |
| 291 | SLC25A4 | LZE8T | Human | Esophagus | ESCC | 4.96e-08 | 2.37e-01 | 0.067 |
| 291 | SLC25A4 | LZE20T | Human | Esophagus | ESCC | 1.00e-02 | 3.15e-01 | 0.0662 |
| 291 | SLC25A4 | LZE22T | Human | Esophagus | ESCC | 4.55e-03 | 2.66e-01 | 0.068 |
| 291 | SLC25A4 | LZE24T | Human | Esophagus | ESCC | 2.29e-14 | 5.20e-01 | 0.0596 |
| 291 | SLC25A4 | LZE21T | Human | Esophagus | ESCC | 8.70e-05 | 2.38e-01 | 0.0655 |
| 291 | SLC25A4 | LZE6T | Human | Esophagus | ESCC | 1.94e-02 | 1.47e-01 | 0.0845 |
| 291 | SLC25A4 | P1T-E | Human | Esophagus | ESCC | 3.32e-08 | 3.30e-01 | 0.0875 |
| 291 | SLC25A4 | P2T-E | Human | Esophagus | ESCC | 8.57e-37 | 7.52e-01 | 0.1177 |
| 291 | SLC25A4 | P4T-E | Human | Esophagus | ESCC | 6.58e-34 | 9.10e-01 | 0.1323 |
| 291 | SLC25A4 | P5T-E | Human | Esophagus | ESCC | 3.58e-42 | 8.49e-01 | 0.1327 |
| 291 | SLC25A4 | P8T-E | Human | Esophagus | ESCC | 3.04e-37 | 6.67e-01 | 0.0889 |
| 291 | SLC25A4 | P9T-E | Human | Esophagus | ESCC | 6.04e-22 | 4.63e-01 | 0.1131 |
| 291 | SLC25A4 | P10T-E | Human | Esophagus | ESCC | 5.83e-40 | 7.17e-01 | 0.116 |
| 291 | SLC25A4 | P11T-E | Human | Esophagus | ESCC | 3.78e-12 | 5.03e-01 | 0.1426 |
| Page: 1 2 3 4 5 6 |
| Tissue | Expression Dynamics | Abbreviation |
| Colorectum (GSE201348) |  | FAP: Familial adenomatous polyposis |
| CRC: Colorectal cancer | ||
| Colorectum (HTA11) | 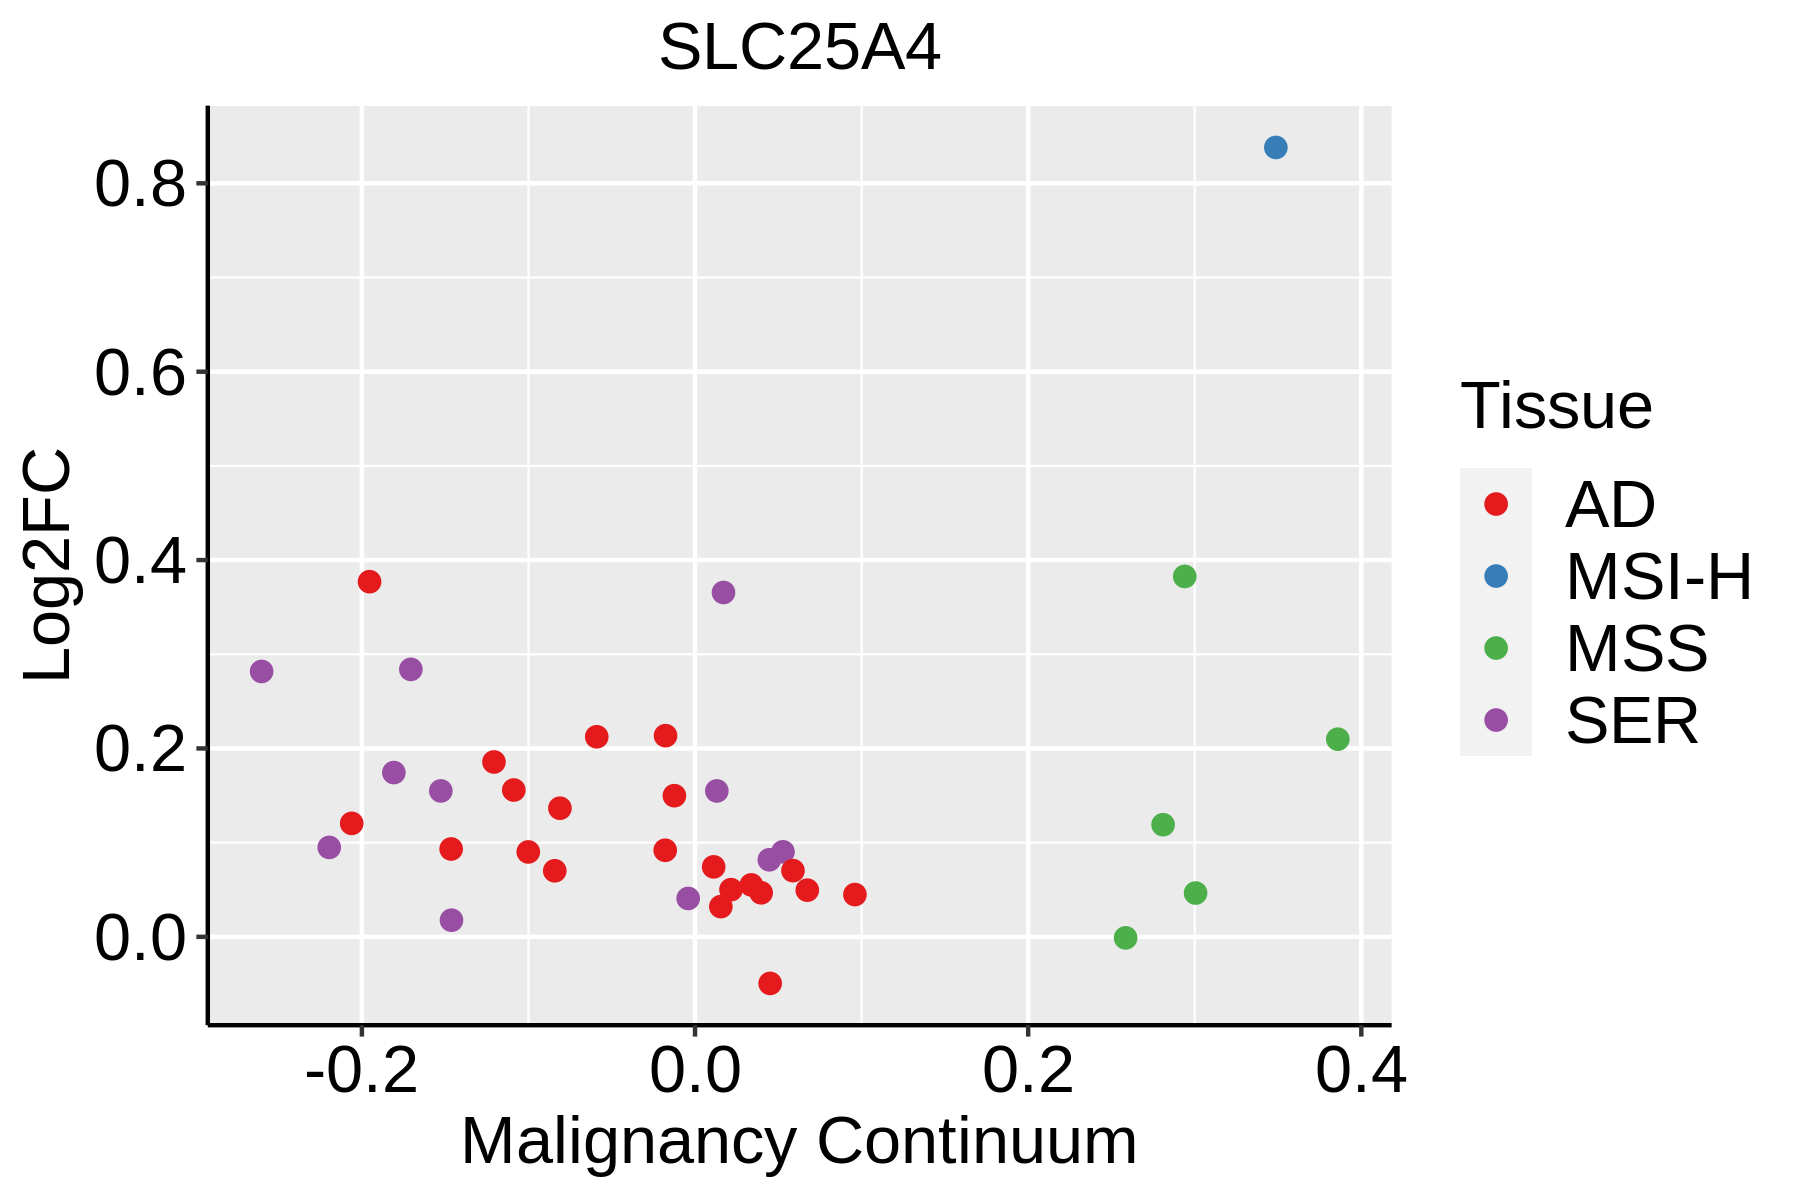 | AD: Adenomas |
| SER: Sessile serrated lesions | ||
| MSI-H: Microsatellite-high colorectal cancer | ||
| MSS: Microsatellite stable colorectal cancer | ||
| Esophagus | 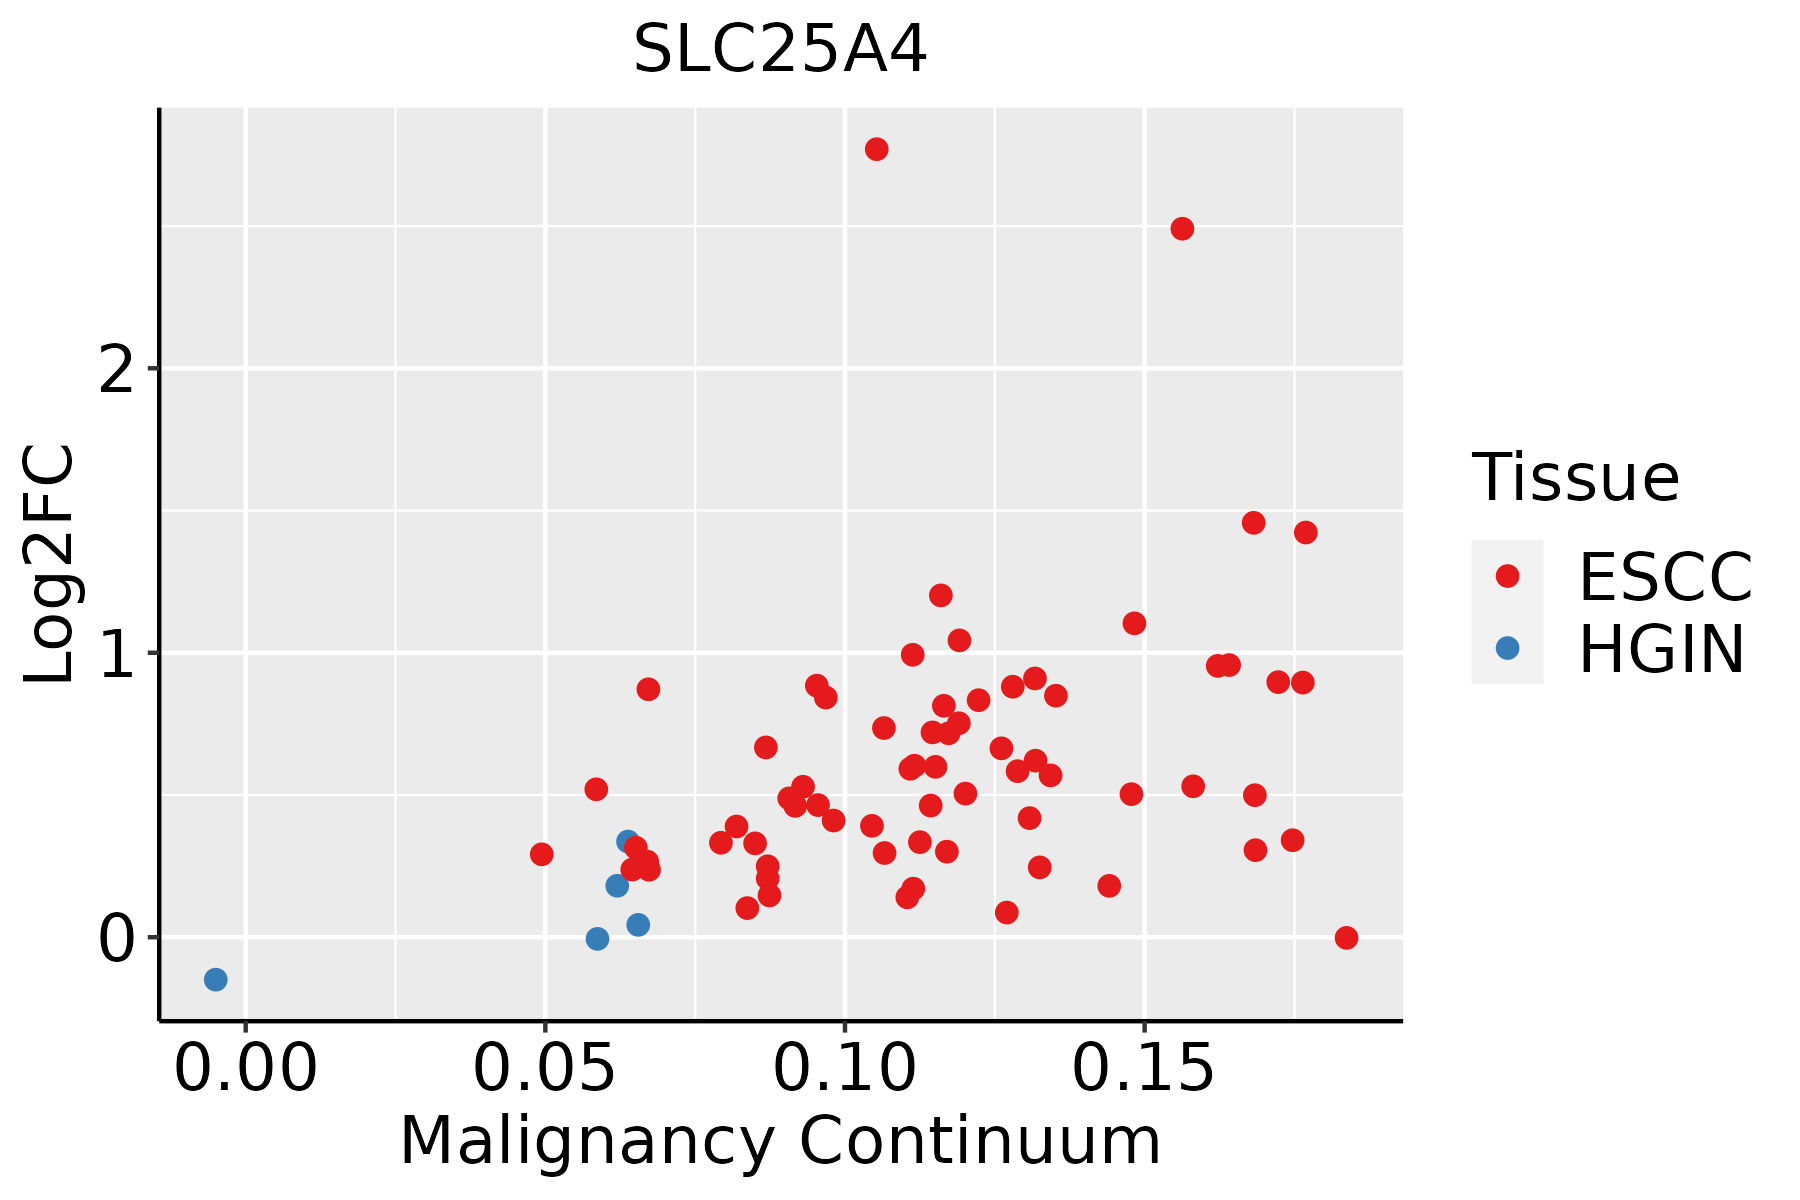 | ESCC: Esophageal squamous cell carcinoma |
| HGIN: High-grade intraepithelial neoplasias | ||
| LGIN: Low-grade intraepithelial neoplasias | ||
| Liver |  | HCC: Hepatocellular carcinoma |
| NAFLD: Non-alcoholic fatty liver disease | ||
| Oral Cavity |  | EOLP: Erosive Oral lichen planus |
| LP: leukoplakia | ||
| NEOLP: Non-erosive oral lichen planus | ||
| OSCC: Oral squamous cell carcinoma | ||
| Prostate | 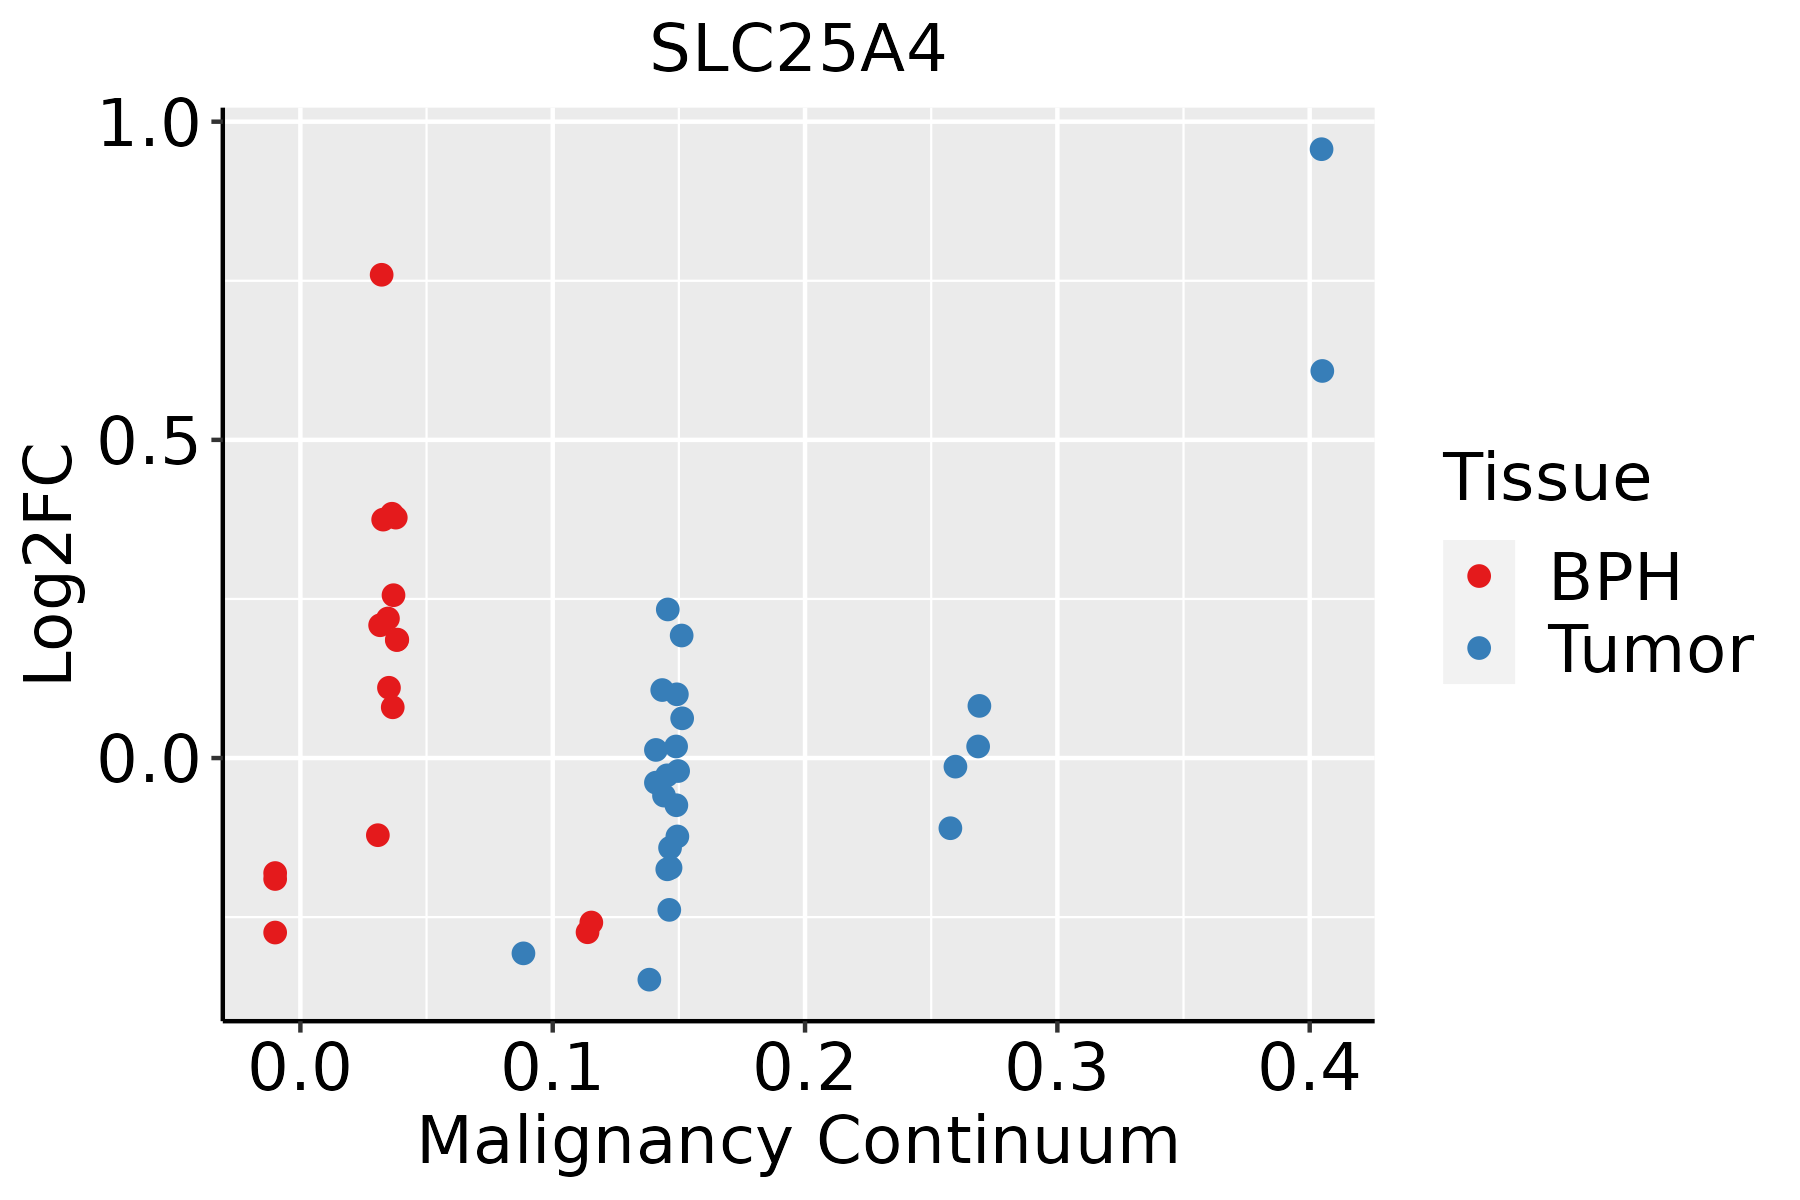 | BPH: Benign Prostatic Hyperplasia |
| Thyroid | 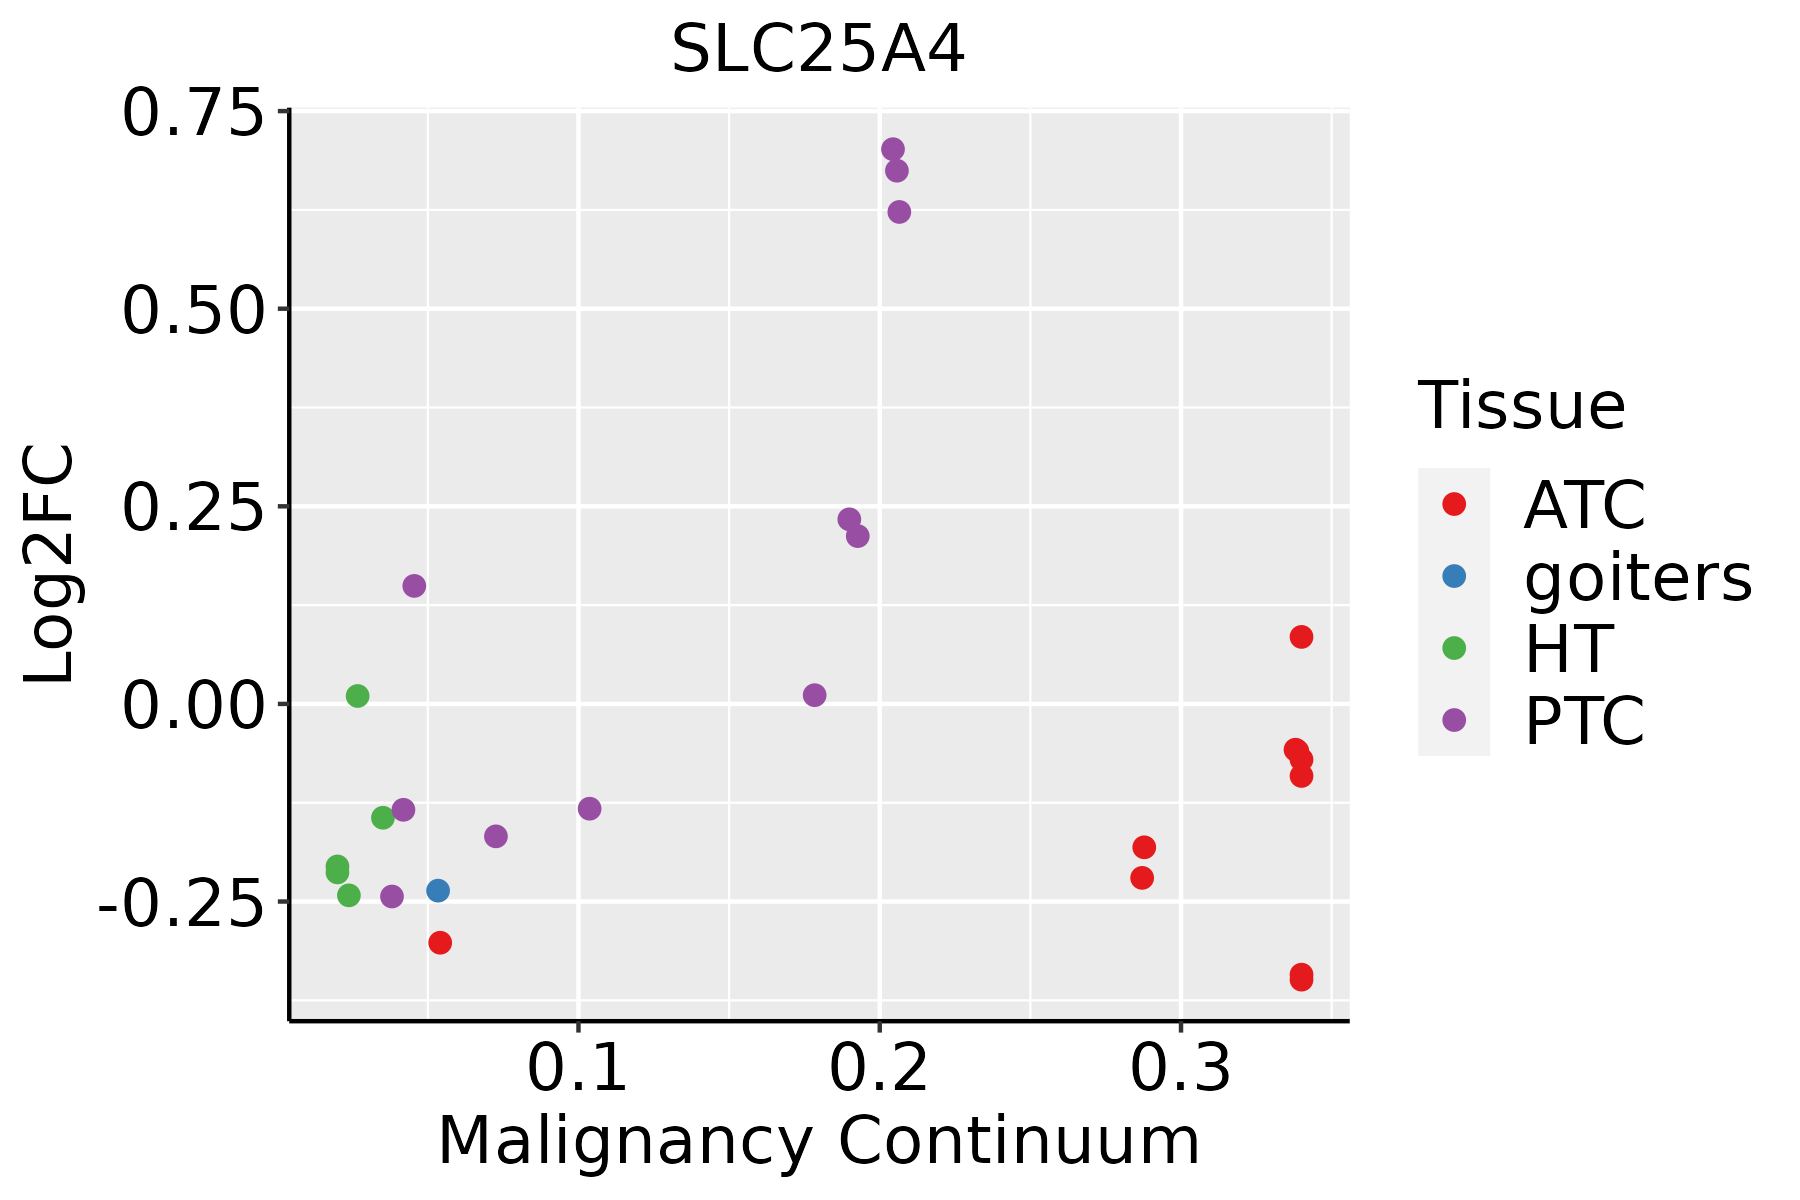 | ATC: Anaplastic thyroid cancer |
| HT: Hashimoto's thyroiditis | ||
| PTC: Papillary thyroid cancer |
| ∗log2FC in expression of this searched gene in stem-like cells from each diseased tissue sample relative to stem-like cells in normal samples in each tissue plotted against the malignancy continuum. Samples are colored based on if they are from different disease stage. |
Top |
Malignant transformation related pathway analysis |
| Find out the enriched GO biological processes and KEGG pathways involved in transition from healthy to precancer to cancer |
| Tissue | Disease Stage | Enriched GO biological Processes |
| Colorectum | AD |  |
| Colorectum | SER |  |
| Colorectum | MSS |  |
| Colorectum | MSI-H |  |
| Colorectum | FAP |  |
| ∗Top 15 enriched GO BP terms are showed in the bar plot of each disease state in each tissue. Each row represents a significant GO biological process which is colored according to the -log10(p.adjust). |
| Page: 1 2 3 4 5 6 7 8 9 |
| GO ID | Tissue | Disease Stage | Description | Gene Ratio | Bg Ratio | pvalue | p.adjust | Count |
| GO:0006091 | Colorectum | AD | generation of precursor metabolites and energy | 209/3918 | 490/18723 | 3.17e-28 | 6.61e-25 | 209 |
| GO:0009896 | Colorectum | AD | positive regulation of catabolic process | 180/3918 | 492/18723 | 4.33e-16 | 1.94e-13 | 180 |
| GO:0031331 | Colorectum | AD | positive regulation of cellular catabolic process | 156/3918 | 427/18723 | 4.68e-14 | 1.05e-11 | 156 |
| GO:0006839 | Colorectum | AD | mitochondrial transport | 102/3918 | 254/18723 | 1.87e-12 | 3.08e-10 | 102 |
| GO:0022411 | Colorectum | AD | cellular component disassembly | 147/3918 | 443/18723 | 8.53e-10 | 6.76e-08 | 147 |
| GO:1902600 | Colorectum | AD | proton transmembrane transport | 66/3918 | 157/18723 | 1.59e-09 | 1.17e-07 | 66 |
| GO:0010506 | Colorectum | AD | regulation of autophagy | 111/3918 | 317/18723 | 3.57e-09 | 2.35e-07 | 111 |
| GO:0016236 | Colorectum | AD | macroautophagy | 103/3918 | 291/18723 | 6.76e-09 | 4.15e-07 | 103 |
| GO:1990542 | Colorectum | AD | mitochondrial transmembrane transport | 47/3918 | 102/18723 | 1.09e-08 | 6.52e-07 | 47 |
| GO:0010821 | Colorectum | AD | regulation of mitochondrion organization | 57/3918 | 144/18723 | 2.43e-07 | 9.92e-06 | 57 |
| GO:0007006 | Colorectum | AD | mitochondrial membrane organization | 48/3918 | 116/18723 | 4.53e-07 | 1.72e-05 | 48 |
| GO:1903008 | Colorectum | AD | organelle disassembly | 46/3918 | 114/18723 | 1.81e-06 | 5.48e-05 | 46 |
| GO:1903146 | Colorectum | AD | regulation of autophagy of mitochondrion | 19/3918 | 33/18723 | 4.52e-06 | 1.21e-04 | 19 |
| GO:0000422 | Colorectum | AD | autophagy of mitochondrion | 35/3918 | 81/18723 | 4.94e-06 | 1.29e-04 | 35 |
| GO:0061726 | Colorectum | AD | mitochondrion disassembly | 35/3918 | 81/18723 | 4.94e-06 | 1.29e-04 | 35 |
| GO:0008637 | Colorectum | AD | apoptotic mitochondrial changes | 42/3918 | 107/18723 | 1.13e-05 | 2.56e-04 | 42 |
| GO:0010822 | Colorectum | AD | positive regulation of mitochondrion organization | 32/3918 | 74/18723 | 1.22e-05 | 2.68e-04 | 32 |
| GO:0015931 | Colorectum | AD | nucleobase-containing compound transport | 73/3918 | 222/18723 | 2.02e-05 | 4.10e-04 | 73 |
| GO:0061912 | Colorectum | AD | selective autophagy | 29/3918 | 68/18723 | 4.20e-05 | 7.39e-04 | 29 |
| GO:0016241 | Colorectum | AD | regulation of macroautophagy | 50/3918 | 141/18723 | 4.55e-05 | 7.92e-04 | 50 |
| Page: 1 2 3 4 5 6 7 8 9 10 11 12 13 14 15 16 17 |
| Pathway ID | Tissue | Disease Stage | Description | Gene Ratio | Bg Ratio | pvalue | p.adjust | qvalue | Count |
| hsa0502032 | Liver | HCC | Prion disease | 195/4020 | 273/8465 | 3.26e-16 | 1.56e-14 | 8.67e-15 | 195 |
| hsa0541532 | Liver | HCC | Diabetic cardiomyopathy | 151/4020 | 203/8465 | 2.72e-15 | 1.01e-13 | 5.63e-14 | 151 |
| hsa0501032 | Liver | HCC | Alzheimer disease | 254/4020 | 384/8465 | 3.75e-14 | 8.97e-13 | 4.99e-13 | 254 |
| hsa0502232 | Liver | HCC | Pathways of neurodegeneration - multiple diseases | 298/4020 | 476/8465 | 6.59e-12 | 1.30e-10 | 7.22e-11 | 298 |
| hsa0516632 | Liver | HCC | Human T-cell leukemia virus 1 infection | 139/4020 | 222/8465 | 3.17e-06 | 2.79e-05 | 1.55e-05 | 139 |
| hsa0421832 | Liver | HCC | Cellular senescence | 102/4020 | 156/8465 | 4.18e-06 | 3.59e-05 | 2.00e-05 | 102 |
| hsa0501731 | Liver | HCC | Spinocerebellar ataxia | 92/4020 | 143/8465 | 3.20e-05 | 1.88e-04 | 1.04e-04 | 92 |
| hsa0516431 | Liver | HCC | Influenza A | 101/4020 | 171/8465 | 1.41e-03 | 5.07e-03 | 2.82e-03 | 101 |
| hsa0501230 | Oral cavity | OSCC | Parkinson disease | 188/3704 | 266/8465 | 1.82e-19 | 1.52e-17 | 7.75e-18 | 188 |
| hsa0501628 | Oral cavity | OSCC | Huntington disease | 204/3704 | 306/8465 | 1.70e-16 | 7.13e-15 | 3.63e-15 | 204 |
| hsa0501028 | Oral cavity | OSCC | Alzheimer disease | 244/3704 | 384/8465 | 1.18e-15 | 3.60e-14 | 1.83e-14 | 244 |
| hsa0502228 | Oral cavity | OSCC | Pathways of neurodegeneration - multiple diseases | 292/3704 | 476/8465 | 1.60e-15 | 4.47e-14 | 2.28e-14 | 292 |
| hsa0502028 | Oral cavity | OSCC | Prion disease | 181/3704 | 273/8465 | 2.05e-14 | 5.30e-13 | 2.70e-13 | 181 |
| hsa0516630 | Oral cavity | OSCC | Human T-cell leukemia virus 1 infection | 150/3704 | 222/8465 | 3.68e-13 | 7.26e-12 | 3.70e-12 | 150 |
| hsa0520830 | Oral cavity | OSCC | Chemical carcinogenesis - reactive oxygen species | 150/3704 | 223/8465 | 6.45e-13 | 1.20e-11 | 6.11e-12 | 150 |
| hsa0421820 | Oral cavity | OSCC | Cellular senescence | 112/3704 | 156/8465 | 8.04e-13 | 1.42e-11 | 7.21e-12 | 112 |
| hsa0516418 | Oral cavity | OSCC | Influenza A | 116/3704 | 171/8465 | 1.23e-10 | 1.78e-09 | 9.08e-10 | 116 |
| hsa0541529 | Oral cavity | OSCC | Diabetic cardiomyopathy | 131/3704 | 203/8465 | 1.33e-09 | 1.49e-08 | 7.57e-09 | 131 |
| hsa0501725 | Oral cavity | OSCC | Spinocerebellar ataxia | 86/3704 | 143/8465 | 5.21e-05 | 2.08e-04 | 1.06e-04 | 86 |
| hsa05012113 | Oral cavity | OSCC | Parkinson disease | 188/3704 | 266/8465 | 1.82e-19 | 1.52e-17 | 7.75e-18 | 188 |
| Page: 1 2 3 4 5 6 7 8 9 10 11 |
Top |
Cell-cell communication analysis |
| Identification of potential cell-cell interactions between two cell types and their ligand-receptor pairs for different disease states |
| Ligand | Receptor | LRpair | Pathway | Tissue | Disease Stage |
| Page: 1 |
Top |
Single-cell gene regulatory network inference analysis |
| Find out the significant the regulons (TFs) and the target genes of each regulon across cell types for different disease states |
| TF | Cell Type | Tissue | Disease Stage | Target Gene | RSS | Regulon Activity |
| ∗The dot plots of a searched regulon are shown for all cell subpopulations in each disease state of each tissue based on the regulon specific score inferred using pySCENIC and by calculating the average expression. |
| Page: 1 |
Top |
Somatic mutation of malignant transformation related genes |
| Annotation of somatic variants for genes involved in malignant transformation |
| Hugo Symbol | Variant Class | Variant Classification | dbSNP RS | HGVSc | HGVSp | HGVSp Short | SWISSPROT | BIOTYPE | SIFT | PolyPhen | Tumor Sample Barcode | Tissue | Histology | Sex | Age | Stage | Therapy Types | Drugs | Outcome |
| SLC25A4 | SNV | Missense_Mutation | novel | c.367N>A | p.Ala123Thr | p.A123T | P12235 | protein_coding | tolerated(0.06) | possibly_damaging(0.801) | TCGA-A2-A4S1-01 | Breast | breast invasive carcinoma | Female | >=65 | I/II | Unknown | Unknown | SD |
| SLC25A4 | SNV | Missense_Mutation | c.238N>T | p.Arg80Cys | p.R80C | P12235 | protein_coding | deleterious(0.01) | possibly_damaging(0.645) | TCGA-A8-A08R-01 | Breast | breast invasive carcinoma | Female | <65 | I/II | Unknown | Unknown | SD | |
| SLC25A4 | SNV | Missense_Mutation | c.166N>C | p.Asp56His | p.D56H | P12235 | protein_coding | deleterious(0.01) | probably_damaging(0.996) | TCGA-AC-A23H-01 | Breast | breast invasive carcinoma | Female | >=65 | I/II | Unknown | Unknown | PD | |
| SLC25A4 | SNV | Missense_Mutation | novel | c.657N>G | p.Ser219Arg | p.S219R | P12235 | protein_coding | tolerated(0.13) | benign(0.109) | TCGA-AA-A010-01 | Colorectum | colon adenocarcinoma | Female | <65 | I/II | Chemotherapy | folinic | CR |
| SLC25A4 | SNV | Missense_Mutation | c.344N>A | p.Gly115Asp | p.G115D | P12235 | protein_coding | deleterious(0.01) | probably_damaging(0.982) | TCGA-AD-6888-01 | Colorectum | colon adenocarcinoma | Male | >=65 | III/IV | Unknown | Unknown | PD | |
| SLC25A4 | SNV | Missense_Mutation | c.455N>A | p.Arg152His | p.R152H | P12235 | protein_coding | deleterious(0) | probably_damaging(0.995) | TCGA-AD-6964-01 | Colorectum | colon adenocarcinoma | Male | <65 | III/IV | Chemotherapy | folfox | PD | |
| SLC25A4 | SNV | Missense_Mutation | rs748031233 | c.670N>A | p.Ala224Thr | p.A224T | P12235 | protein_coding | deleterious(0) | possibly_damaging(0.869) | TCGA-AZ-4313-01 | Colorectum | colon adenocarcinoma | Female | <65 | I/II | Unknown | Unknown | SD |
| SLC25A4 | SNV | Missense_Mutation | c.740N>T | p.Ala247Val | p.A247V | P12235 | protein_coding | deleterious(0.04) | benign(0.013) | TCGA-CK-4951-01 | Colorectum | colon adenocarcinoma | Female | >=65 | I/II | Unknown | Unknown | PD | |
| SLC25A4 | SNV | Missense_Mutation | c.848G>A | p.Gly283Asp | p.G283D | P12235 | protein_coding | deleterious(0.02) | possibly_damaging(0.899) | TCGA-CK-6746-01 | Colorectum | colon adenocarcinoma | Female | >=65 | I/II | Unknown | Unknown | SD | |
| SLC25A4 | SNV | Missense_Mutation | novel | c.703C>T | p.Arg235Cys | p.R235C | P12235 | protein_coding | tolerated(0.06) | possibly_damaging(0.554) | TCGA-A5-A0G2-01 | Endometrium | uterine corpus endometrioid carcinoma | Female | <65 | III/IV | Unknown | Unknown | SD |
| Page: 1 2 3 |
Top |
Related drugs of malignant transformation related genes |
| Identification of chemicals and drugs interact with genes involved in malignant transfromation |
| (DGIdb 4.0) |
| Entrez ID | Symbol | Category | Interaction Types | Drug Claim Name | Drug Name | PMIDs |
| 291 | SLC25A4 | DRUGGABLE GENOME, TRANSPORTER | Clodronate | CLODRONIC ACID | ||
| 291 | SLC25A4 | DRUGGABLE GENOME, TRANSPORTER | inhibitor | 178101293 | ||
| 291 | SLC25A4 | DRUGGABLE GENOME, TRANSPORTER | CLODRONATE | CLODRONIC ACID | ||
| 291 | SLC25A4 | DRUGGABLE GENOME, TRANSPORTER | inhibitor | 53801038 |
| Page: 1 |

Copyright 2023-Present -The University of Texas Health Science Center at Houston |