
|
|||||
|
 | |
| |
| |
| |
| |
| |
|
Gene: GNG10 |
Gene summary for GNG10 |
| Gene information | Species | Human | Gene symbol | GNG10 | Gene ID | 2790 |
| Gene name | G protein subunit gamma 10 | |
| Gene Alias | GNG10 | |
| Cytomap | 9q31.3 | |
| Gene Type | protein-coding | GO ID | GO:0007154 | UniProtAcc | A0A024R156 |
Top |
Malignant transformation analysis |
| Identification of the aberrant gene expression in precancerous and cancerous lesions by comparing the gene expression of stem-like cells in diseased tissues with normal stem cells |
| Entrez ID | Symbol | Replicates | Species | Organ | Tissue | Adj P-value | Log2FC | Malignancy |
| 2790 | GNG10 | sample3 | Human | Cervix | CC | 2.04e-34 | 5.23e-01 | 0.1387 |
| 2790 | GNG10 | H2 | Human | Cervix | HSIL_HPV | 1.19e-12 | 3.21e-01 | 0.0632 |
| 2790 | GNG10 | T1 | Human | Cervix | CC | 9.83e-04 | 1.91e-01 | 0.0918 |
| 2790 | GNG10 | T2 | Human | Cervix | CC | 1.02e-06 | 3.75e-01 | 0.0709 |
| 2790 | GNG10 | T3 | Human | Cervix | CC | 2.76e-28 | 5.39e-01 | 0.1389 |
| 2790 | GNG10 | HTA11_3410_2000001011 | Human | Colorectum | AD | 6.55e-04 | 1.23e-01 | 0.0155 |
| 2790 | GNG10 | HTA11_2487_2000001011 | Human | Colorectum | SER | 1.14e-02 | 1.44e-01 | -0.1808 |
| 2790 | GNG10 | HTA11_1938_2000001011 | Human | Colorectum | AD | 2.86e-06 | 2.65e-01 | -0.0811 |
| 2790 | GNG10 | HTA11_78_2000001011 | Human | Colorectum | AD | 2.20e-05 | 1.68e-01 | -0.1088 |
| 2790 | GNG10 | HTA11_347_2000001011 | Human | Colorectum | AD | 1.02e-14 | 2.74e-01 | -0.1954 |
| 2790 | GNG10 | HTA11_411_2000001011 | Human | Colorectum | SER | 2.78e-05 | 3.31e-01 | -0.2602 |
| 2790 | GNG10 | HTA11_83_2000001011 | Human | Colorectum | SER | 8.73e-04 | 1.91e-01 | -0.1526 |
| 2790 | GNG10 | HTA11_696_2000001011 | Human | Colorectum | AD | 9.55e-09 | 1.70e-01 | -0.1464 |
| 2790 | GNG10 | HTA11_866_2000001011 | Human | Colorectum | AD | 9.04e-05 | 1.35e-01 | -0.1001 |
| 2790 | GNG10 | HTA11_1391_2000001011 | Human | Colorectum | AD | 4.63e-07 | 2.19e-01 | -0.059 |
| 2790 | GNG10 | HTA11_2992_2000001011 | Human | Colorectum | SER | 1.09e-02 | 2.39e-01 | -0.1706 |
| 2790 | GNG10 | HTA11_5212_2000001011 | Human | Colorectum | AD | 3.97e-04 | 2.15e-01 | -0.2061 |
| 2790 | GNG10 | HTA11_5216_2000001011 | Human | Colorectum | SER | 3.40e-02 | 2.52e-01 | -0.1462 |
| 2790 | GNG10 | HTA11_7862_2000001011 | Human | Colorectum | AD | 7.36e-06 | 2.34e-01 | -0.0179 |
| 2790 | GNG10 | HTA11_866_3004761011 | Human | Colorectum | AD | 4.30e-20 | 4.15e-01 | 0.096 |
| Page: 1 2 3 4 5 6 7 8 9 |
| Tissue | Expression Dynamics | Abbreviation |
| Cervix | 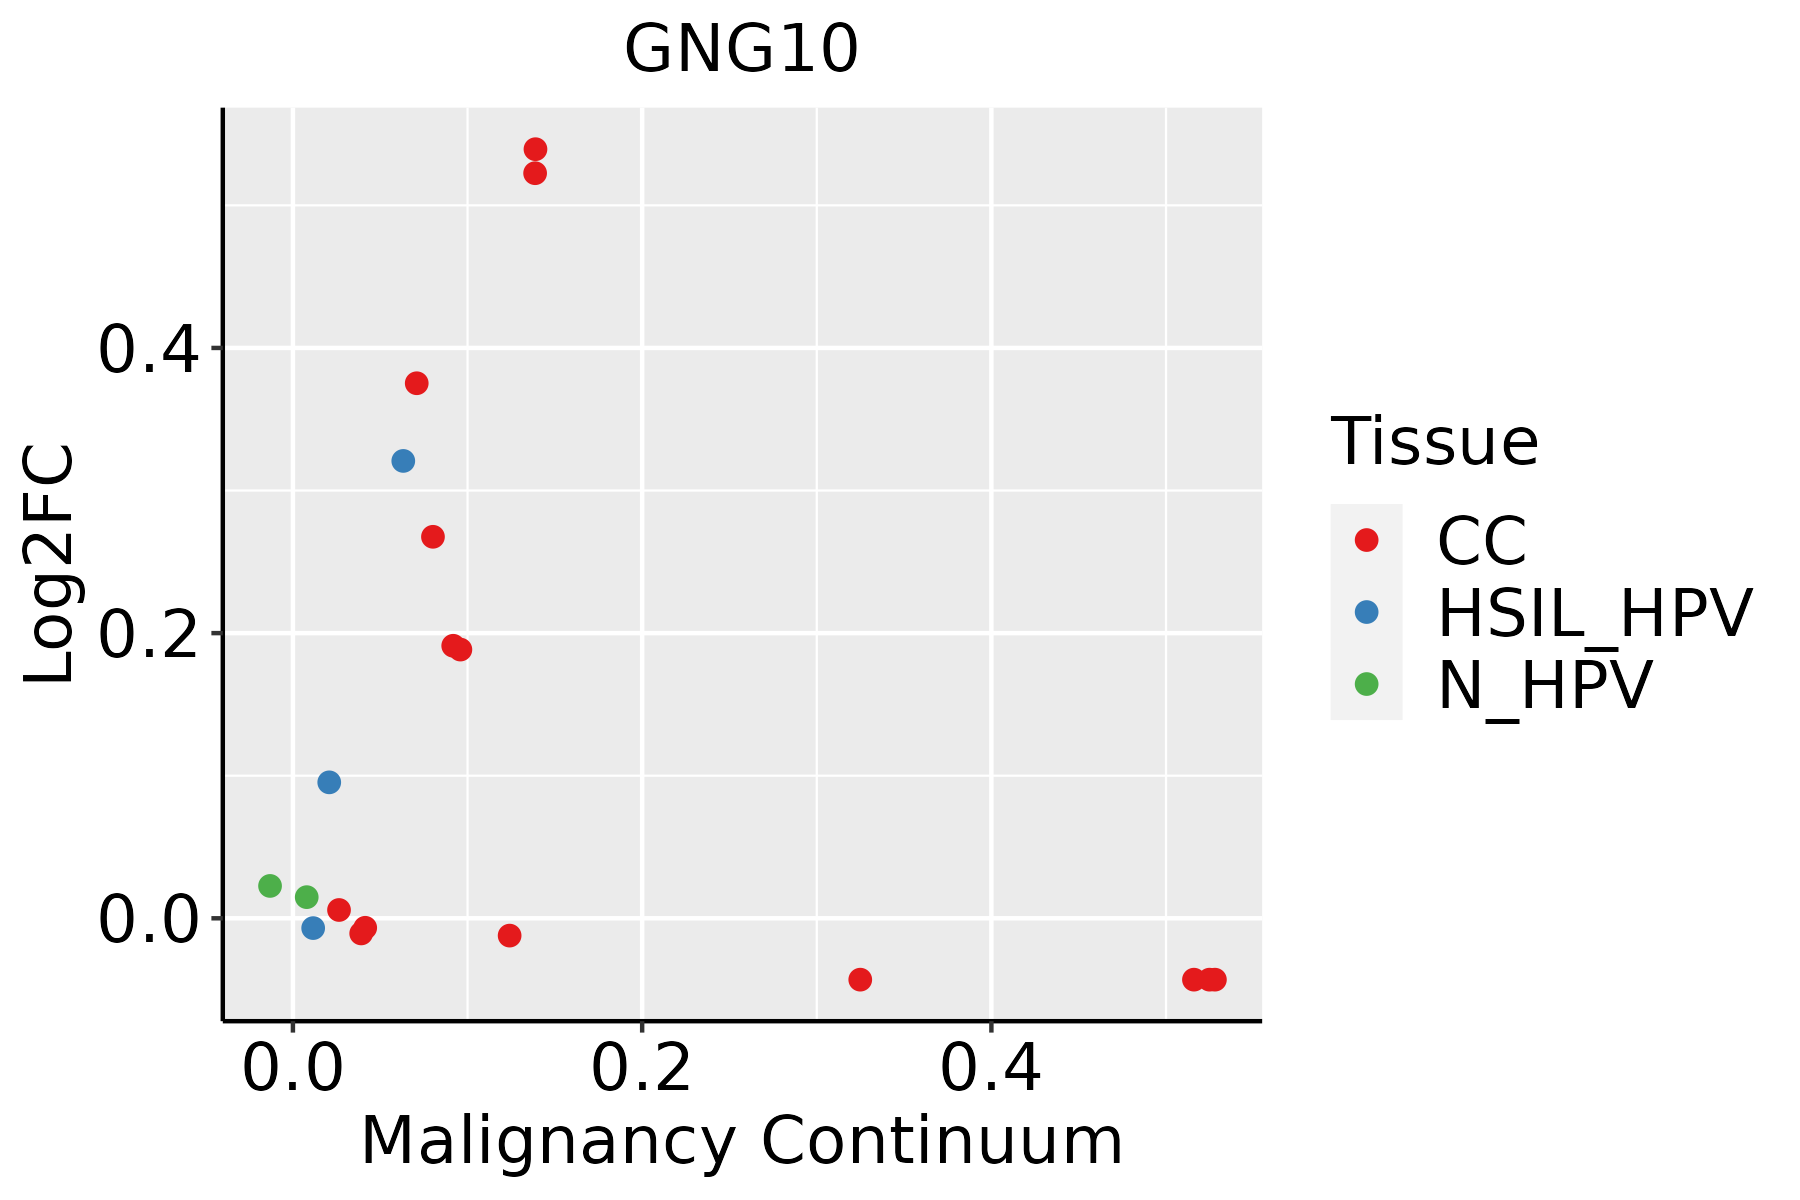 | CC: Cervix cancer |
| HSIL_HPV: HPV-infected high-grade squamous intraepithelial lesions | ||
| N_HPV: HPV-infected normal cervix | ||
| Colorectum (GSE201348) | 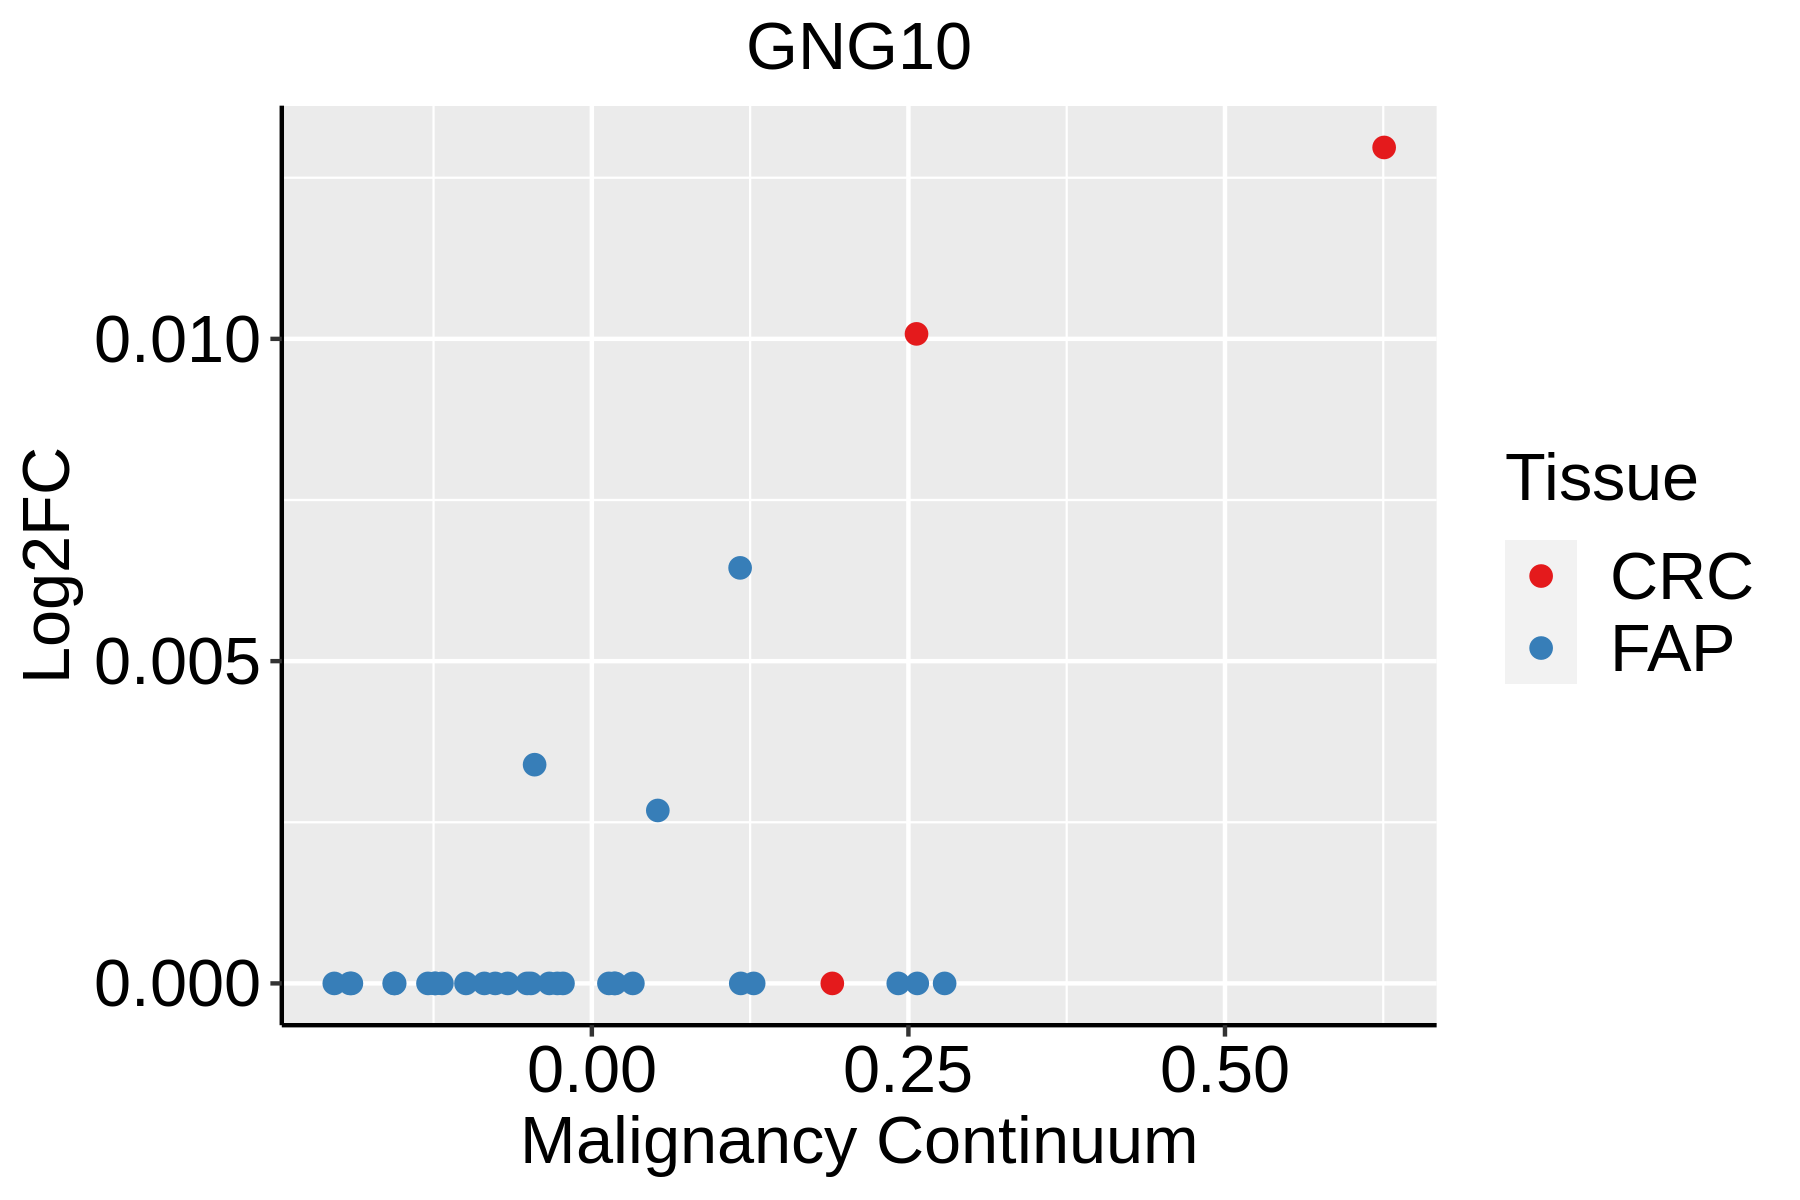 | FAP: Familial adenomatous polyposis |
| CRC: Colorectal cancer | ||
| Colorectum (HTA11) |  | AD: Adenomas |
| SER: Sessile serrated lesions | ||
| MSI-H: Microsatellite-high colorectal cancer | ||
| MSS: Microsatellite stable colorectal cancer | ||
| Esophagus | 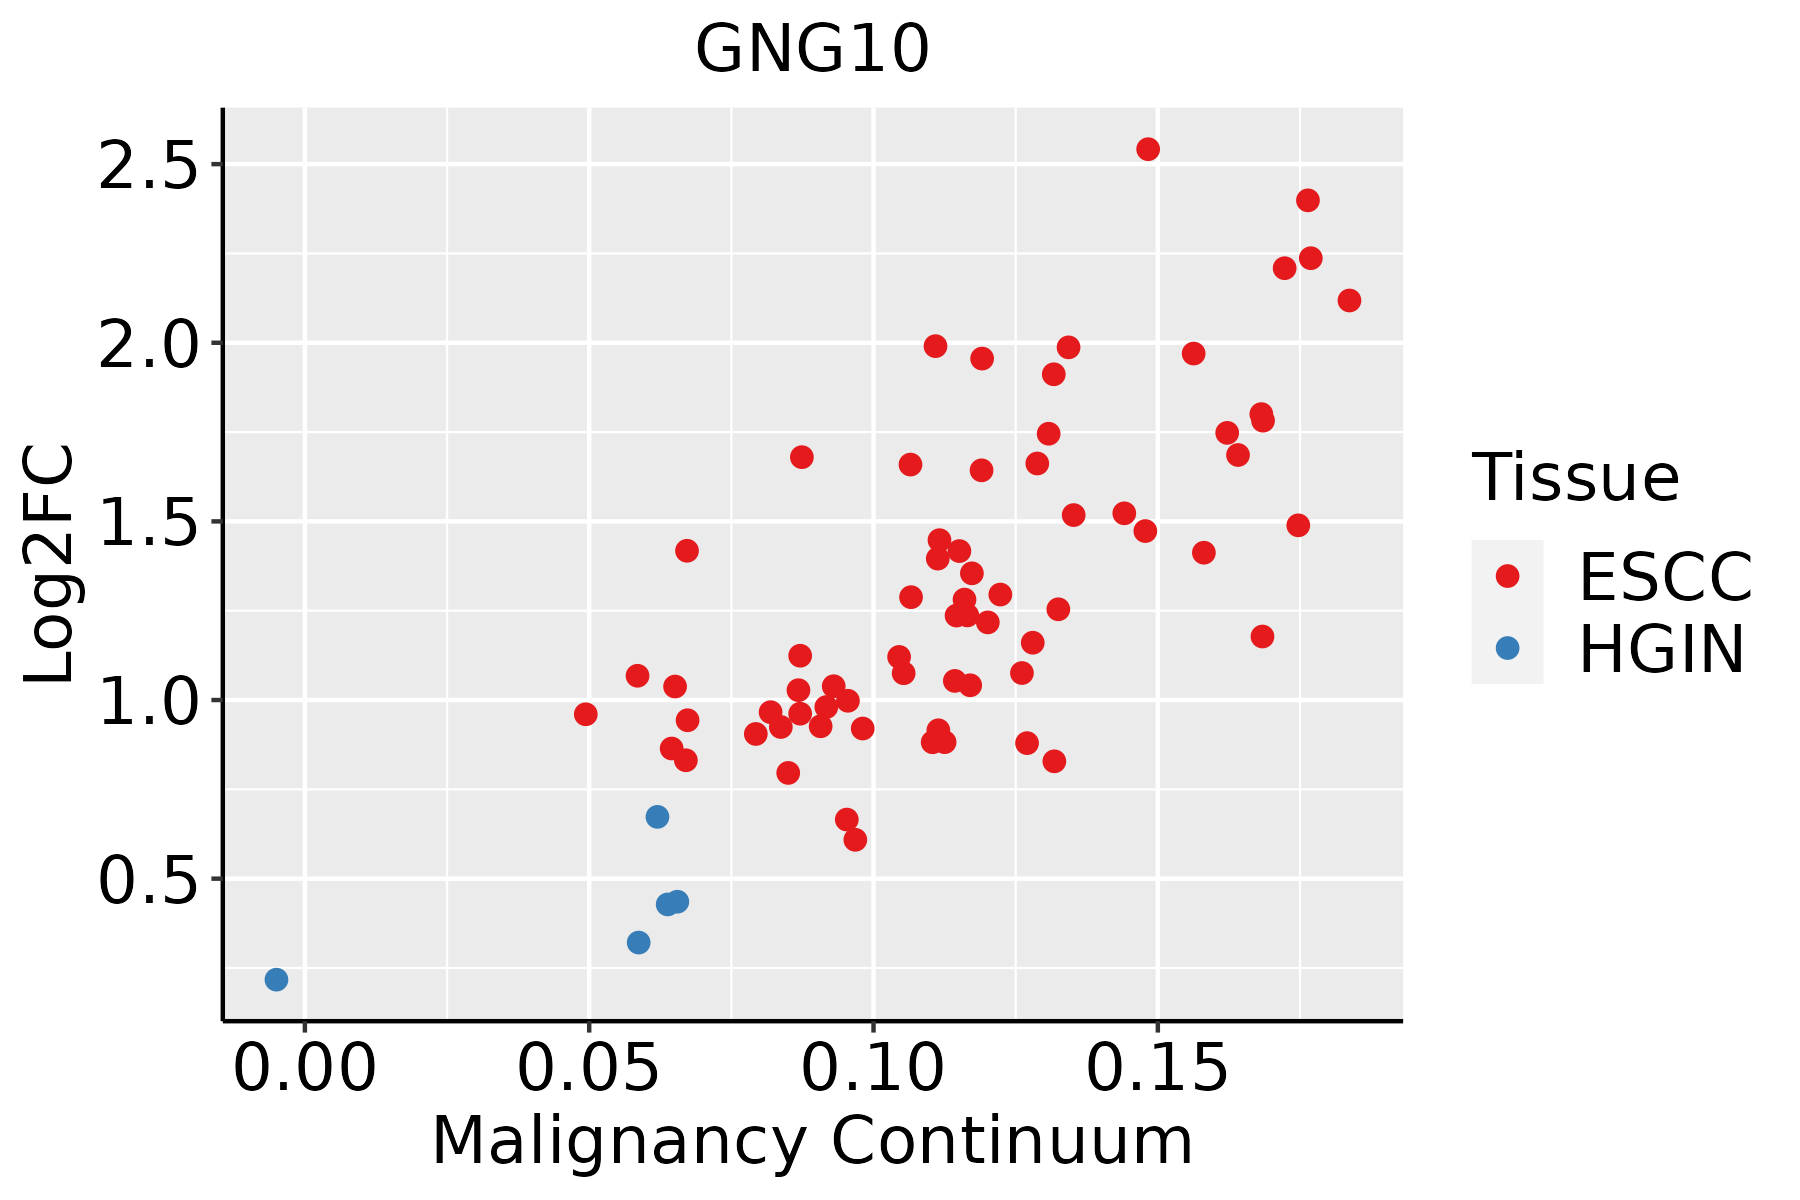 | ESCC: Esophageal squamous cell carcinoma |
| HGIN: High-grade intraepithelial neoplasias | ||
| LGIN: Low-grade intraepithelial neoplasias | ||
| GC | 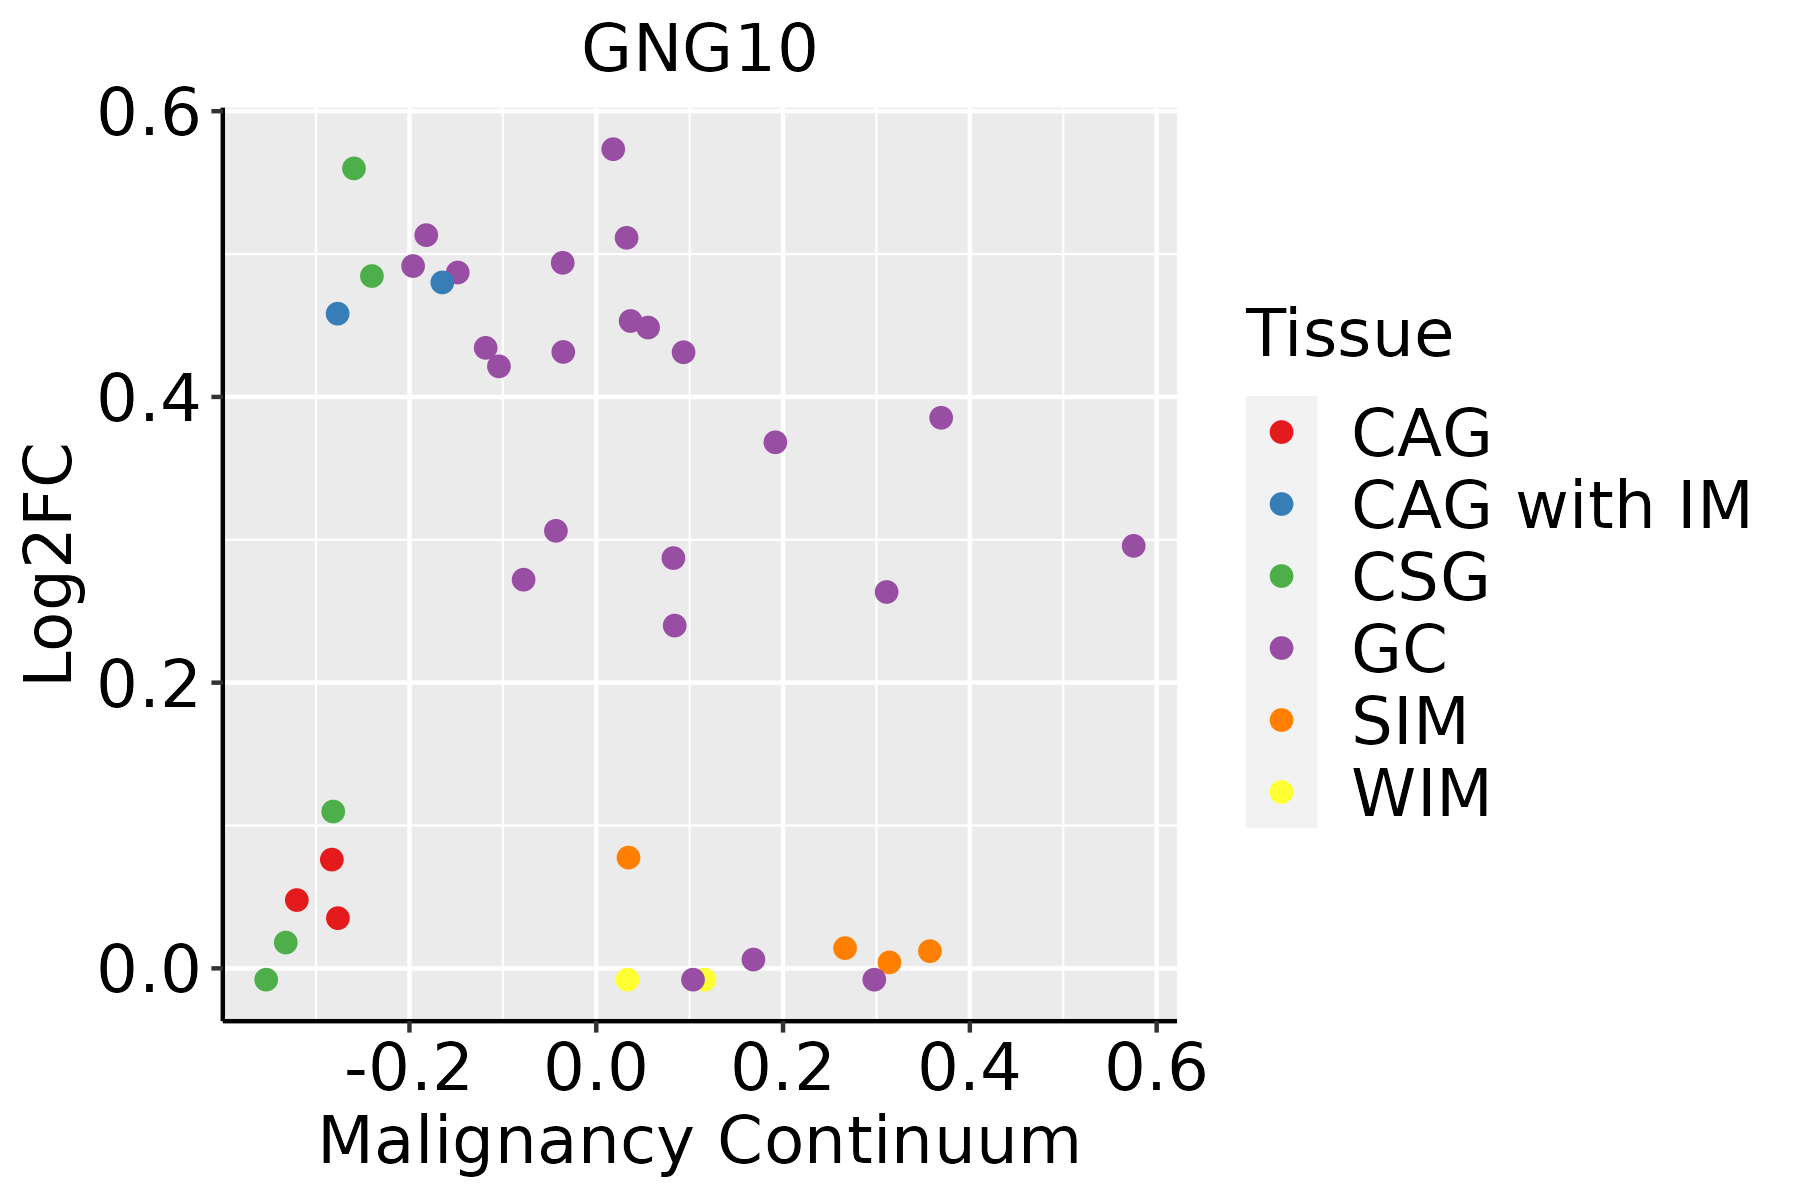 | CAG: Chronic atrophic gastritis |
| CAG with IM: Chronic atrophic gastritis with intestinal metaplasia | ||
| CSG: Chronic superficial gastritis | ||
| GC: Gastric cancer | ||
| SIM: Severe intestinal metaplasia | ||
| WIM: Wild intestinal metaplasia | ||
| Liver | 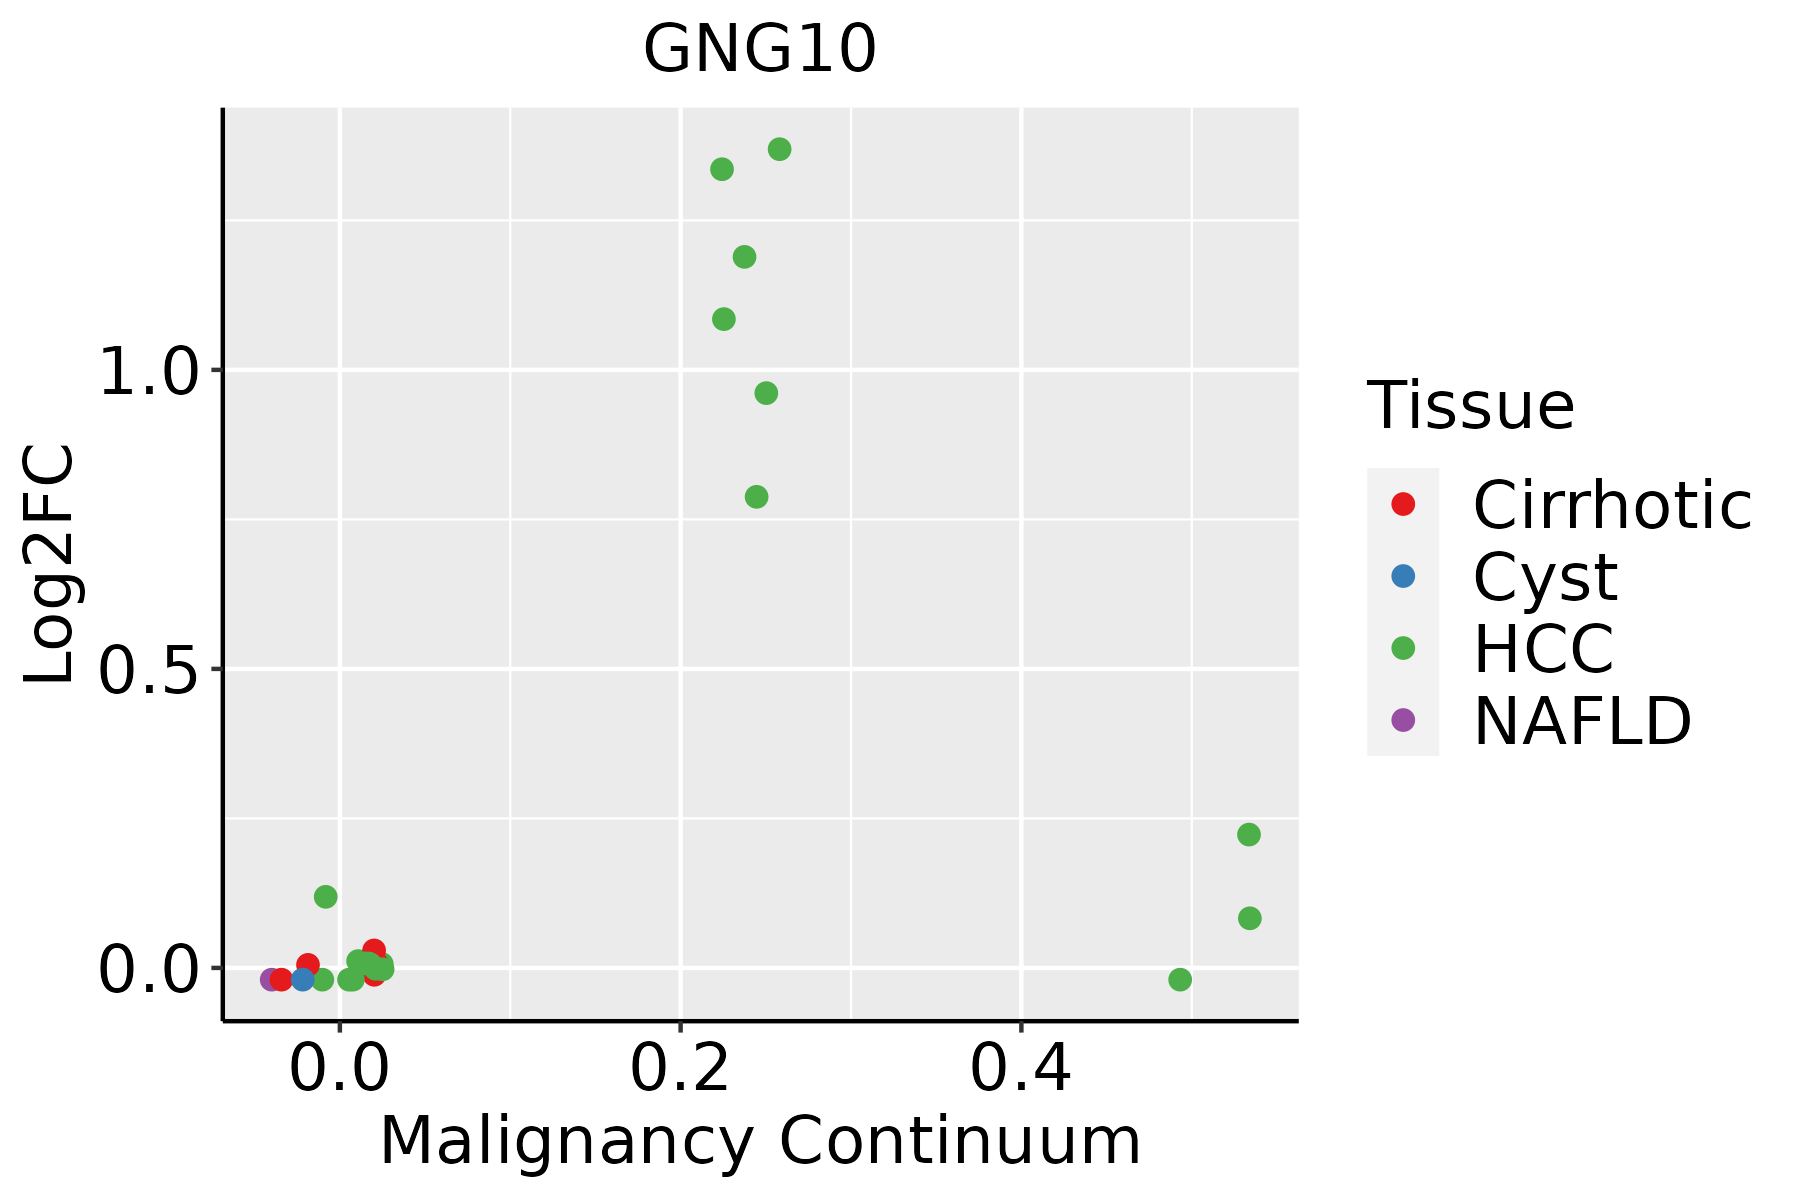 | HCC: Hepatocellular carcinoma |
| NAFLD: Non-alcoholic fatty liver disease | ||
| Prostate |  | BPH: Benign Prostatic Hyperplasia |
| ∗log2FC in expression of this searched gene in stem-like cells from each diseased tissue sample relative to stem-like cells in normal samples in each tissue plotted against the malignancy continuum. Samples are colored based on if they are from different disease stage. |
Top |
Malignant transformation related pathway analysis |
| Find out the enriched GO biological processes and KEGG pathways involved in transition from healthy to precancer to cancer |
| Tissue | Disease Stage | Enriched GO biological Processes |
| Colorectum | AD |  |
| Colorectum | SER |  |
| Colorectum | MSS |  |
| Colorectum | MSI-H |  |
| Colorectum | FAP |  |
| ∗Top 15 enriched GO BP terms are showed in the bar plot of each disease state in each tissue. Each row represents a significant GO biological process which is colored according to the -log10(p.adjust). |
| Page: 1 2 3 4 5 6 7 8 9 |
| GO ID | Tissue | Disease Stage | Description | Gene Ratio | Bg Ratio | pvalue | p.adjust | Count |
| Page: 1 |
| Pathway ID | Tissue | Disease Stage | Description | Gene Ratio | Bg Ratio | pvalue | p.adjust | qvalue | Count |
| hsa0472331 | Stomach | CAG with IM | Retrograde endocannabinoid signaling | 26/640 | 148/8465 | 3.97e-05 | 4.35e-04 | 3.05e-04 | 26 |
| hsa051673 | Stomach | CAG with IM | Kaposi sarcoma-associated herpesvirus infection | 30/640 | 194/8465 | 1.23e-04 | 1.23e-03 | 8.60e-04 | 30 |
| hsa0516331 | Stomach | CAG with IM | Human cytomegalovirus infection | 31/640 | 225/8465 | 7.66e-04 | 5.94e-03 | 4.17e-03 | 31 |
| hsa0517031 | Stomach | CAG with IM | Human immunodeficiency virus 1 infection | 29/640 | 212/8465 | 1.26e-03 | 8.93e-03 | 6.27e-03 | 29 |
| hsa0472341 | Stomach | CSG | Retrograde endocannabinoid signaling | 25/633 | 148/8465 | 9.04e-05 | 9.37e-04 | 6.74e-04 | 25 |
| hsa051674 | Stomach | CSG | Kaposi sarcoma-associated herpesvirus infection | 30/633 | 194/8465 | 1.01e-04 | 9.99e-04 | 7.19e-04 | 30 |
| hsa0516341 | Stomach | CSG | Human cytomegalovirus infection | 31/633 | 225/8465 | 6.37e-04 | 4.80e-03 | 3.45e-03 | 31 |
| hsa0517041 | Stomach | CSG | Human immunodeficiency virus 1 infection | 29/633 | 212/8465 | 1.06e-03 | 7.60e-03 | 5.47e-03 | 29 |
| hsa0472351 | Stomach | CSG | Retrograde endocannabinoid signaling | 25/633 | 148/8465 | 9.04e-05 | 9.37e-04 | 6.74e-04 | 25 |
| hsa051675 | Stomach | CSG | Kaposi sarcoma-associated herpesvirus infection | 30/633 | 194/8465 | 1.01e-04 | 9.99e-04 | 7.19e-04 | 30 |
| hsa0516351 | Stomach | CSG | Human cytomegalovirus infection | 31/633 | 225/8465 | 6.37e-04 | 4.80e-03 | 3.45e-03 | 31 |
| hsa0517051 | Stomach | CSG | Human immunodeficiency virus 1 infection | 29/633 | 212/8465 | 1.06e-03 | 7.60e-03 | 5.47e-03 | 29 |
| Page: 1 2 3 4 5 6 |
Top |
Cell-cell communication analysis |
| Identification of potential cell-cell interactions between two cell types and their ligand-receptor pairs for different disease states |
| Ligand | Receptor | LRpair | Pathway | Tissue | Disease Stage |
| Page: 1 |
Top |
Single-cell gene regulatory network inference analysis |
| Find out the significant the regulons (TFs) and the target genes of each regulon across cell types for different disease states |
| TF | Cell Type | Tissue | Disease Stage | Target Gene | RSS | Regulon Activity |
| ∗The dot plots of a searched regulon are shown for all cell subpopulations in each disease state of each tissue based on the regulon specific score inferred using pySCENIC and by calculating the average expression. |
| Page: 1 |
Top |
Somatic mutation of malignant transformation related genes |
| Annotation of somatic variants for genes involved in malignant transformation |
| Hugo Symbol | Variant Class | Variant Classification | dbSNP RS | HGVSc | HGVSp | HGVSp Short | SWISSPROT | BIOTYPE | SIFT | PolyPhen | Tumor Sample Barcode | Tissue | Histology | Sex | Age | Stage | Therapy Types | Drugs | Outcome |
| GNG10 | SNV | Missense_Mutation | c.123N>C | p.Gln41His | p.Q41H | P50151 | protein_coding | deleterious(0) | possibly_damaging(0.588) | TCGA-A2-A04W-01 | Breast | breast invasive carcinoma | Female | <65 | I/II | Chemotherapy | cytoxan | SD | |
| GNG10 | SNV | Missense_Mutation | rs779628567 | c.115N>A | p.Cys39Ser | p.C39S | P50151 | protein_coding | deleterious(0) | probably_damaging(0.997) | TCGA-DI-A1NO-01 | Endometrium | uterine corpus endometrioid carcinoma | Female | >=65 | III/IV | Unknown | Unknown | PD |
| GNG10 | SNV | Missense_Mutation | rs776244288 | c.178N>T | p.Arg60Trp | p.R60W | P50151 | protein_coding | tolerated(0.1) | probably_damaging(0.95) | TCGA-BR-4257-01 | Stomach | stomach adenocarcinoma | Female | >=65 | I/II | Unknown | Unknown | SD |
| Page: 1 |
Top |
Related drugs of malignant transformation related genes |
| Identification of chemicals and drugs interact with genes involved in malignant transfromation |
| (DGIdb 4.0) |
| Entrez ID | Symbol | Category | Interaction Types | Drug Claim Name | Drug Name | PMIDs |
| Page: 1 |

Copyright 2023-Present -The University of Texas Health Science Center at Houston |