
|
|||||
|
 | |
| |
| |
| |
| |
| |
|
Gene: GADD45G |
Gene summary for GADD45G |
| Gene information | Species | Human | Gene symbol | GADD45G | Gene ID | 10912 |
| Gene name | growth arrest and DNA damage inducible gamma | |
| Gene Alias | CR6 | |
| Cytomap | 9q22.2 | |
| Gene Type | protein-coding | GO ID | GO:0000165 | UniProtAcc | O95257 |
Top |
Malignant transformation analysis |
| Identification of the aberrant gene expression in precancerous and cancerous lesions by comparing the gene expression of stem-like cells in diseased tissues with normal stem cells |
| Entrez ID | Symbol | Replicates | Species | Organ | Tissue | Adj P-value | Log2FC | Malignancy |
| 10912 | GADD45G | GSM4909286 | Human | Breast | IDC | 5.10e-05 | -2.54e-01 | 0.1081 |
| 10912 | GADD45G | GSM4909297 | Human | Breast | IDC | 1.43e-10 | 5.56e-01 | 0.1517 |
| 10912 | GADD45G | GSM4909298 | Human | Breast | IDC | 2.84e-08 | 3.61e-01 | 0.1551 |
| 10912 | GADD45G | GSM4909301 | Human | Breast | IDC | 4.56e-42 | 1.02e+00 | 0.1577 |
| 10912 | GADD45G | GSM4909304 | Human | Breast | IDC | 5.48e-06 | 2.52e-01 | 0.1636 |
| 10912 | GADD45G | GSM4909306 | Human | Breast | IDC | 1.98e-13 | 4.23e-01 | 0.1564 |
| 10912 | GADD45G | GSM4909308 | Human | Breast | IDC | 1.25e-10 | 4.91e-01 | 0.158 |
| 10912 | GADD45G | GSM4909311 | Human | Breast | IDC | 1.36e-03 | -8.03e-02 | 0.1534 |
| 10912 | GADD45G | GSM4909319 | Human | Breast | IDC | 8.29e-08 | -1.45e-02 | 0.1563 |
| 10912 | GADD45G | GSM4909321 | Human | Breast | IDC | 6.14e-04 | 3.03e-01 | 0.1559 |
| 10912 | GADD45G | NCCBC3 | Human | Breast | DCIS | 1.17e-02 | -2.17e-01 | 0.1198 |
| 10912 | GADD45G | P1 | Human | Breast | IDC | 5.22e-04 | -1.80e-01 | 0.1527 |
| 10912 | GADD45G | DCIS2 | Human | Breast | DCIS | 5.49e-03 | -1.23e-01 | 0.0085 |
| 10912 | GADD45G | LZE4T | Human | Esophagus | ESCC | 1.17e-17 | 6.71e-01 | 0.0811 |
| 10912 | GADD45G | LZE7T | Human | Esophagus | ESCC | 3.00e-09 | 7.87e-01 | 0.0667 |
| 10912 | GADD45G | LZE24T | Human | Esophagus | ESCC | 4.93e-04 | 1.87e-01 | 0.0596 |
| 10912 | GADD45G | P1T-E | Human | Esophagus | ESCC | 1.19e-03 | 4.05e-01 | 0.0875 |
| 10912 | GADD45G | P2T-E | Human | Esophagus | ESCC | 9.09e-22 | 6.40e-01 | 0.1177 |
| 10912 | GADD45G | P4T-E | Human | Esophagus | ESCC | 3.49e-15 | 5.61e-01 | 0.1323 |
| 10912 | GADD45G | P5T-E | Human | Esophagus | ESCC | 4.68e-04 | 3.66e-01 | 0.1327 |
| Page: 1 2 3 4 |
| Tissue | Expression Dynamics | Abbreviation |
| Breast | 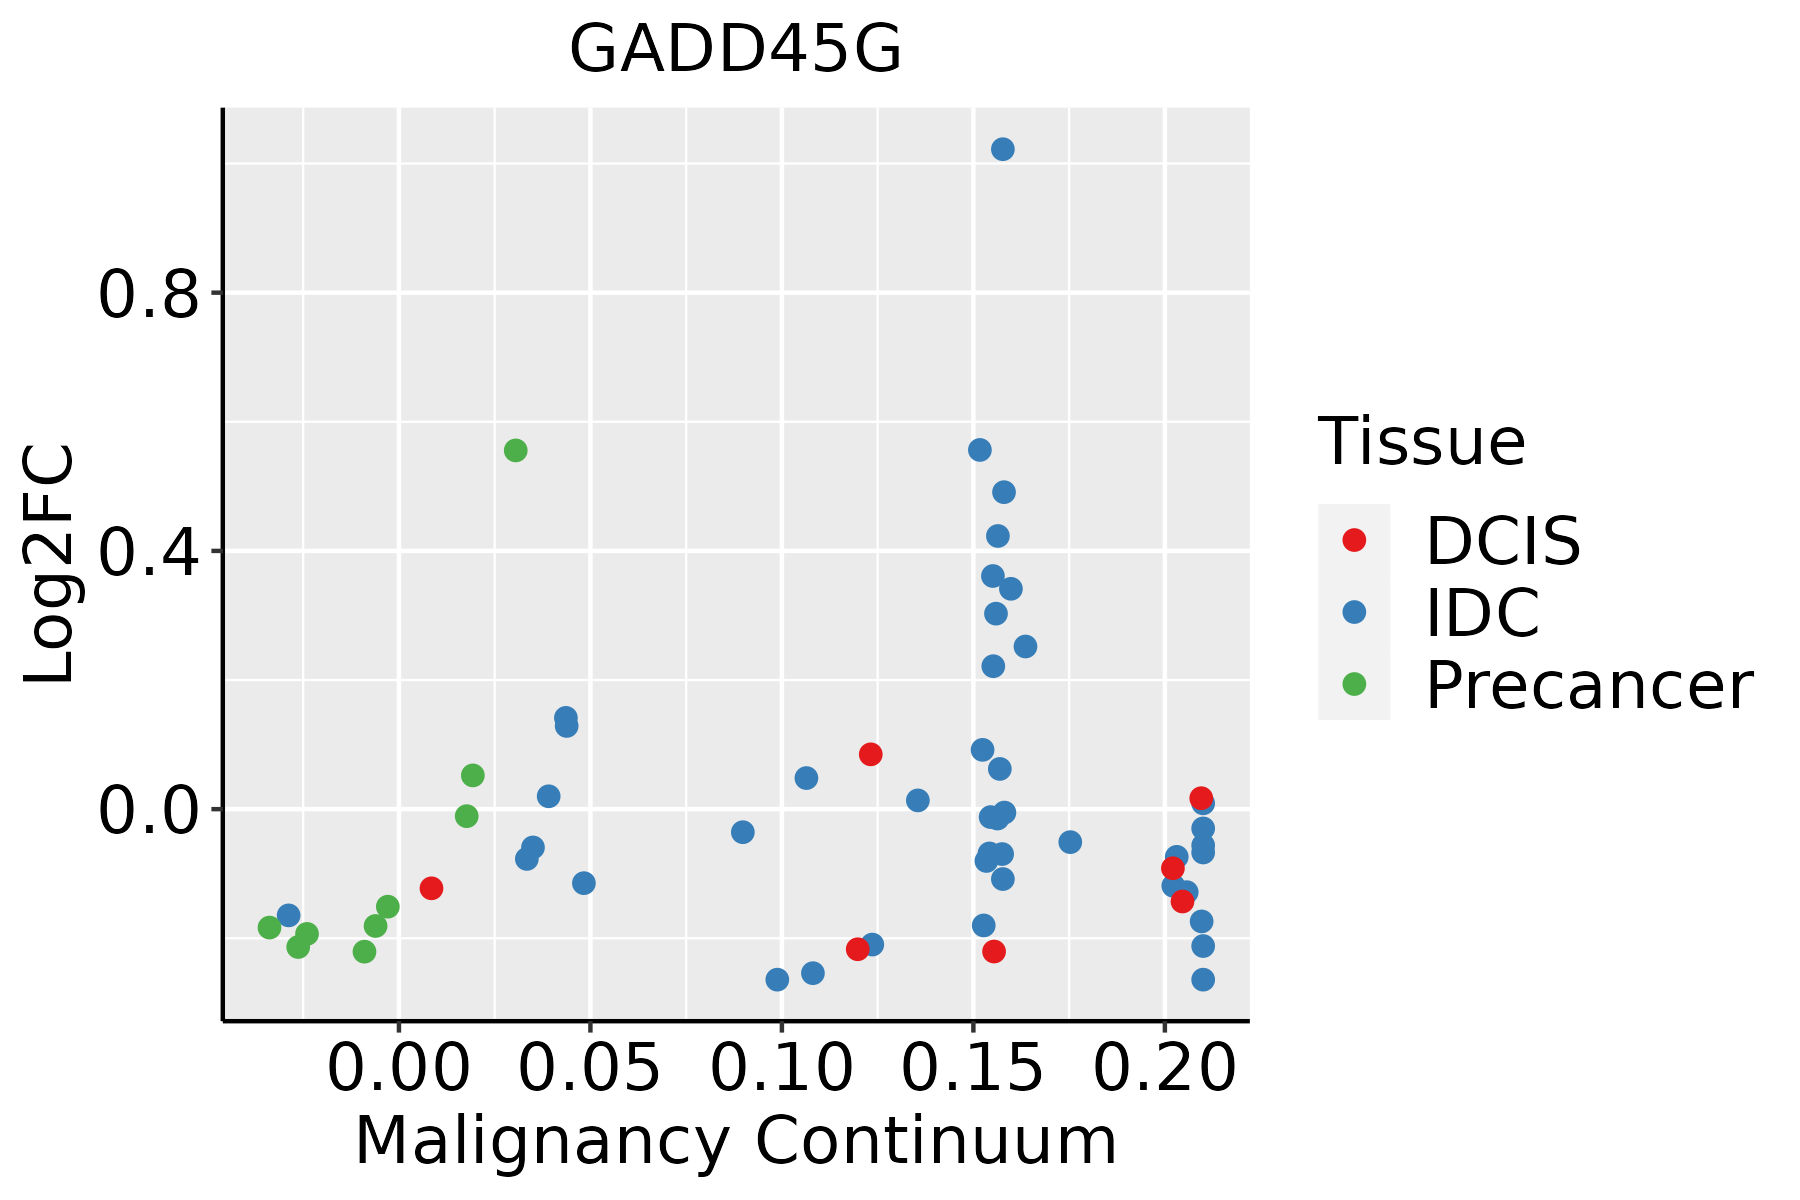 | IDC: Invasive ductal carcinoma |
| DCIS: Ductal carcinoma in situ | ||
| Precancer(BRCA1-mut): Precancerous lesion from BRCA1 mutation carriers | ||
| Esophagus | 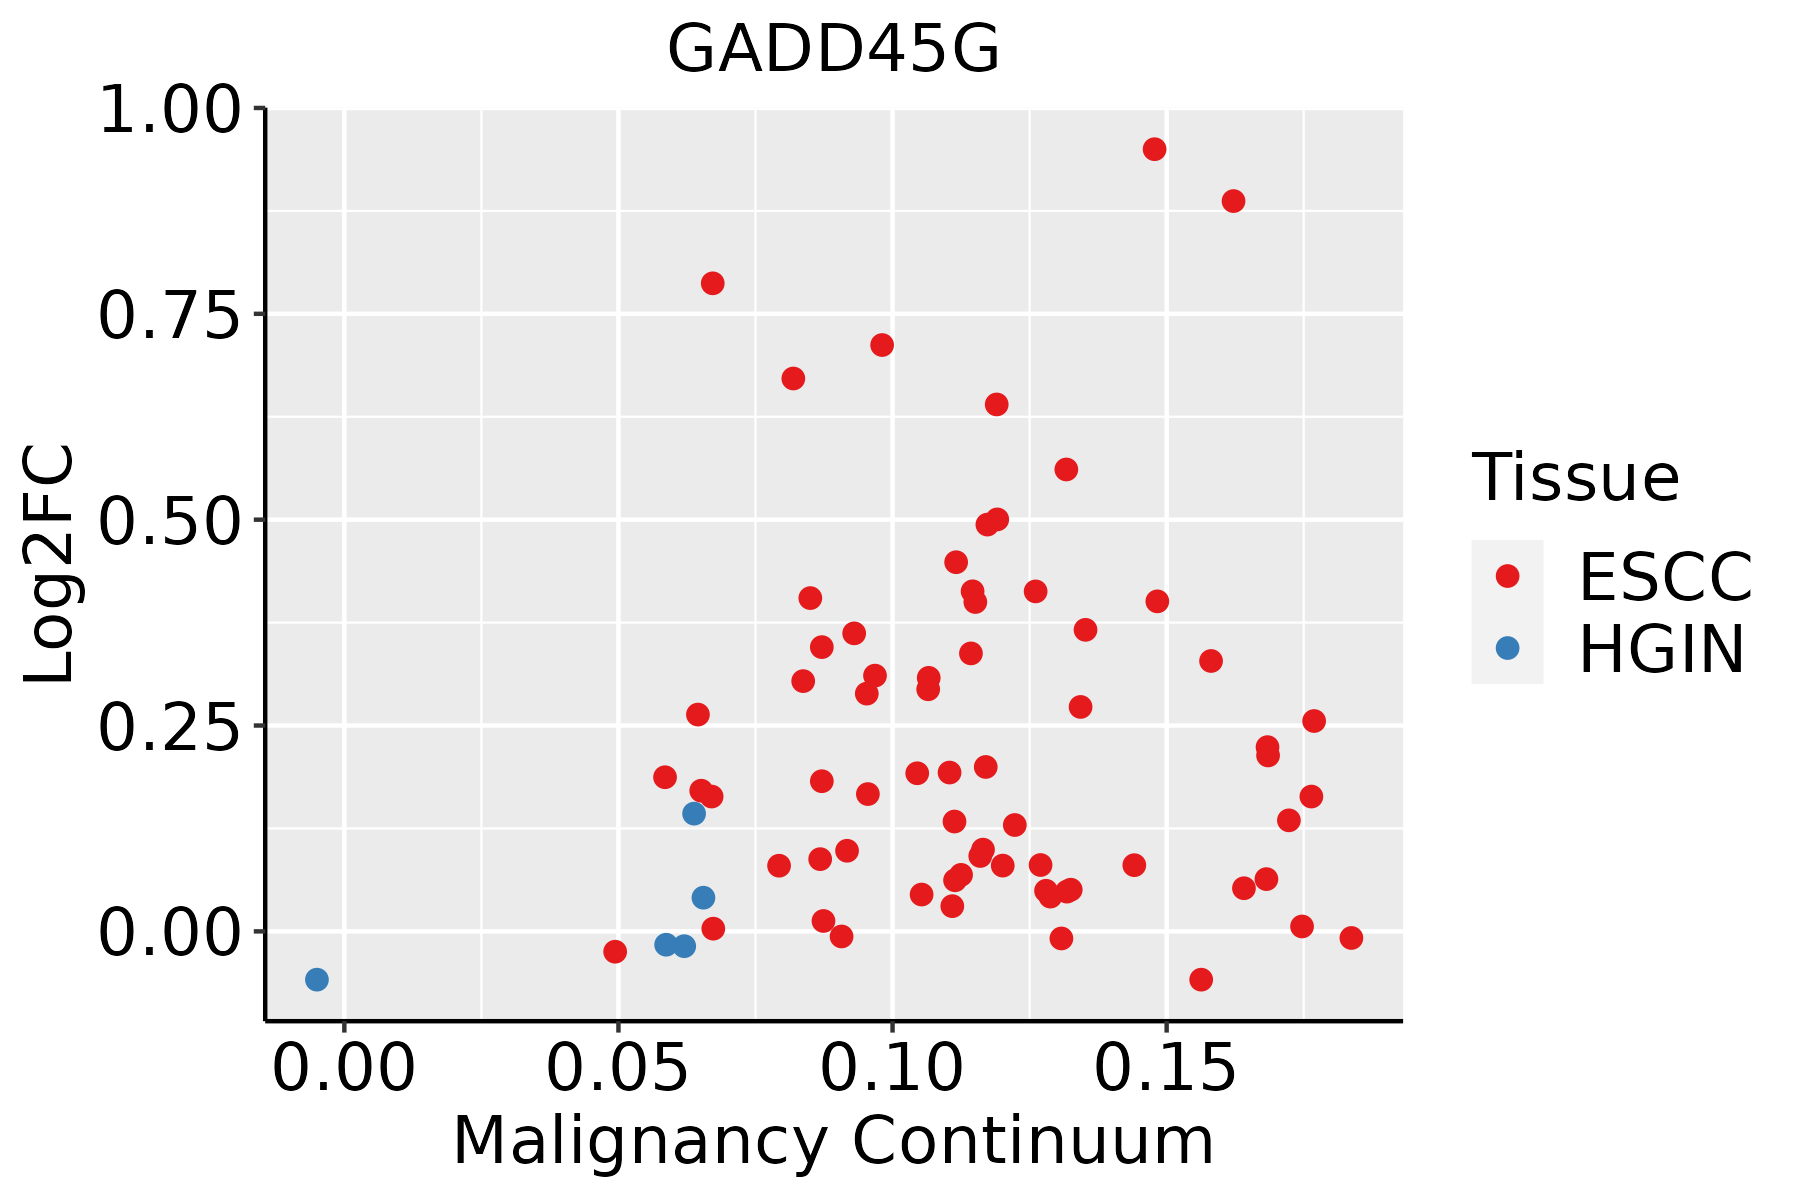 | ESCC: Esophageal squamous cell carcinoma |
| HGIN: High-grade intraepithelial neoplasias | ||
| LGIN: Low-grade intraepithelial neoplasias | ||
| Liver | 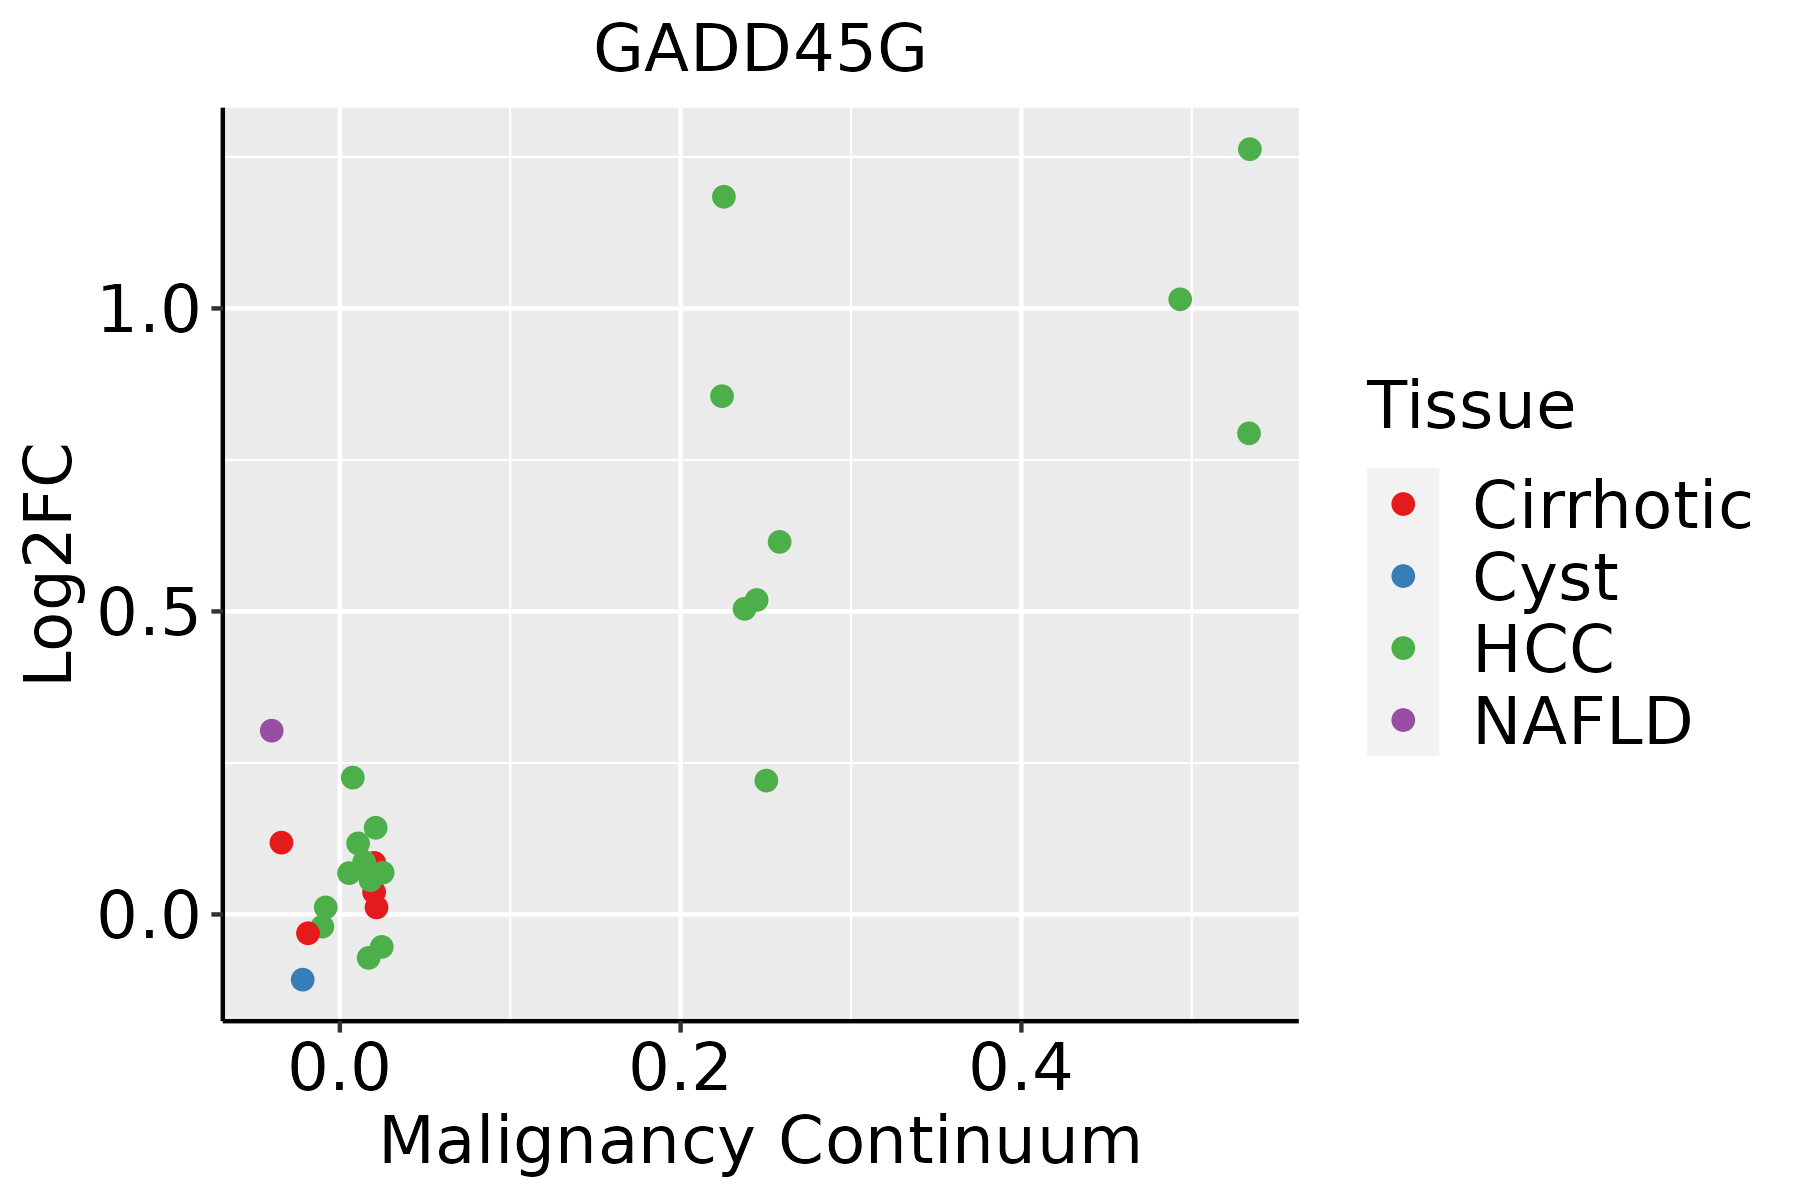 | HCC: Hepatocellular carcinoma |
| NAFLD: Non-alcoholic fatty liver disease | ||
| Lung | 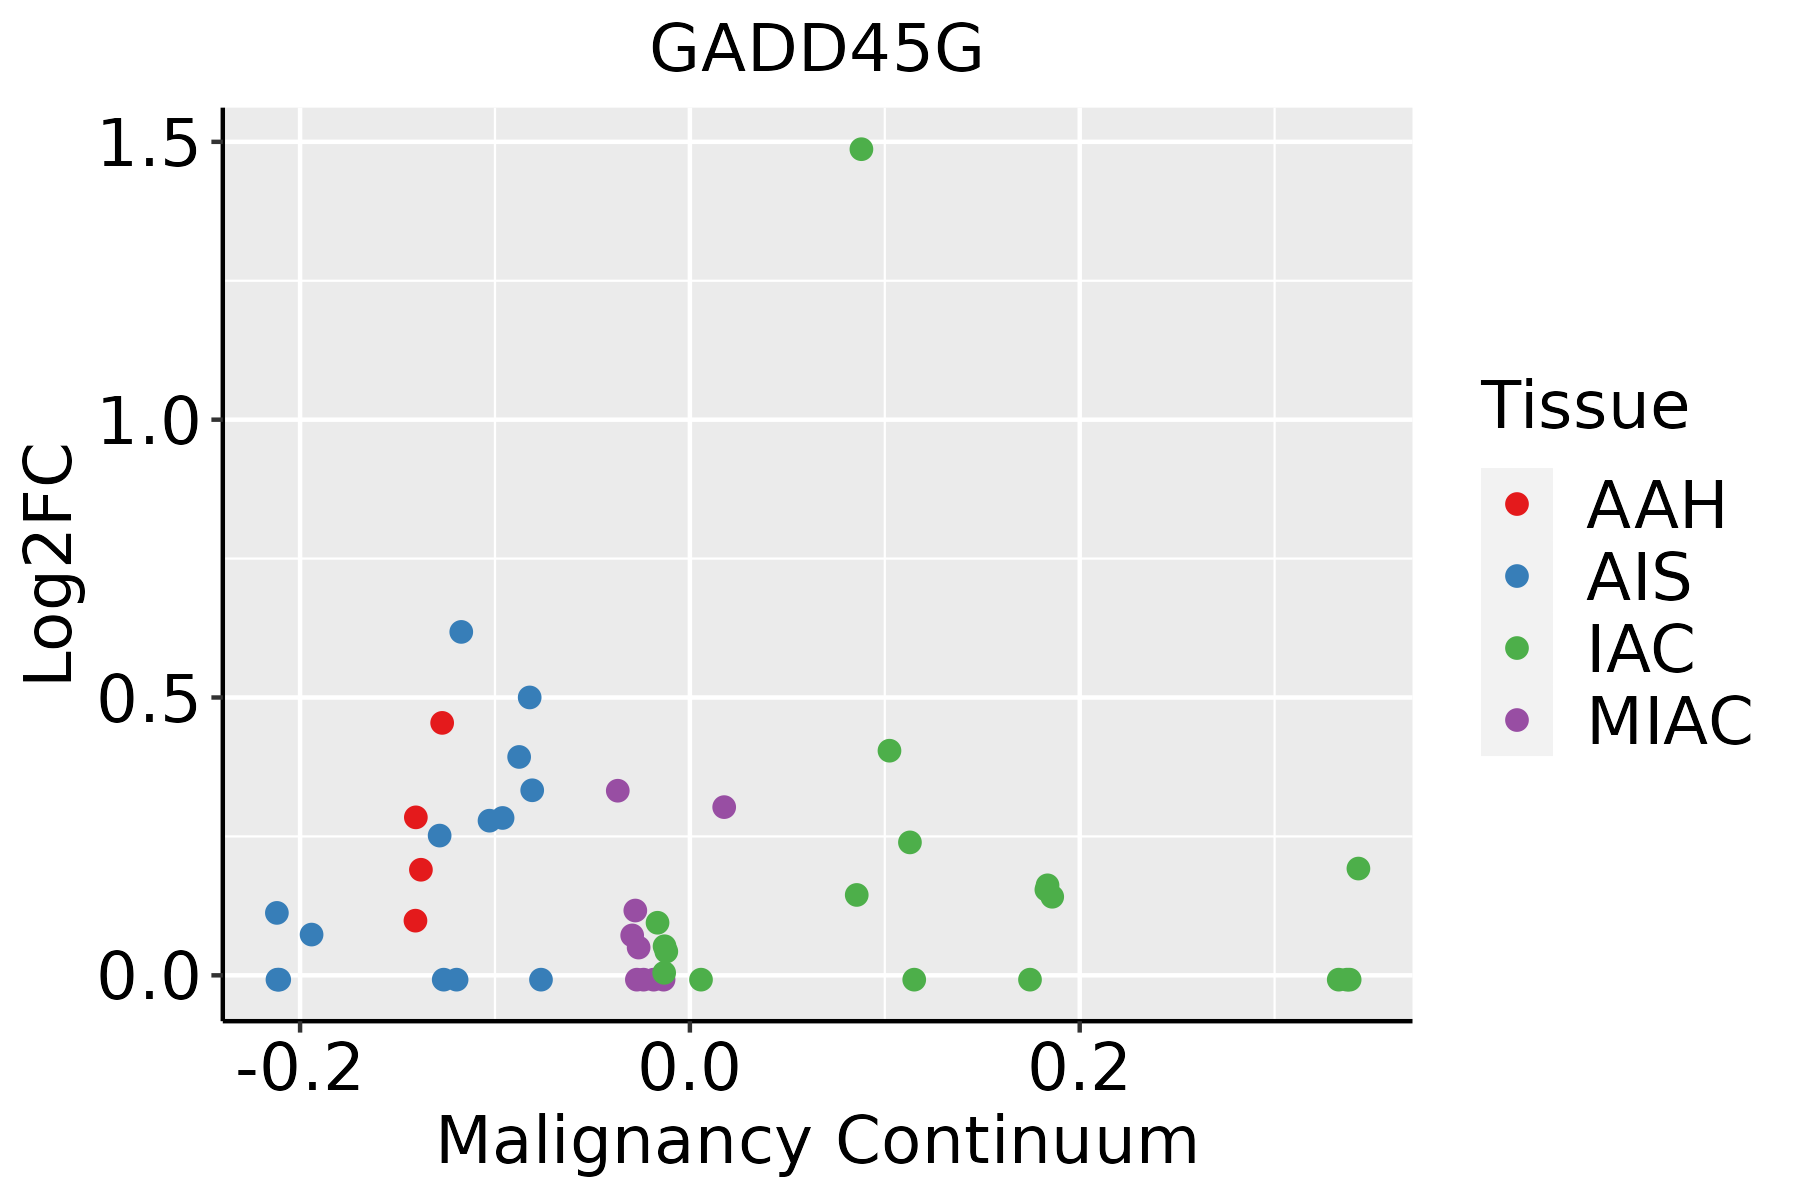 | AAH: Atypical adenomatous hyperplasia |
| AIS: Adenocarcinoma in situ | ||
| IAC: Invasive lung adenocarcinoma | ||
| MIA: Minimally invasive adenocarcinoma | ||
| Oral Cavity | 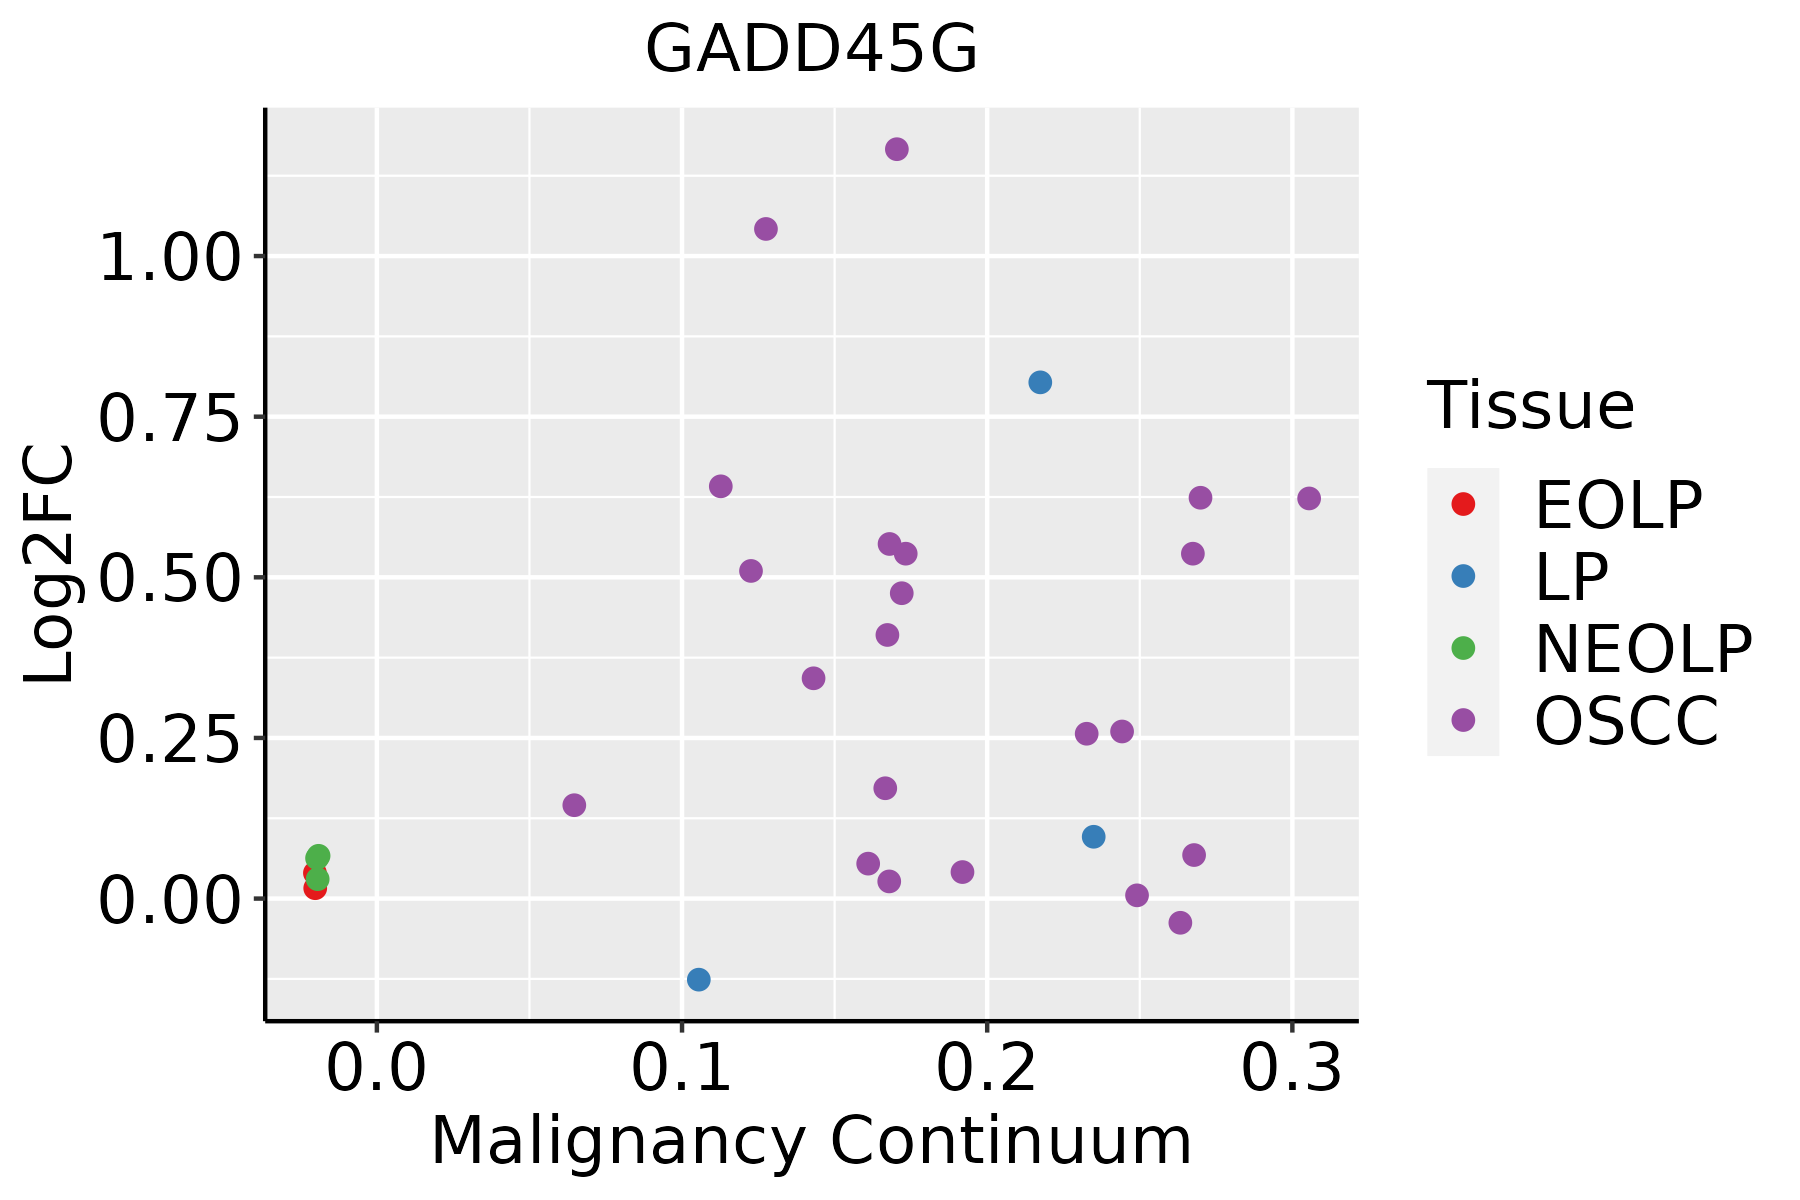 | EOLP: Erosive Oral lichen planus |
| LP: leukoplakia | ||
| NEOLP: Non-erosive oral lichen planus | ||
| OSCC: Oral squamous cell carcinoma | ||
| Prostate | 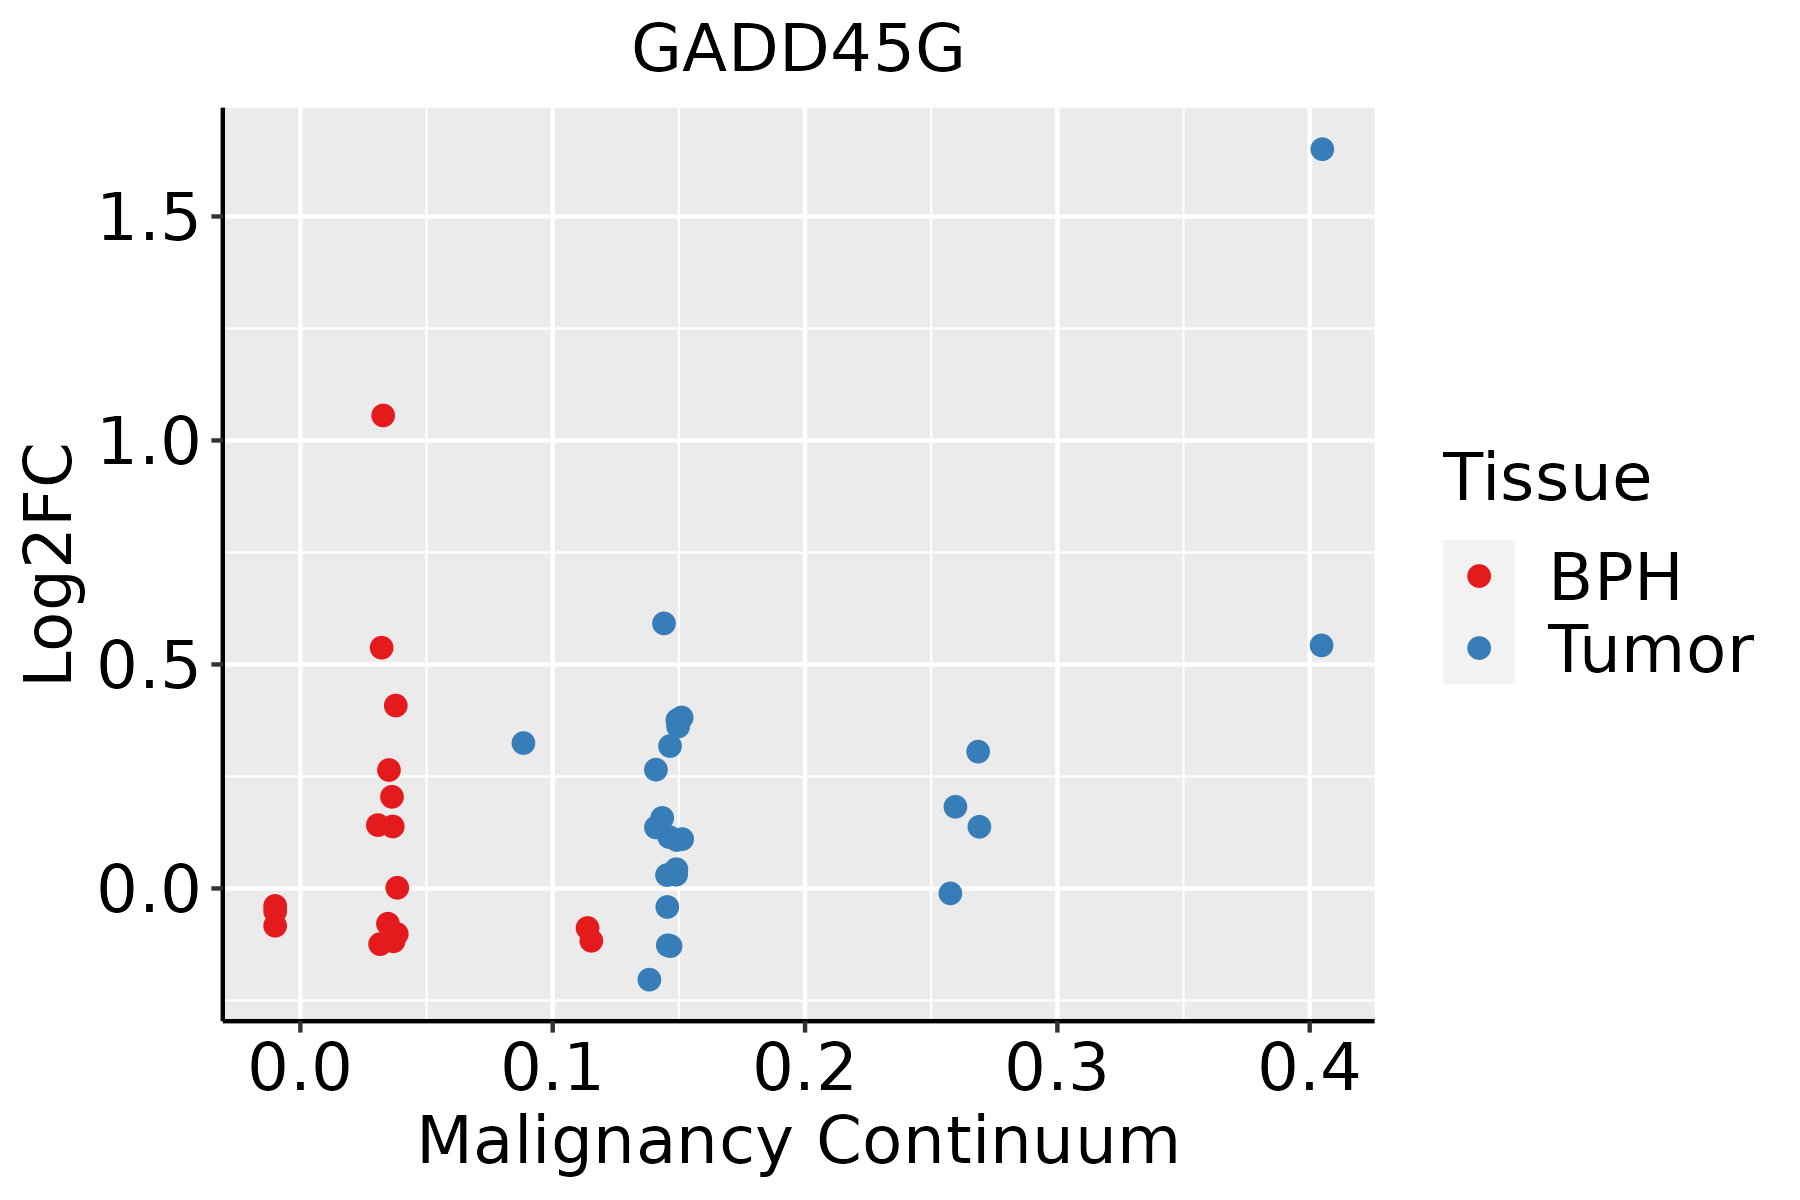 | BPH: Benign Prostatic Hyperplasia |
| Thyroid | 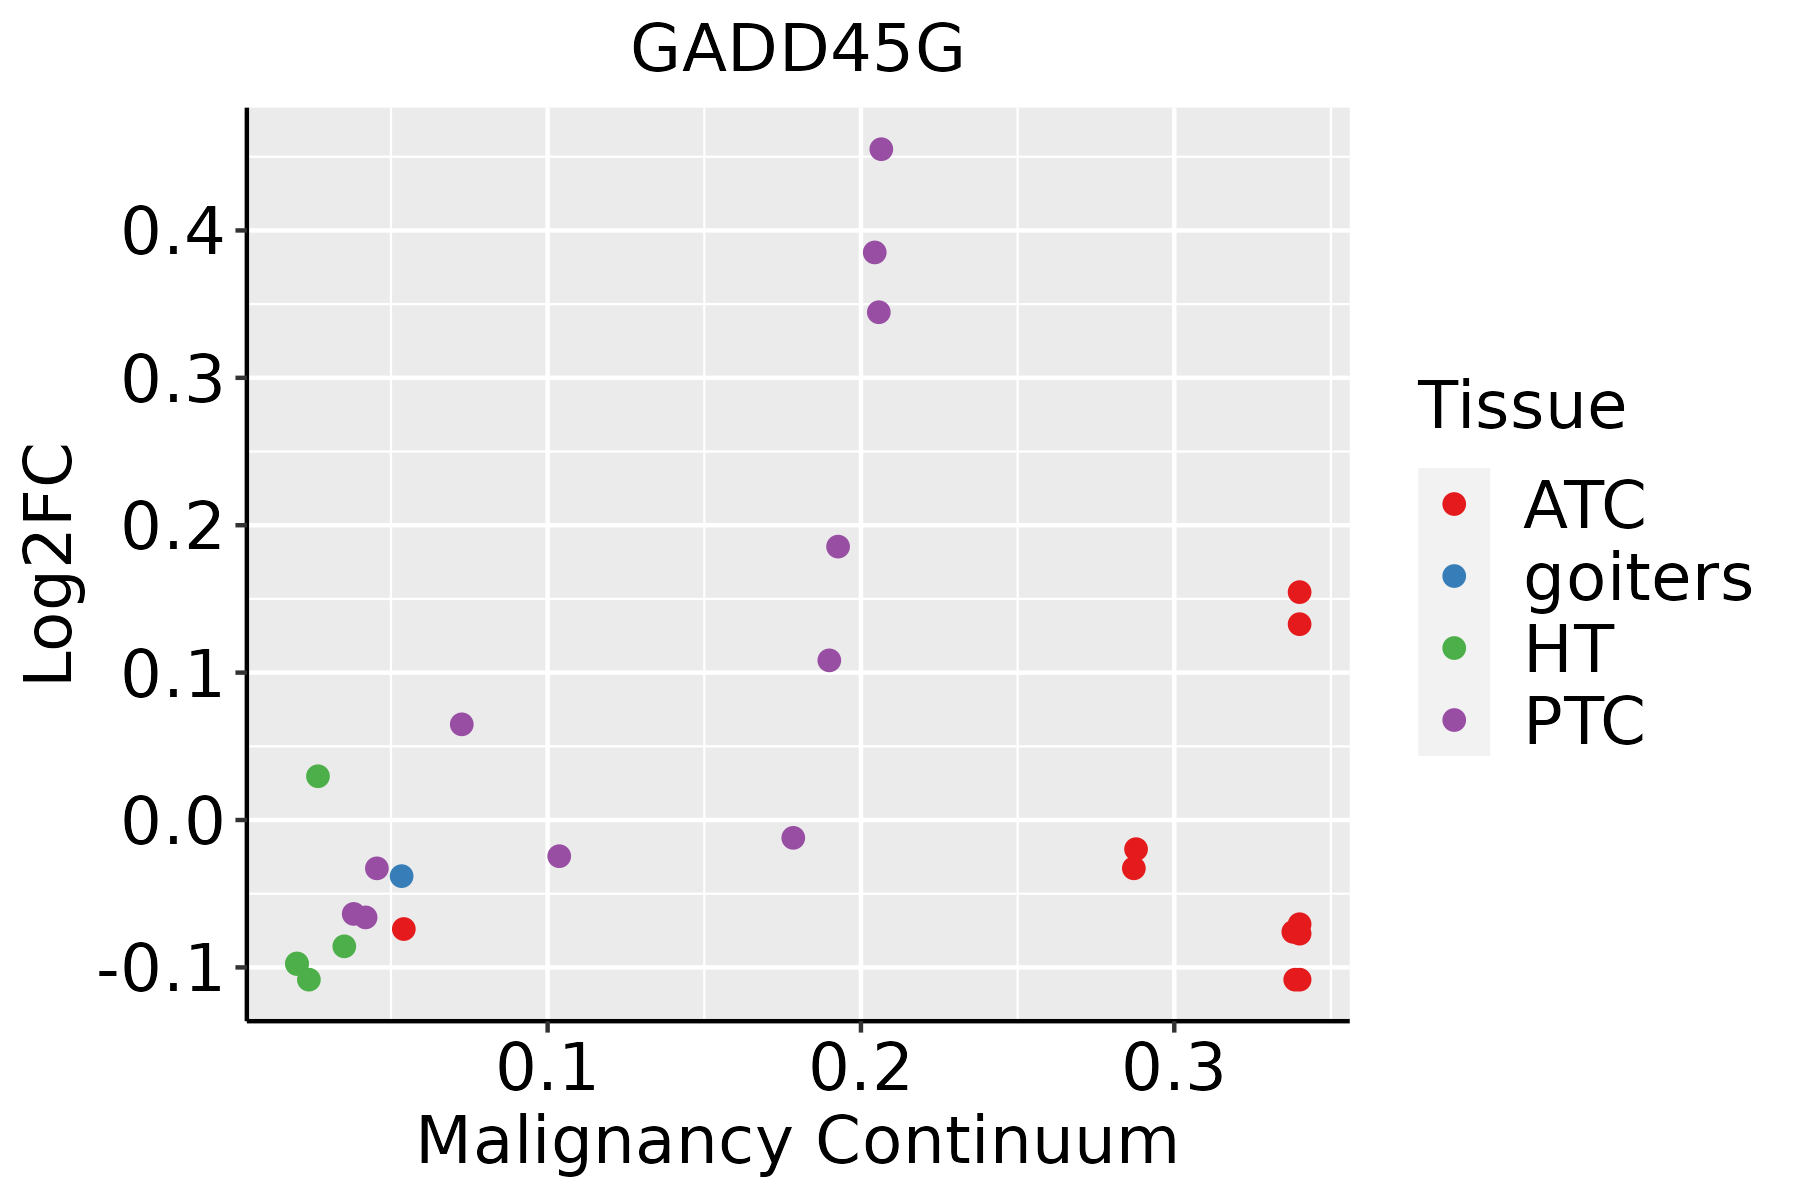 | ATC: Anaplastic thyroid cancer |
| HT: Hashimoto's thyroiditis | ||
| PTC: Papillary thyroid cancer |
| ∗log2FC in expression of this searched gene in stem-like cells from each diseased tissue sample relative to stem-like cells in normal samples in each tissue plotted against the malignancy continuum. Samples are colored based on if they are from different disease stage. |
Top |
Malignant transformation related pathway analysis |
| Find out the enriched GO biological processes and KEGG pathways involved in transition from healthy to precancer to cancer |
| Tissue | Disease Stage | Enriched GO biological Processes |
| Colorectum | AD |  |
| Colorectum | SER |  |
| Colorectum | MSS |  |
| Colorectum | MSI-H |  |
| Colorectum | FAP |  |
| ∗Top 15 enriched GO BP terms are showed in the bar plot of each disease state in each tissue. Each row represents a significant GO biological process which is colored according to the -log10(p.adjust). |
| Page: 1 2 3 4 5 6 7 8 9 |
| GO ID | Tissue | Disease Stage | Description | Gene Ratio | Bg Ratio | pvalue | p.adjust | Count |
| GO:003109818 | Esophagus | ESCC | stress-activated protein kinase signaling cascade | 154/8552 | 247/18723 | 8.53e-08 | 1.44e-06 | 154 |
| GO:005140318 | Esophagus | ESCC | stress-activated MAPK cascade | 147/8552 | 239/18723 | 5.43e-07 | 7.18e-06 | 147 |
| GO:007030217 | Esophagus | ESCC | regulation of stress-activated protein kinase signaling cascade | 119/8552 | 195/18723 | 1.07e-05 | 1.01e-04 | 119 |
| GO:003287217 | Esophagus | ESCC | regulation of stress-activated MAPK cascade | 116/8552 | 192/18723 | 2.63e-05 | 2.21e-04 | 116 |
| GO:00072549 | Esophagus | ESCC | JNK cascade | 102/8552 | 167/18723 | 4.22e-05 | 3.39e-04 | 102 |
| GO:00463289 | Esophagus | ESCC | regulation of JNK cascade | 80/8552 | 133/18723 | 5.35e-04 | 2.95e-03 | 80 |
| GO:00703046 | Esophagus | ESCC | positive regulation of stress-activated protein kinase signaling cascade | 74/8552 | 128/18723 | 3.77e-03 | 1.53e-02 | 74 |
| GO:00328745 | Esophagus | ESCC | positive regulation of stress-activated MAPK cascade | 72/8552 | 126/18723 | 6.24e-03 | 2.29e-02 | 72 |
| GO:01201624 | Esophagus | ESCC | positive regulation of cold-induced thermogenesis | 57/8552 | 97/18723 | 6.43e-03 | 2.35e-02 | 57 |
| GO:00463302 | Esophagus | ESCC | positive regulation of JNK cascade | 52/8552 | 89/18723 | 1.04e-02 | 3.56e-02 | 52 |
| GO:01061066 | Esophagus | ESCC | cold-induced thermogenesis | 80/8552 | 144/18723 | 1.07e-02 | 3.65e-02 | 80 |
| GO:01201616 | Esophagus | ESCC | regulation of cold-induced thermogenesis | 80/8552 | 144/18723 | 1.07e-02 | 3.65e-02 | 80 |
| GO:003109822 | Liver | HCC | stress-activated protein kinase signaling cascade | 138/7958 | 247/18723 | 1.43e-05 | 1.57e-04 | 138 |
| GO:005140322 | Liver | HCC | stress-activated MAPK cascade | 134/7958 | 239/18723 | 1.50e-05 | 1.64e-04 | 134 |
| GO:007030222 | Liver | HCC | regulation of stress-activated protein kinase signaling cascade | 105/7958 | 195/18723 | 8.79e-04 | 5.20e-03 | 105 |
| GO:003287222 | Liver | HCC | regulation of stress-activated MAPK cascade | 102/7958 | 192/18723 | 1.86e-03 | 9.49e-03 | 102 |
| GO:000725412 | Liver | HCC | JNK cascade | 89/7958 | 167/18723 | 3.09e-03 | 1.44e-02 | 89 |
| GO:010610611 | Liver | HCC | cold-induced thermogenesis | 76/7958 | 144/18723 | 8.07e-03 | 3.18e-02 | 76 |
| GO:012016111 | Liver | HCC | regulation of cold-induced thermogenesis | 76/7958 | 144/18723 | 8.07e-03 | 3.18e-02 | 76 |
| GO:199084511 | Liver | HCC | adaptive thermogenesis | 81/7958 | 157/18723 | 1.32e-02 | 4.72e-02 | 81 |
| Page: 1 2 3 4 5 |
| Pathway ID | Tissue | Disease Stage | Description | Gene Ratio | Bg Ratio | pvalue | p.adjust | qvalue | Count |
| hsa052026 | Lung | IAC | Transcriptional misregulation in cancer | 40/1053 | 193/8465 | 6.90e-04 | 5.90e-03 | 3.92e-03 | 40 |
| hsa042107 | Lung | IAC | Apoptosis | 30/1053 | 136/8465 | 1.11e-03 | 7.82e-03 | 5.19e-03 | 30 |
| hsa052168 | Lung | IAC | Thyroid cancer | 12/1053 | 37/8465 | 1.21e-03 | 8.24e-03 | 5.47e-03 | 12 |
| hsa040686 | Lung | IAC | FoxO signaling pathway | 29/1053 | 131/8465 | 1.25e-03 | 8.24e-03 | 5.47e-03 | 29 |
| hsa052225 | Lung | IAC | Small cell lung cancer | 22/1053 | 92/8465 | 1.66e-03 | 9.66e-03 | 6.41e-03 | 22 |
| hsa0516916 | Lung | IAC | Epstein-Barr virus infection | 40/1053 | 202/8465 | 1.72e-03 | 9.66e-03 | 6.41e-03 | 40 |
| hsa052127 | Lung | IAC | Pancreatic cancer | 19/1053 | 76/8465 | 1.95e-03 | 1.05e-02 | 7.00e-03 | 19 |
| hsa052146 | Lung | IAC | Glioma | 18/1053 | 75/8465 | 4.07e-03 | 1.94e-02 | 1.29e-02 | 18 |
| hsa052209 | Lung | IAC | Chronic myeloid leukemia | 18/1053 | 76/8465 | 4.73e-03 | 2.15e-02 | 1.43e-02 | 18 |
| hsa052259 | Lung | IAC | Hepatocellular carcinoma | 33/1053 | 168/8465 | 4.77e-03 | 2.15e-02 | 1.43e-02 | 33 |
| hsa052233 | Lung | IAC | Non-small cell lung cancer | 17/1053 | 72/8465 | 6.15e-03 | 2.60e-02 | 1.72e-02 | 17 |
| hsa041105 | Lung | IAC | Cell cycle | 30/1053 | 157/8465 | 1.03e-02 | 3.83e-02 | 2.54e-02 | 30 |
| hsa0421813 | Lung | IAC | Cellular senescence | 40/1053 | 156/8465 | 4.44e-06 | 1.44e-04 | 9.59e-05 | 40 |
| hsa0401011 | Lung | IAC | MAPK signaling pathway | 62/1053 | 302/8465 | 3.54e-05 | 6.38e-04 | 4.24e-04 | 62 |
| hsa0521013 | Lung | IAC | Colorectal cancer | 24/1053 | 86/8465 | 8.58e-05 | 1.21e-03 | 8.05e-04 | 24 |
| hsa0521312 | Lung | IAC | Endometrial cancer | 18/1053 | 58/8465 | 1.50e-04 | 1.87e-03 | 1.24e-03 | 18 |
| hsa0520211 | Lung | IAC | Transcriptional misregulation in cancer | 40/1053 | 193/8465 | 6.90e-04 | 5.90e-03 | 3.92e-03 | 40 |
| hsa0421012 | Lung | IAC | Apoptosis | 30/1053 | 136/8465 | 1.11e-03 | 7.82e-03 | 5.19e-03 | 30 |
| hsa0521613 | Lung | IAC | Thyroid cancer | 12/1053 | 37/8465 | 1.21e-03 | 8.24e-03 | 5.47e-03 | 12 |
| hsa0406811 | Lung | IAC | FoxO signaling pathway | 29/1053 | 131/8465 | 1.25e-03 | 8.24e-03 | 5.47e-03 | 29 |
| Page: 1 2 3 4 5 6 7 8 9 10 |
Top |
Cell-cell communication analysis |
| Identification of potential cell-cell interactions between two cell types and their ligand-receptor pairs for different disease states |
| Ligand | Receptor | LRpair | Pathway | Tissue | Disease Stage |
| Page: 1 |
Top |
Single-cell gene regulatory network inference analysis |
| Find out the significant the regulons (TFs) and the target genes of each regulon across cell types for different disease states |
| TF | Cell Type | Tissue | Disease Stage | Target Gene | RSS | Regulon Activity |
| ∗The dot plots of a searched regulon are shown for all cell subpopulations in each disease state of each tissue based on the regulon specific score inferred using pySCENIC and by calculating the average expression. |
| Page: 1 |
Top |
Somatic mutation of malignant transformation related genes |
| Annotation of somatic variants for genes involved in malignant transformation |
| Hugo Symbol | Variant Class | Variant Classification | dbSNP RS | HGVSc | HGVSp | HGVSp Short | SWISSPROT | BIOTYPE | SIFT | PolyPhen | Tumor Sample Barcode | Tissue | Histology | Sex | Age | Stage | Therapy Types | Drugs | Outcome |
| GADD45G | insertion | In_Frame_Ins | novel | c.323_324insTGCCAC | p.Gly108_Glu109insAlaThr | p.G108_E109insAT | O95257 | protein_coding | TCGA-AN-A0FN-01 | Breast | breast invasive carcinoma | Female | <65 | I/II | Unknown | Unknown | SD | ||
| GADD45G | insertion | Frame_Shift_Ins | novel | c.325_326insCACTCCAGCCTGGGCA | p.Glu109AlafsTer46 | p.E109Afs*46 | O95257 | protein_coding | TCGA-AN-A0FN-01 | Breast | breast invasive carcinoma | Female | <65 | I/II | Unknown | Unknown | SD | ||
| GADD45G | SNV | Missense_Mutation | novel | c.250T>G | p.Phe84Val | p.F84V | O95257 | protein_coding | deleterious(0) | probably_damaging(0.998) | TCGA-CA-6717-01 | Colorectum | colon adenocarcinoma | Male | <65 | I/II | Chemotherapy | oxaliplatin | CR |
| GADD45G | SNV | Missense_Mutation | c.261G>T | p.Glu87Asp | p.E87D | O95257 | protein_coding | tolerated(0.93) | benign(0) | TCGA-AP-A056-01 | Endometrium | uterine corpus endometrioid carcinoma | Female | <65 | I/II | Unknown | Unknown | SD | |
| GADD45G | SNV | Missense_Mutation | novel | c.408N>T | p.Glu136Asp | p.E136D | O95257 | protein_coding | tolerated(0.23) | benign(0.001) | TCGA-AX-A2HC-01 | Endometrium | uterine corpus endometrioid carcinoma | Female | <65 | III/IV | Chemotherapy | paclitaxel | PD |
| GADD45G | SNV | Missense_Mutation | novel | c.353A>C | p.His118Pro | p.H118P | O95257 | protein_coding | deleterious(0) | possibly_damaging(0.664) | TCGA-3K-AAZ8-01 | Liver | liver hepatocellular carcinoma | Male | >=65 | III/IV | Targeted Molecular therapy | sorafenib | PD |
| GADD45G | SNV | Missense_Mutation | c.212N>G | p.Asp71Gly | p.D71G | O95257 | protein_coding | deleterious(0) | probably_damaging(0.999) | TCGA-44-7671-01 | Lung | lung adenocarcinoma | Male | <65 | I/II | Unknown | Unknown | PD | |
| GADD45G | SNV | Missense_Mutation | novel | c.19C>A | p.Arg7Ser | p.R7S | O95257 | protein_coding | tolerated(0.43) | benign(0.007) | TCGA-58-A46M-01 | Lung | lung squamous cell carcinoma | Male | <65 | I/II | Unknown | Unknown | SD |
| GADD45G | SNV | Missense_Mutation | novel | c.431A>C | p.Glu144Ala | p.E144A | O95257 | protein_coding | deleterious(0.01) | probably_damaging(0.997) | TCGA-BA-5151-01 | Oral cavity | head & neck squamous cell carcinoma | Male | >=65 | I/II | Unknown | Unknown | PD |
| GADD45G | SNV | Missense_Mutation | novel | c.395A>G | p.Asp132Gly | p.D132G | O95257 | protein_coding | tolerated(0.05) | possibly_damaging(0.872) | TCGA-VQ-A91K-01 | Stomach | stomach adenocarcinoma | Male | >=65 | III/IV | Chemotherapy | fluorouracil | CR |
| Page: 1 |
Top |
Related drugs of malignant transformation related genes |
| Identification of chemicals and drugs interact with genes involved in malignant transfromation |
| (DGIdb 4.0) |
| Entrez ID | Symbol | Category | Interaction Types | Drug Claim Name | Drug Name | PMIDs |
| 10912 | GADD45G | KINASE, TUMOR SUPPRESSOR | ANDROGENS | 15062559 |
| Page: 1 |

Copyright 2023-Present -The University of Texas Health Science Center at Houston |