
|
|||||
|
 | |
| |
| |
| |
| |
| |
|
Gene: CAMK2D |
Gene summary for CAMK2D |
| Gene information | Species | Human | Gene symbol | CAMK2D | Gene ID | 817 |
| Gene name | calcium/calmodulin dependent protein kinase II delta | |
| Gene Alias | CAMKD | |
| Cytomap | 4q26 | |
| Gene Type | protein-coding | GO ID | GO:0001508 | UniProtAcc | A0A024RDK3 |
Top |
Malignant transformation analysis |
| Identification of the aberrant gene expression in precancerous and cancerous lesions by comparing the gene expression of stem-like cells in diseased tissues with normal stem cells |
| Entrez ID | Symbol | Replicates | Species | Organ | Tissue | Adj P-value | Log2FC | Malignancy |
| 817 | CAMK2D | CCI_1 | Human | Cervix | CC | 1.60e-11 | 1.63e+00 | 0.528 |
| 817 | CAMK2D | CCI_2 | Human | Cervix | CC | 9.00e-03 | 7.70e-01 | 0.5249 |
| 817 | CAMK2D | CCI_3 | Human | Cervix | CC | 5.22e-06 | 8.41e-01 | 0.516 |
| 817 | CAMK2D | Tumor | Human | Cervix | CC | 4.43e-02 | 1.30e-01 | 0.1241 |
| 817 | CAMK2D | sample3 | Human | Cervix | CC | 1.72e-03 | 2.08e-01 | 0.1387 |
| 817 | CAMK2D | T3 | Human | Cervix | CC | 7.28e-05 | 1.58e-01 | 0.1389 |
| 817 | CAMK2D | HTA11_3410_2000001011 | Human | Colorectum | AD | 3.63e-25 | -6.71e-01 | 0.0155 |
| 817 | CAMK2D | HTA11_2951_2000001011 | Human | Colorectum | AD | 1.18e-02 | -7.16e-01 | 0.0216 |
| 817 | CAMK2D | HTA11_347_2000001011 | Human | Colorectum | AD | 2.20e-15 | 7.65e-01 | -0.1954 |
| 817 | CAMK2D | HTA11_411_2000001011 | Human | Colorectum | SER | 6.69e-07 | 8.66e-01 | -0.2602 |
| 817 | CAMK2D | HTA11_9341_2000001011 | Human | Colorectum | SER | 2.02e-02 | -6.78e-01 | -0.00410000000000005 |
| 817 | CAMK2D | HTA11_866_3004761011 | Human | Colorectum | AD | 2.98e-19 | -6.80e-01 | 0.096 |
| 817 | CAMK2D | HTA11_9408_2000001011 | Human | Colorectum | AD | 1.01e-03 | -6.93e-01 | 0.0451 |
| 817 | CAMK2D | HTA11_8622_2000001021 | Human | Colorectum | SER | 1.44e-09 | -7.34e-01 | 0.0528 |
| 817 | CAMK2D | HTA11_10711_2000001011 | Human | Colorectum | AD | 6.45e-04 | -5.07e-01 | 0.0338 |
| 817 | CAMK2D | HTA11_7696_3000711011 | Human | Colorectum | AD | 7.91e-30 | -6.21e-01 | 0.0674 |
| 817 | CAMK2D | HTA11_11156_2000001011 | Human | Colorectum | AD | 8.19e-06 | -1.01e+00 | 0.0397 |
| 817 | CAMK2D | HTA11_6818_2000001021 | Human | Colorectum | AD | 5.61e-04 | -4.95e-01 | 0.0588 |
| 817 | CAMK2D | HTA11_99999970781_79442 | Human | Colorectum | MSS | 9.33e-21 | -5.53e-01 | 0.294 |
| 817 | CAMK2D | HTA11_99999971662_82457 | Human | Colorectum | MSS | 4.67e-24 | -6.44e-01 | 0.3859 |
| Page: 1 2 3 4 5 6 7 8 9 10 11 12 |
| Tissue | Expression Dynamics | Abbreviation |
| Cervix | 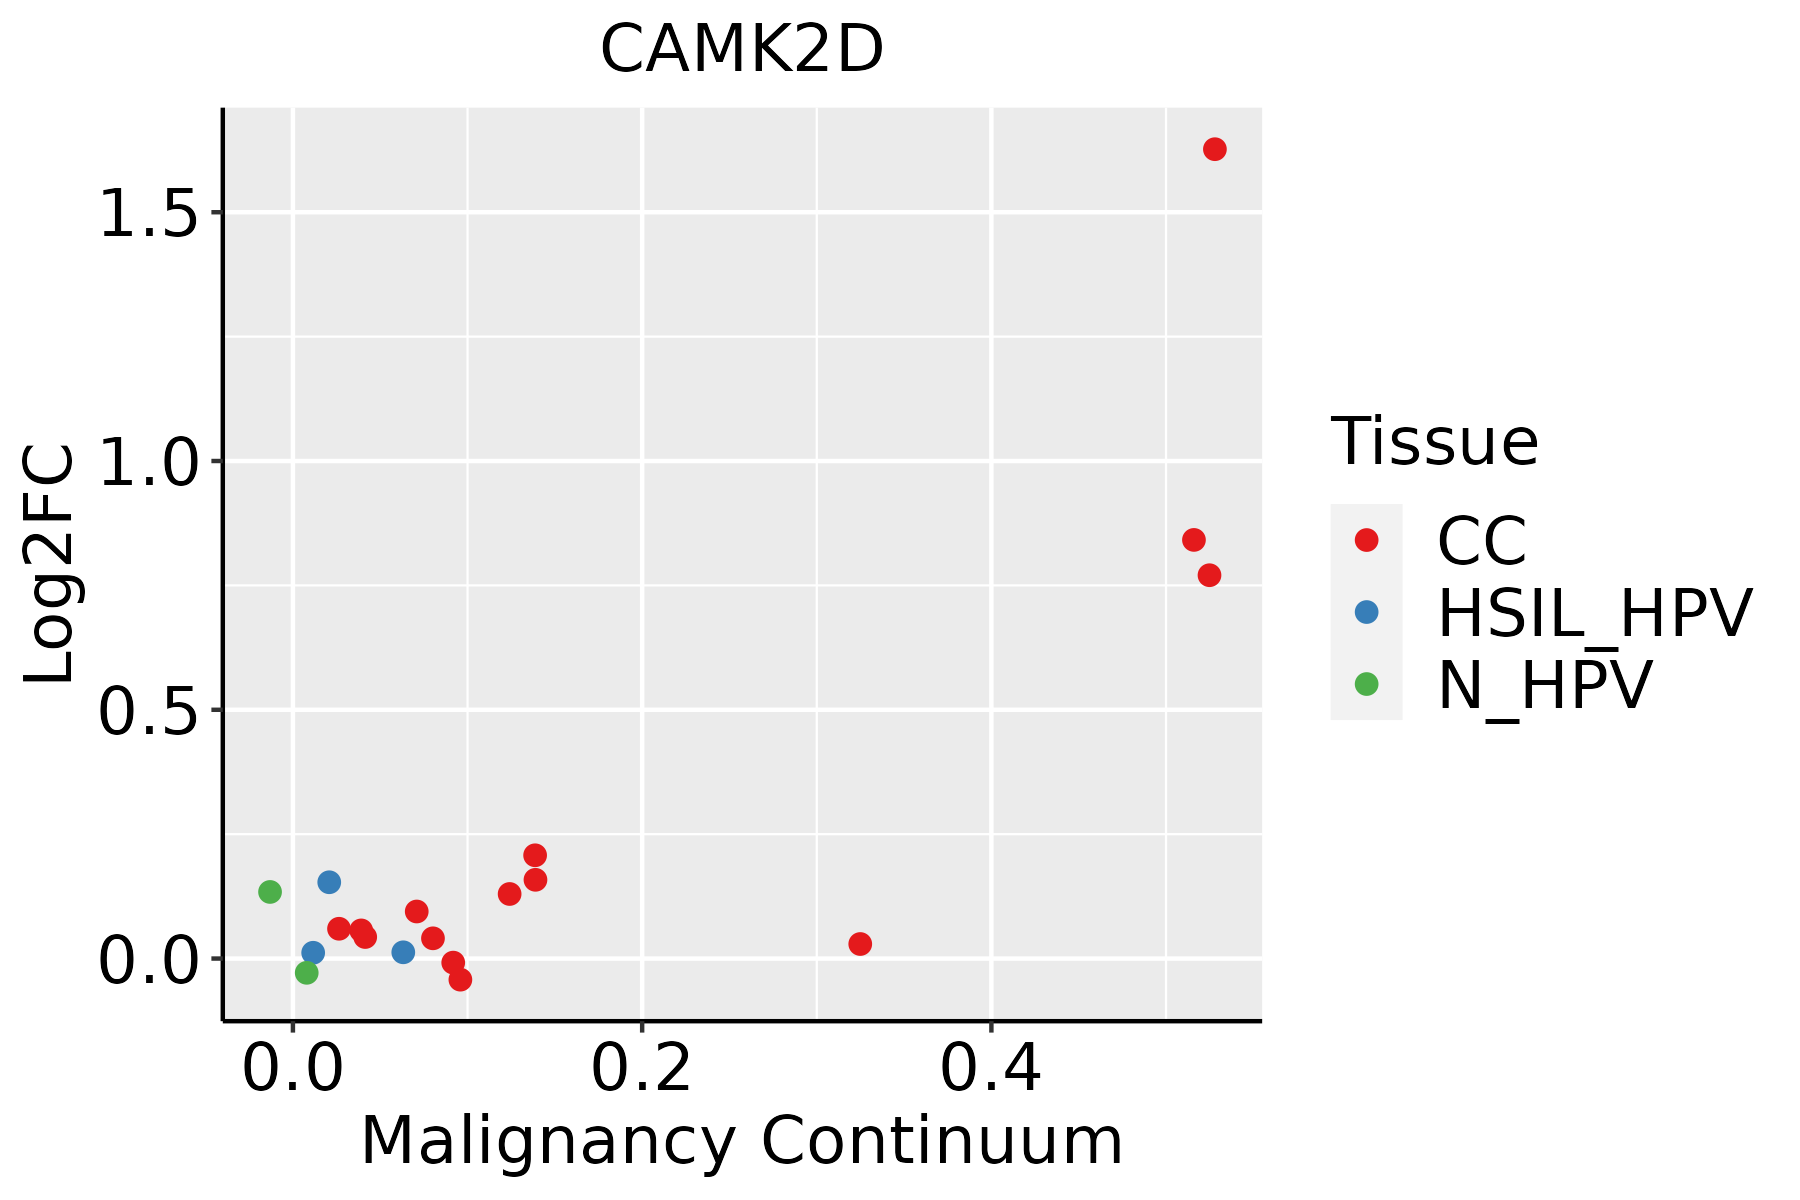 | CC: Cervix cancer |
| HSIL_HPV: HPV-infected high-grade squamous intraepithelial lesions | ||
| N_HPV: HPV-infected normal cervix | ||
| Colorectum (GSE201348) |  | FAP: Familial adenomatous polyposis |
| CRC: Colorectal cancer | ||
| Colorectum (HTA11) |  | AD: Adenomas |
| SER: Sessile serrated lesions | ||
| MSI-H: Microsatellite-high colorectal cancer | ||
| MSS: Microsatellite stable colorectal cancer | ||
| Endometrium |  | AEH: Atypical endometrial hyperplasia |
| EEC: Endometrioid Cancer | ||
| Esophagus |  | ESCC: Esophageal squamous cell carcinoma |
| HGIN: High-grade intraepithelial neoplasias | ||
| LGIN: Low-grade intraepithelial neoplasias | ||
| GC |  | CAG: Chronic atrophic gastritis |
| CAG with IM: Chronic atrophic gastritis with intestinal metaplasia | ||
| CSG: Chronic superficial gastritis | ||
| GC: Gastric cancer | ||
| SIM: Severe intestinal metaplasia | ||
| WIM: Wild intestinal metaplasia | ||
| Liver |  | HCC: Hepatocellular carcinoma |
| NAFLD: Non-alcoholic fatty liver disease | ||
| Lung |  | AAH: Atypical adenomatous hyperplasia |
| AIS: Adenocarcinoma in situ | ||
| IAC: Invasive lung adenocarcinoma | ||
| MIA: Minimally invasive adenocarcinoma | ||
| Oral Cavity |  | EOLP: Erosive Oral lichen planus |
| LP: leukoplakia | ||
| NEOLP: Non-erosive oral lichen planus | ||
| OSCC: Oral squamous cell carcinoma | ||
| Prostate | 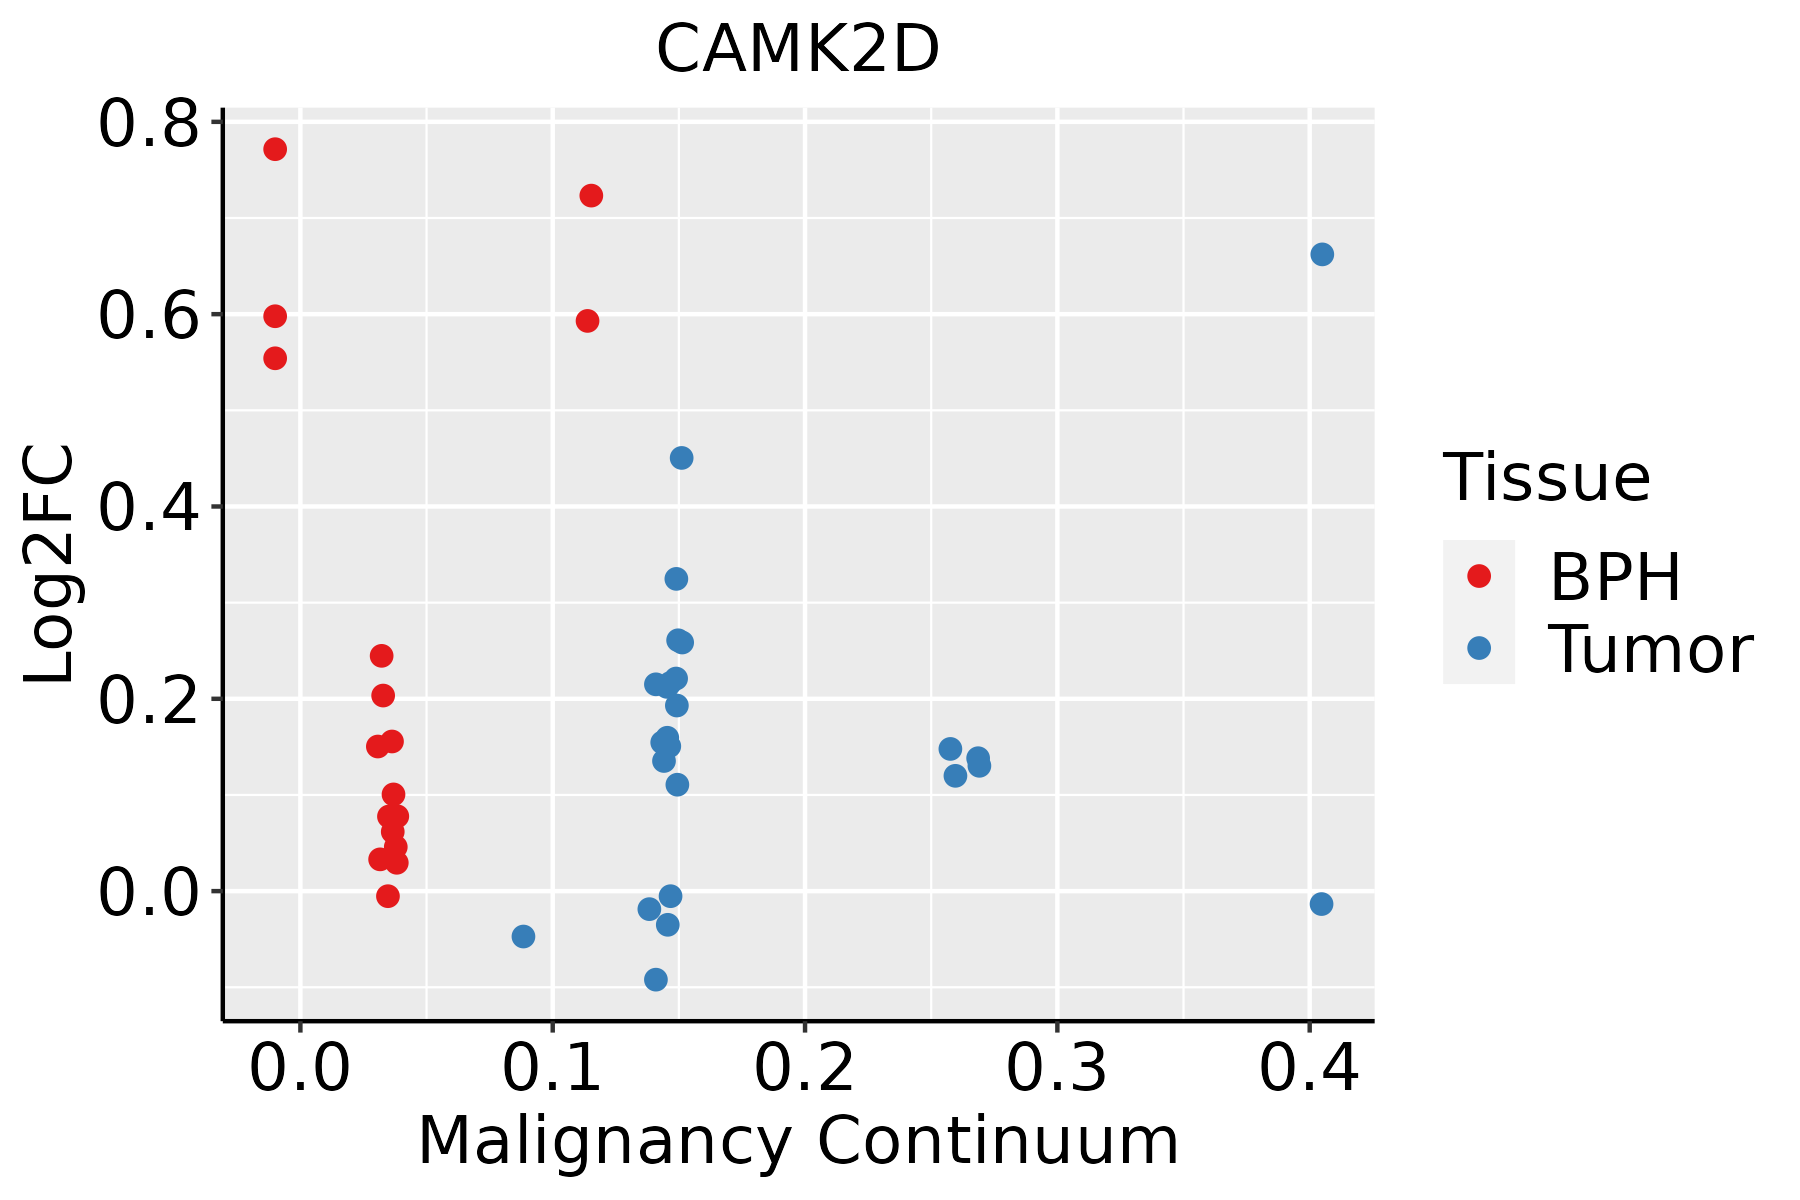 | BPH: Benign Prostatic Hyperplasia |
| Thyroid | 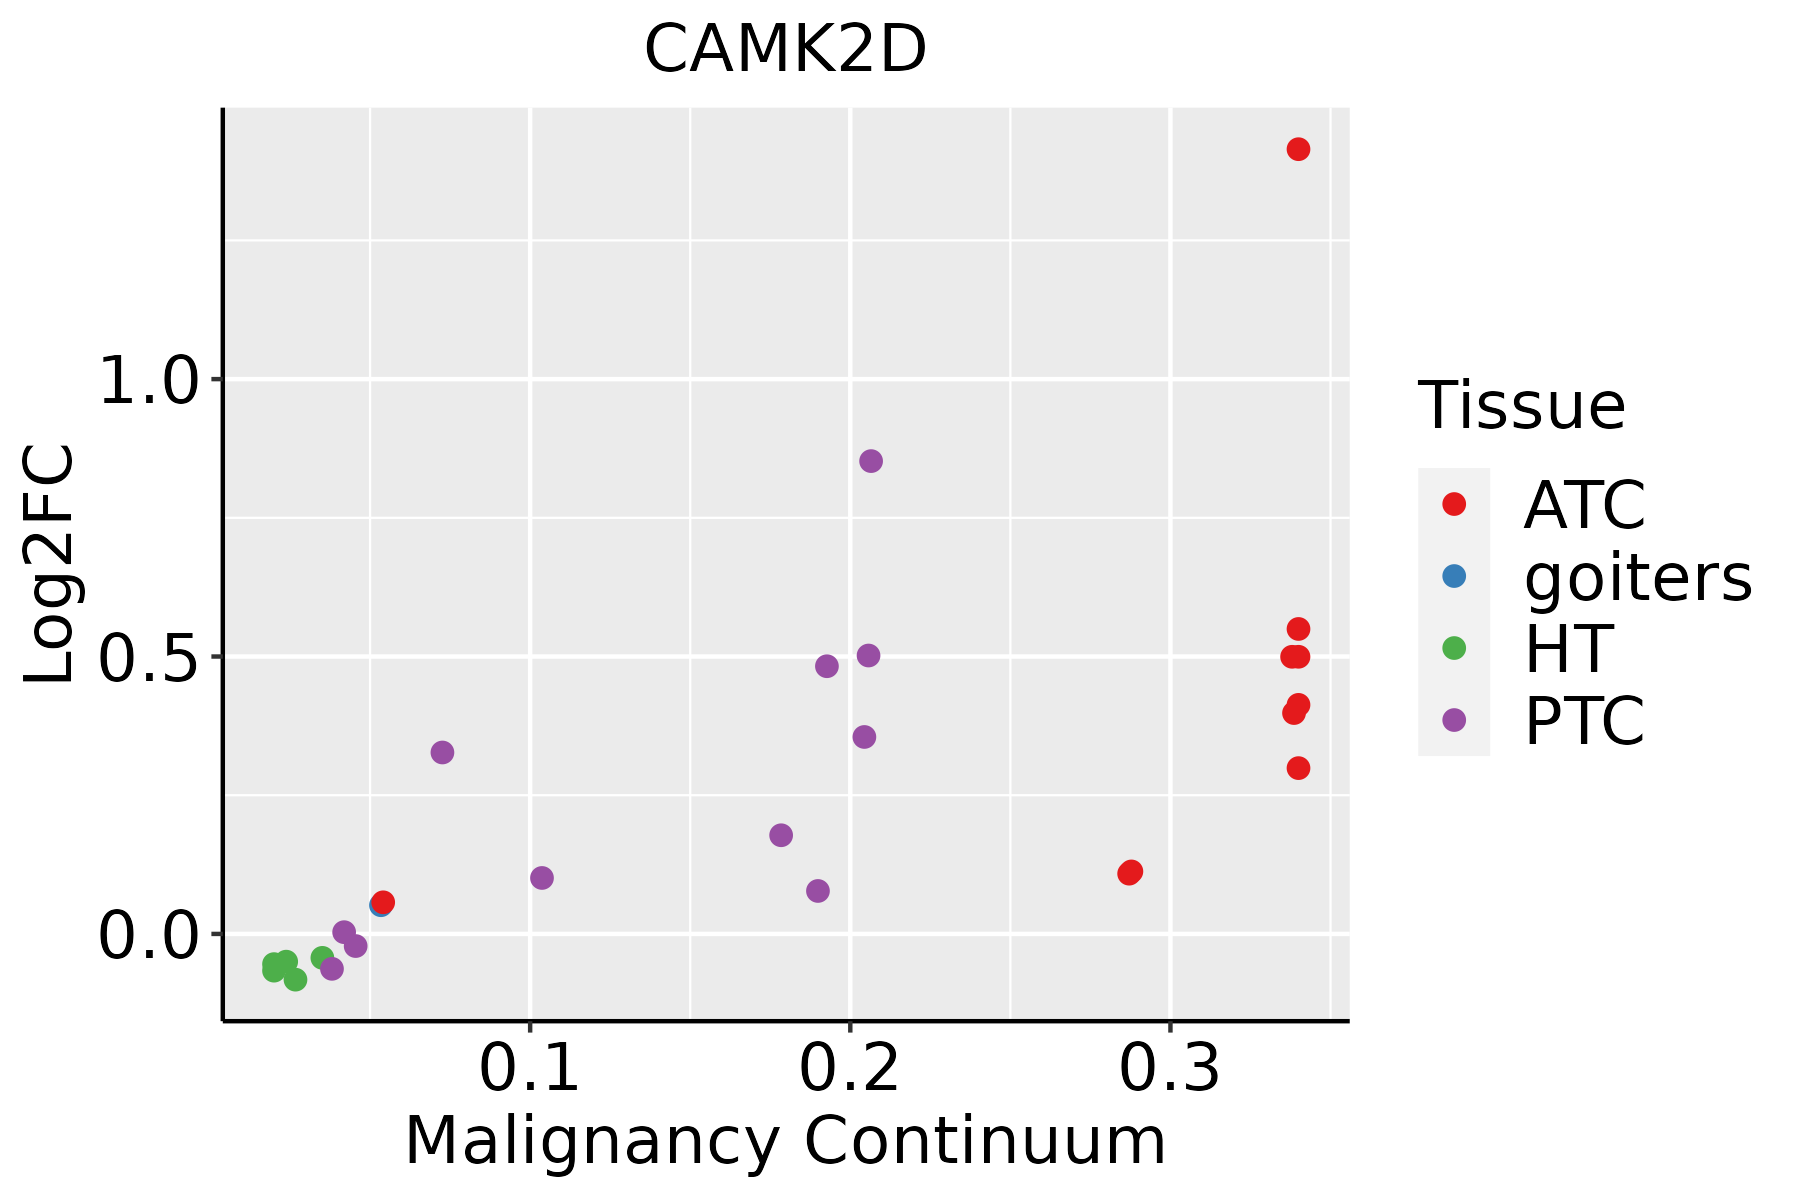 | ATC: Anaplastic thyroid cancer |
| HT: Hashimoto's thyroiditis | ||
| PTC: Papillary thyroid cancer |
| ∗log2FC in expression of this searched gene in stem-like cells from each diseased tissue sample relative to stem-like cells in normal samples in each tissue plotted against the malignancy continuum. Samples are colored based on if they are from different disease stage. |
Top |
Malignant transformation related pathway analysis |
| Find out the enriched GO biological processes and KEGG pathways involved in transition from healthy to precancer to cancer |
| Tissue | Disease Stage | Enriched GO biological Processes |
| Colorectum | AD |  |
| Colorectum | SER |  |
| Colorectum | MSS |  |
| Colorectum | MSI-H |  |
| Colorectum | FAP |  |
| ∗Top 15 enriched GO BP terms are showed in the bar plot of each disease state in each tissue. Each row represents a significant GO biological process which is colored according to the -log10(p.adjust). |
| Page: 1 2 3 4 5 6 7 8 9 |
| GO ID | Tissue | Disease Stage | Description | Gene Ratio | Bg Ratio | pvalue | p.adjust | Count |
| GO:003297010 | Cervix | CC | regulation of actin filament-based process | 96/2311 | 397/18723 | 4.00e-11 | 8.54e-09 | 96 |
| GO:00512359 | Cervix | CC | maintenance of location | 78/2311 | 327/18723 | 5.18e-09 | 4.92e-07 | 78 |
| GO:005165110 | Cervix | CC | maintenance of location in cell | 55/2311 | 214/18723 | 6.63e-08 | 3.85e-06 | 55 |
| GO:00160498 | Cervix | CC | cell growth | 92/2311 | 482/18723 | 1.16e-05 | 2.49e-04 | 92 |
| GO:00181057 | Cervix | CC | peptidyl-serine phosphorylation | 63/2311 | 315/18723 | 6.65e-05 | 9.47e-04 | 63 |
| GO:00182096 | Cervix | CC | peptidyl-serine modification | 66/2311 | 338/18723 | 9.58e-05 | 1.25e-03 | 66 |
| GO:00015588 | Cervix | CC | regulation of cell growth | 77/2311 | 414/18723 | 1.40e-04 | 1.70e-03 | 77 |
| GO:00165705 | Cervix | CC | histone modification | 84/2311 | 463/18723 | 1.70e-04 | 2.01e-03 | 84 |
| GO:00106444 | Cervix | CC | cell communication by electrical coupling | 12/2311 | 32/18723 | 2.53e-04 | 2.79e-03 | 12 |
| GO:00106494 | Cervix | CC | regulation of cell communication by electrical coupling | 8/2311 | 16/18723 | 2.73e-04 | 2.99e-03 | 8 |
| GO:19023059 | Cervix | CC | regulation of sodium ion transmembrane transport | 19/2311 | 68/18723 | 4.21e-04 | 4.25e-03 | 19 |
| GO:00324698 | Cervix | CC | endoplasmic reticulum calcium ion homeostasis | 10/2311 | 25/18723 | 4.52e-04 | 4.49e-03 | 10 |
| GO:00300487 | Cervix | CC | actin filament-based movement | 29/2311 | 127/18723 | 6.91e-04 | 6.33e-03 | 29 |
| GO:00310565 | Cervix | CC | regulation of histone modification | 33/2311 | 152/18723 | 7.97e-04 | 7.00e-03 | 33 |
| GO:19018446 | Cervix | CC | regulation of cell communication by electrical coupling involved in cardiac conduction | 6/2311 | 11/18723 | 9.33e-04 | 7.86e-03 | 6 |
| GO:001003810 | Cervix | CC | response to metal ion | 67/2311 | 373/18723 | 9.67e-04 | 8.10e-03 | 67 |
| GO:00860644 | Cervix | CC | cell communication by electrical coupling involved in cardiac conduction | 9/2311 | 25/18723 | 2.09e-03 | 1.52e-02 | 9 |
| GO:00515926 | Cervix | CC | response to calcium ion | 31/2311 | 149/18723 | 2.31e-03 | 1.65e-02 | 31 |
| GO:00020288 | Cervix | CC | regulation of sodium ion transport | 21/2311 | 90/18723 | 2.71e-03 | 1.85e-02 | 21 |
| GO:00551192 | Cervix | CC | relaxation of cardiac muscle | 7/2311 | 17/18723 | 2.72e-03 | 1.85e-02 | 7 |
| Page: 1 2 3 4 5 6 7 8 9 10 11 12 13 14 15 16 17 18 19 20 21 22 23 24 25 26 27 28 29 30 31 32 33 34 35 36 37 |
| Pathway ID | Tissue | Disease Stage | Description | Gene Ratio | Bg Ratio | pvalue | p.adjust | qvalue | Count |
| hsa04713 | Colorectum | MSS | Circadian entrainment | 32/1875 | 97/8465 | 8.84e-03 | 3.25e-02 | 1.99e-02 | 32 |
| hsa043602 | Colorectum | MSS | Axon guidance | 54/1875 | 182/8465 | 1.03e-02 | 3.69e-02 | 2.26e-02 | 54 |
| hsa04725 | Colorectum | MSS | Cholinergic synapse | 36/1875 | 113/8465 | 1.05e-02 | 3.69e-02 | 2.26e-02 | 36 |
| hsa050125 | Colorectum | MSS | Parkinson disease | 140/1875 | 266/8465 | 2.32e-28 | 7.79e-26 | 4.77e-26 | 140 |
| hsa054155 | Colorectum | MSS | Diabetic cardiomyopathy | 106/1875 | 203/8465 | 2.47e-21 | 1.62e-19 | 9.92e-20 | 106 |
| hsa050225 | Colorectum | MSS | Pathways of neurodegeneration - multiple diseases | 192/1875 | 476/8465 | 2.79e-20 | 1.04e-18 | 6.36e-19 | 192 |
| hsa047225 | Colorectum | MSS | Neurotrophin signaling pathway | 45/1875 | 119/8465 | 7.04e-05 | 6.55e-04 | 4.02e-04 | 45 |
| hsa054175 | Colorectum | MSS | Lipid and atherosclerosis | 70/1875 | 215/8465 | 2.38e-04 | 1.81e-03 | 1.11e-03 | 70 |
| hsa049125 | Colorectum | MSS | GnRH signaling pathway | 35/1875 | 93/8465 | 4.81e-04 | 3.43e-03 | 2.10e-03 | 35 |
| hsa049225 | Colorectum | MSS | Glucagon signaling pathway | 39/1875 | 107/8465 | 5.00e-04 | 3.45e-03 | 2.11e-03 | 39 |
| hsa040665 | Colorectum | MSS | HIF-1 signaling pathway | 39/1875 | 109/8465 | 7.61e-04 | 5.00e-03 | 3.06e-03 | 39 |
| hsa052055 | Colorectum | MSS | Proteoglycans in cancer | 65/1875 | 205/8465 | 8.66e-04 | 5.38e-03 | 3.29e-03 | 65 |
| hsa047285 | Colorectum | MSS | Dopaminergic synapse | 45/1875 | 132/8465 | 1.02e-03 | 5.94e-03 | 3.64e-03 | 45 |
| hsa040123 | Colorectum | MSS | ErbB signaling pathway | 30/1875 | 85/8465 | 3.73e-03 | 1.67e-02 | 1.02e-02 | 30 |
| hsa043103 | Colorectum | MSS | Wnt signaling pathway | 53/1875 | 171/8465 | 4.24e-03 | 1.86e-02 | 1.14e-02 | 53 |
| hsa049715 | Colorectum | MSS | Gastric acid secretion | 27/1875 | 76/8465 | 5.20e-03 | 2.18e-02 | 1.34e-02 | 27 |
| hsa047205 | Colorectum | MSS | Long-term potentiation | 24/1875 | 67/8465 | 7.27e-03 | 2.83e-02 | 1.73e-02 | 24 |
| hsa047131 | Colorectum | MSS | Circadian entrainment | 32/1875 | 97/8465 | 8.84e-03 | 3.25e-02 | 1.99e-02 | 32 |
| hsa043603 | Colorectum | MSS | Axon guidance | 54/1875 | 182/8465 | 1.03e-02 | 3.69e-02 | 2.26e-02 | 54 |
| hsa047251 | Colorectum | MSS | Cholinergic synapse | 36/1875 | 113/8465 | 1.05e-02 | 3.69e-02 | 2.26e-02 | 36 |
| Page: 1 2 3 4 5 6 7 8 9 10 11 12 13 14 15 16 17 18 19 20 21 22 23 24 25 26 27 |
Top |
Cell-cell communication analysis |
| Identification of potential cell-cell interactions between two cell types and their ligand-receptor pairs for different disease states |
| Ligand | Receptor | LRpair | Pathway | Tissue | Disease Stage |
| Page: 1 |
Top |
Single-cell gene regulatory network inference analysis |
| Find out the significant the regulons (TFs) and the target genes of each regulon across cell types for different disease states |
| TF | Cell Type | Tissue | Disease Stage | Target Gene | RSS | Regulon Activity |
| ∗The dot plots of a searched regulon are shown for all cell subpopulations in each disease state of each tissue based on the regulon specific score inferred using pySCENIC and by calculating the average expression. |
| Page: 1 |
Top |
Somatic mutation of malignant transformation related genes |
| Annotation of somatic variants for genes involved in malignant transformation |
| Hugo Symbol | Variant Class | Variant Classification | dbSNP RS | HGVSc | HGVSp | HGVSp Short | SWISSPROT | BIOTYPE | SIFT | PolyPhen | Tumor Sample Barcode | Tissue | Histology | Sex | Age | Stage | Therapy Types | Drugs | Outcome |
| CAMK2D | SNV | Missense_Mutation | novel | c.709N>A | p.Glu237Lys | p.E237K | protein_coding | deleterious_low_confidence(0) | probably_damaging(0.998) | TCGA-5L-AAT1-01 | Breast | breast invasive carcinoma | Female | <65 | III/IV | Hormone Therapy | letrozol | SD | |
| CAMK2D | SNV | Missense_Mutation | c.911T>C | p.Ile304Thr | p.I304T | protein_coding | deleterious_low_confidence(0) | probably_damaging(0.953) | TCGA-AN-A0G0-01 | Breast | breast invasive carcinoma | Female | <65 | I/II | Unknown | Unknown | SD | ||
| CAMK2D | SNV | Missense_Mutation | c.1514N>A | p.Gly505Glu | p.G505E | protein_coding | deleterious_low_confidence(0.03) | possibly_damaging(0.597) | TCGA-B6-A0RG-01 | Breast | breast invasive carcinoma | Female | <65 | I/II | Unknown | Unknown | SD | ||
| CAMK2D | insertion | Frame_Shift_Ins | novel | c.70dupG | p.Ala24GlyfsTer30 | p.A24Gfs*30 | protein_coding | TCGA-BH-A18G-01 | Breast | breast invasive carcinoma | Female | >=65 | I/II | Unknown | Unknown | SD | |||
| CAMK2D | deletion | Frame_Shift_Del | novel | c.1417delN | p.Asp473MetfsTer64 | p.D473Mfs*64 | protein_coding | TCGA-EW-A2FV-01 | Breast | breast invasive carcinoma | Female | <65 | III/IV | Chemotherapy | docetaxel | SD | |||
| CAMK2D | SNV | Missense_Mutation | c.920C>T | p.Thr307Ile | p.T307I | protein_coding | deleterious_low_confidence(0.01) | possibly_damaging(0.675) | TCGA-AA-3663-01 | Colorectum | colon adenocarcinoma | Male | <65 | I/II | Unknown | Unknown | SD | ||
| CAMK2D | SNV | Missense_Mutation | c.289N>C | p.Glu97Gln | p.E97Q | protein_coding | deleterious_low_confidence(0.01) | probably_damaging(0.999) | TCGA-AA-A02H-01 | Colorectum | colon adenocarcinoma | Female | >=65 | III/IV | Unknown | Unknown | PD | ||
| CAMK2D | SNV | Missense_Mutation | novel | c.1328C>G | p.Pro443Arg | p.P443R | protein_coding | deleterious_low_confidence(0.04) | probably_damaging(0.994) | TCGA-AA-A02R-01 | Colorectum | colon adenocarcinoma | Female | >=65 | I/II | Unknown | Unknown | PD | |
| CAMK2D | SNV | Missense_Mutation | novel | c.1327C>T | p.Pro443Ser | p.P443S | protein_coding | tolerated_low_confidence(0.1) | probably_damaging(0.991) | TCGA-AA-A02R-01 | Colorectum | colon adenocarcinoma | Female | >=65 | I/II | Unknown | Unknown | PD | |
| CAMK2D | SNV | Missense_Mutation | c.509N>T | p.Ala170Val | p.A170V | protein_coding | tolerated_low_confidence(0.08) | probably_damaging(0.999) | TCGA-DM-A1D7-01 | Colorectum | colon adenocarcinoma | Male | >=65 | I/II | Unknown | Unknown | PD |
| Page: 1 2 3 4 5 |
Top |
Related drugs of malignant transformation related genes |
| Identification of chemicals and drugs interact with genes involved in malignant transfromation |
| (DGIdb 4.0) |
| Entrez ID | Symbol | Category | Interaction Types | Drug Claim Name | Drug Name | PMIDs |
| 817 | CAMK2D | TRANSCRIPTION FACTOR, TRANSPORTER, ENZYME, ION CHANNEL, KINASE, SERINE THREONINE KINASE, DRUGGABLE GENOME | GEFITINIB | GEFITINIB | ||
| 817 | CAMK2D | TRANSCRIPTION FACTOR, TRANSPORTER, ENZYME, ION CHANNEL, KINASE, SERINE THREONINE KINASE, DRUGGABLE GENOME | GW441756X | GW441756X | ||
| 817 | CAMK2D | TRANSCRIPTION FACTOR, TRANSPORTER, ENZYME, ION CHANNEL, KINASE, SERINE THREONINE KINASE, DRUGGABLE GENOME | TAE-684 | TAE-684 | ||
| 817 | CAMK2D | TRANSCRIPTION FACTOR, TRANSPORTER, ENZYME, ION CHANNEL, KINASE, SERINE THREONINE KINASE, DRUGGABLE GENOME | SP-600125 | SP-600125 | ||
| 817 | CAMK2D | TRANSCRIPTION FACTOR, TRANSPORTER, ENZYME, ION CHANNEL, KINASE, SERINE THREONINE KINASE, DRUGGABLE GENOME | LY-2090314 | LY-2090314 | ||
| 817 | CAMK2D | TRANSCRIPTION FACTOR, TRANSPORTER, ENZYME, ION CHANNEL, KINASE, SERINE THREONINE KINASE, DRUGGABLE GENOME | LINIFANIB | LINIFANIB | ||
| 817 | CAMK2D | TRANSCRIPTION FACTOR, TRANSPORTER, ENZYME, ION CHANNEL, KINASE, SERINE THREONINE KINASE, DRUGGABLE GENOME | ILORASERTIB | ILORASERTIB | ||
| 817 | CAMK2D | TRANSCRIPTION FACTOR, TRANSPORTER, ENZYME, ION CHANNEL, KINASE, SERINE THREONINE KINASE, DRUGGABLE GENOME | SOTRASTAURIN | SOTRASTAURIN | ||
| 817 | CAMK2D | TRANSCRIPTION FACTOR, TRANSPORTER, ENZYME, ION CHANNEL, KINASE, SERINE THREONINE KINASE, DRUGGABLE GENOME | PF-562271 | PF-00562271 | ||
| 817 | CAMK2D | TRANSCRIPTION FACTOR, TRANSPORTER, ENZYME, ION CHANNEL, KINASE, SERINE THREONINE KINASE, DRUGGABLE GENOME | inhibitor | 249565838 |
| Page: 1 2 |

Copyright 2023-Present -The University of Texas Health Science Center at Houston |