
|
|||||
|
 | |
| |
| |
| |
| |
| |
|
Gene: CYCS |
Gene summary for CYCS |
| Gene information | Species | Human | Gene symbol | CYCS | Gene ID | 54205 |
| Gene name | cytochrome c, somatic | |
| Gene Alias | CYC | |
| Cytomap | 7p15.3 | |
| Gene Type | protein-coding | GO ID | GO:0006091 | UniProtAcc | G4XXL9 |
Top |
Malignant transformation analysis |
| Identification of the aberrant gene expression in precancerous and cancerous lesions by comparing the gene expression of stem-like cells in diseased tissues with normal stem cells |
| Entrez ID | Symbol | Replicates | Species | Organ | Tissue | Adj P-value | Log2FC | Malignancy |
| 54205 | CYCS | GSM4909277 | Human | Breast | Precancer | 1.17e-04 | 3.29e-01 | 0.0177 |
| 54205 | CYCS | GSM4909282 | Human | Breast | IDC | 8.97e-13 | 4.81e-01 | -0.0288 |
| 54205 | CYCS | GSM4909286 | Human | Breast | IDC | 7.36e-19 | -3.87e-01 | 0.1081 |
| 54205 | CYCS | GSM4909293 | Human | Breast | IDC | 2.35e-05 | -2.32e-01 | 0.1581 |
| 54205 | CYCS | GSM4909294 | Human | Breast | IDC | 2.89e-02 | -1.09e-01 | 0.2022 |
| 54205 | CYCS | GSM4909296 | Human | Breast | IDC | 5.18e-11 | -3.08e-01 | 0.1524 |
| 54205 | CYCS | GSM4909297 | Human | Breast | IDC | 2.50e-20 | -1.02e-01 | 0.1517 |
| 54205 | CYCS | GSM4909298 | Human | Breast | IDC | 3.16e-02 | -8.06e-02 | 0.1551 |
| 54205 | CYCS | GSM4909301 | Human | Breast | IDC | 6.51e-18 | -5.22e-01 | 0.1577 |
| 54205 | CYCS | GSM4909302 | Human | Breast | IDC | 3.95e-03 | -2.75e-01 | 0.1545 |
| 54205 | CYCS | GSM4909308 | Human | Breast | IDC | 2.77e-04 | 3.46e-01 | 0.158 |
| 54205 | CYCS | GSM4909309 | Human | Breast | IDC | 1.39e-02 | -2.52e-01 | 0.0483 |
| 54205 | CYCS | GSM4909311 | Human | Breast | IDC | 3.09e-44 | -6.21e-01 | 0.1534 |
| 54205 | CYCS | GSM4909312 | Human | Breast | IDC | 1.93e-19 | -4.14e-01 | 0.1552 |
| 54205 | CYCS | GSM4909313 | Human | Breast | IDC | 6.09e-14 | -4.21e-01 | 0.0391 |
| 54205 | CYCS | GSM4909316 | Human | Breast | IDC | 5.48e-06 | 2.60e-01 | 0.21 |
| 54205 | CYCS | GSM4909319 | Human | Breast | IDC | 6.03e-54 | -3.72e-01 | 0.1563 |
| 54205 | CYCS | GSM4909320 | Human | Breast | IDC | 6.11e-07 | -3.43e-01 | 0.1575 |
| 54205 | CYCS | GSM4909321 | Human | Breast | IDC | 2.31e-14 | -1.44e-01 | 0.1559 |
| 54205 | CYCS | brca1 | Human | Breast | Precancer | 8.18e-06 | 3.74e-01 | -0.0338 |
| Page: 1 2 3 4 5 6 7 8 9 10 11 12 13 14 15 16 |
| Tissue | Expression Dynamics | Abbreviation |
| Breast | 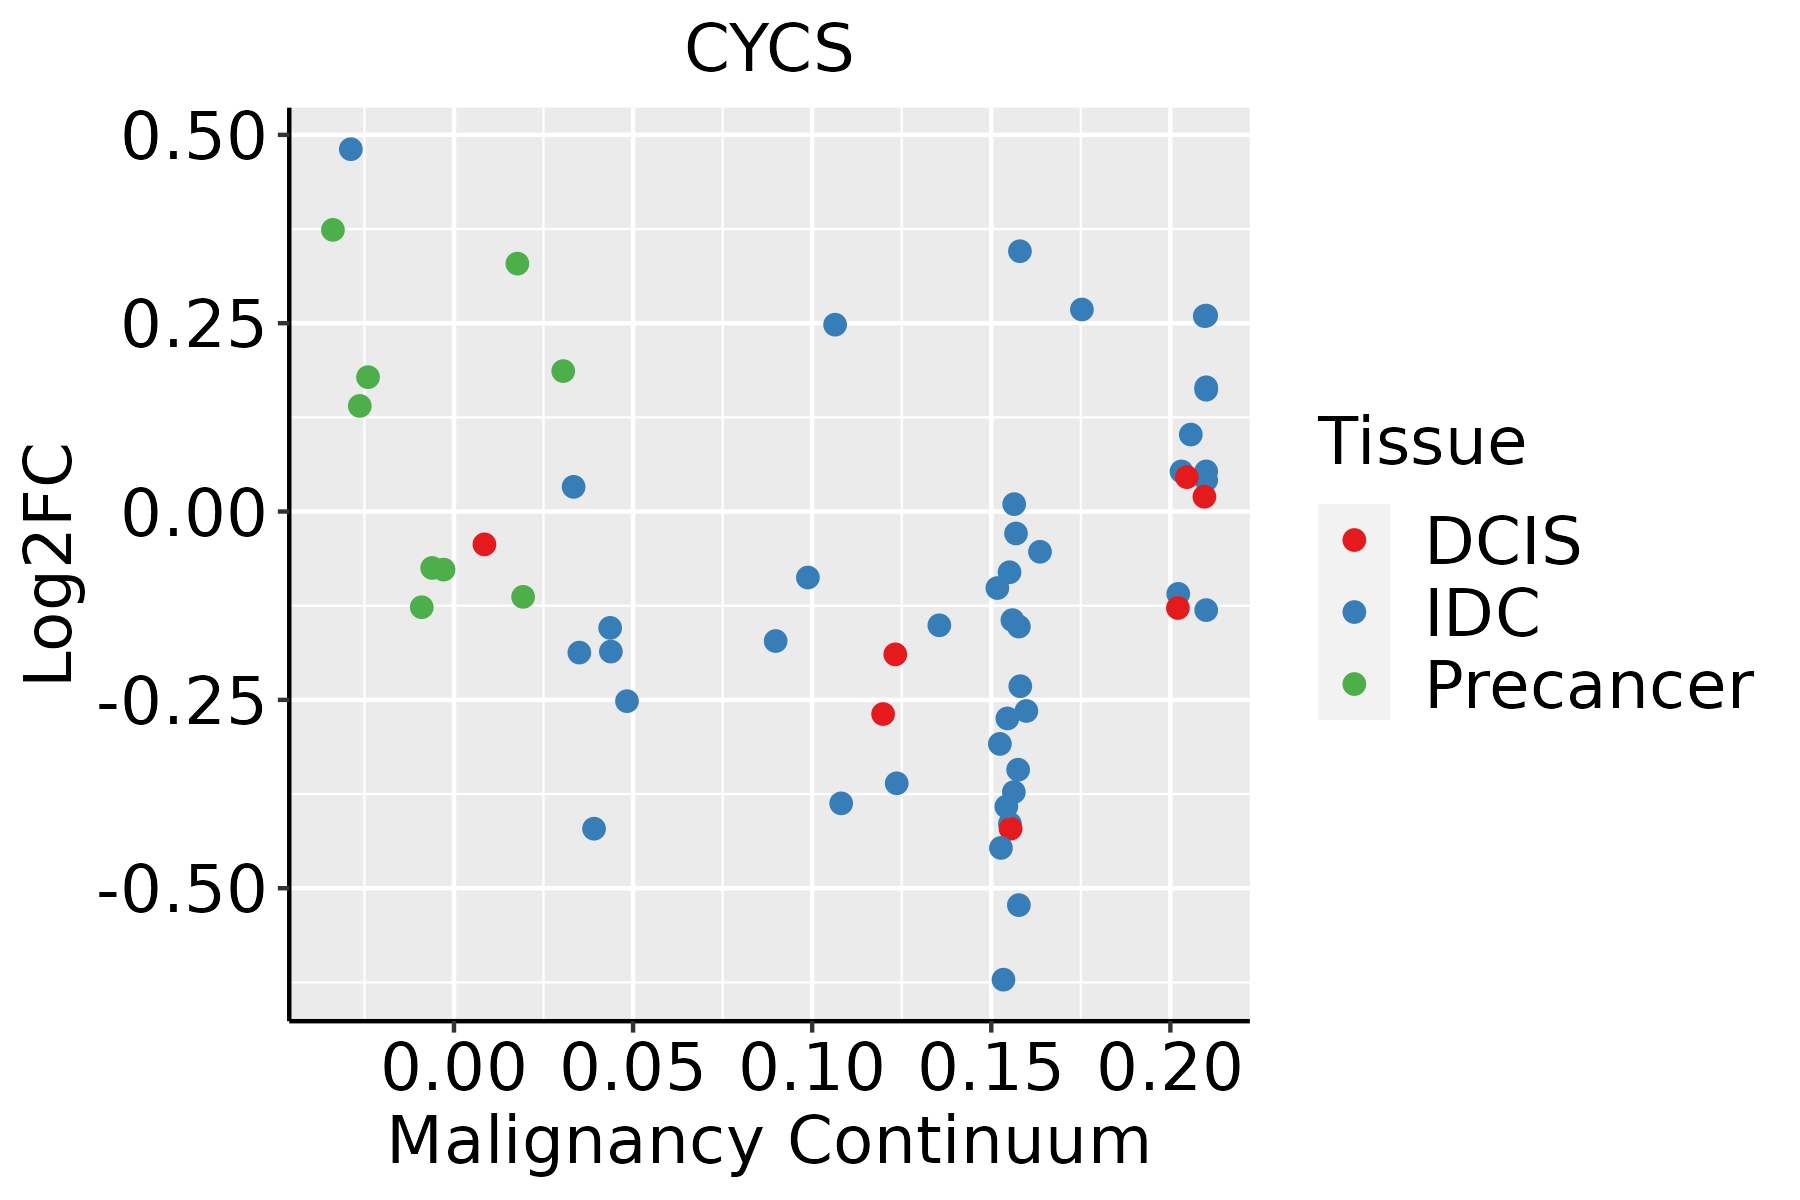 | IDC: Invasive ductal carcinoma |
| DCIS: Ductal carcinoma in situ | ||
| Precancer(BRCA1-mut): Precancerous lesion from BRCA1 mutation carriers | ||
| Cervix | 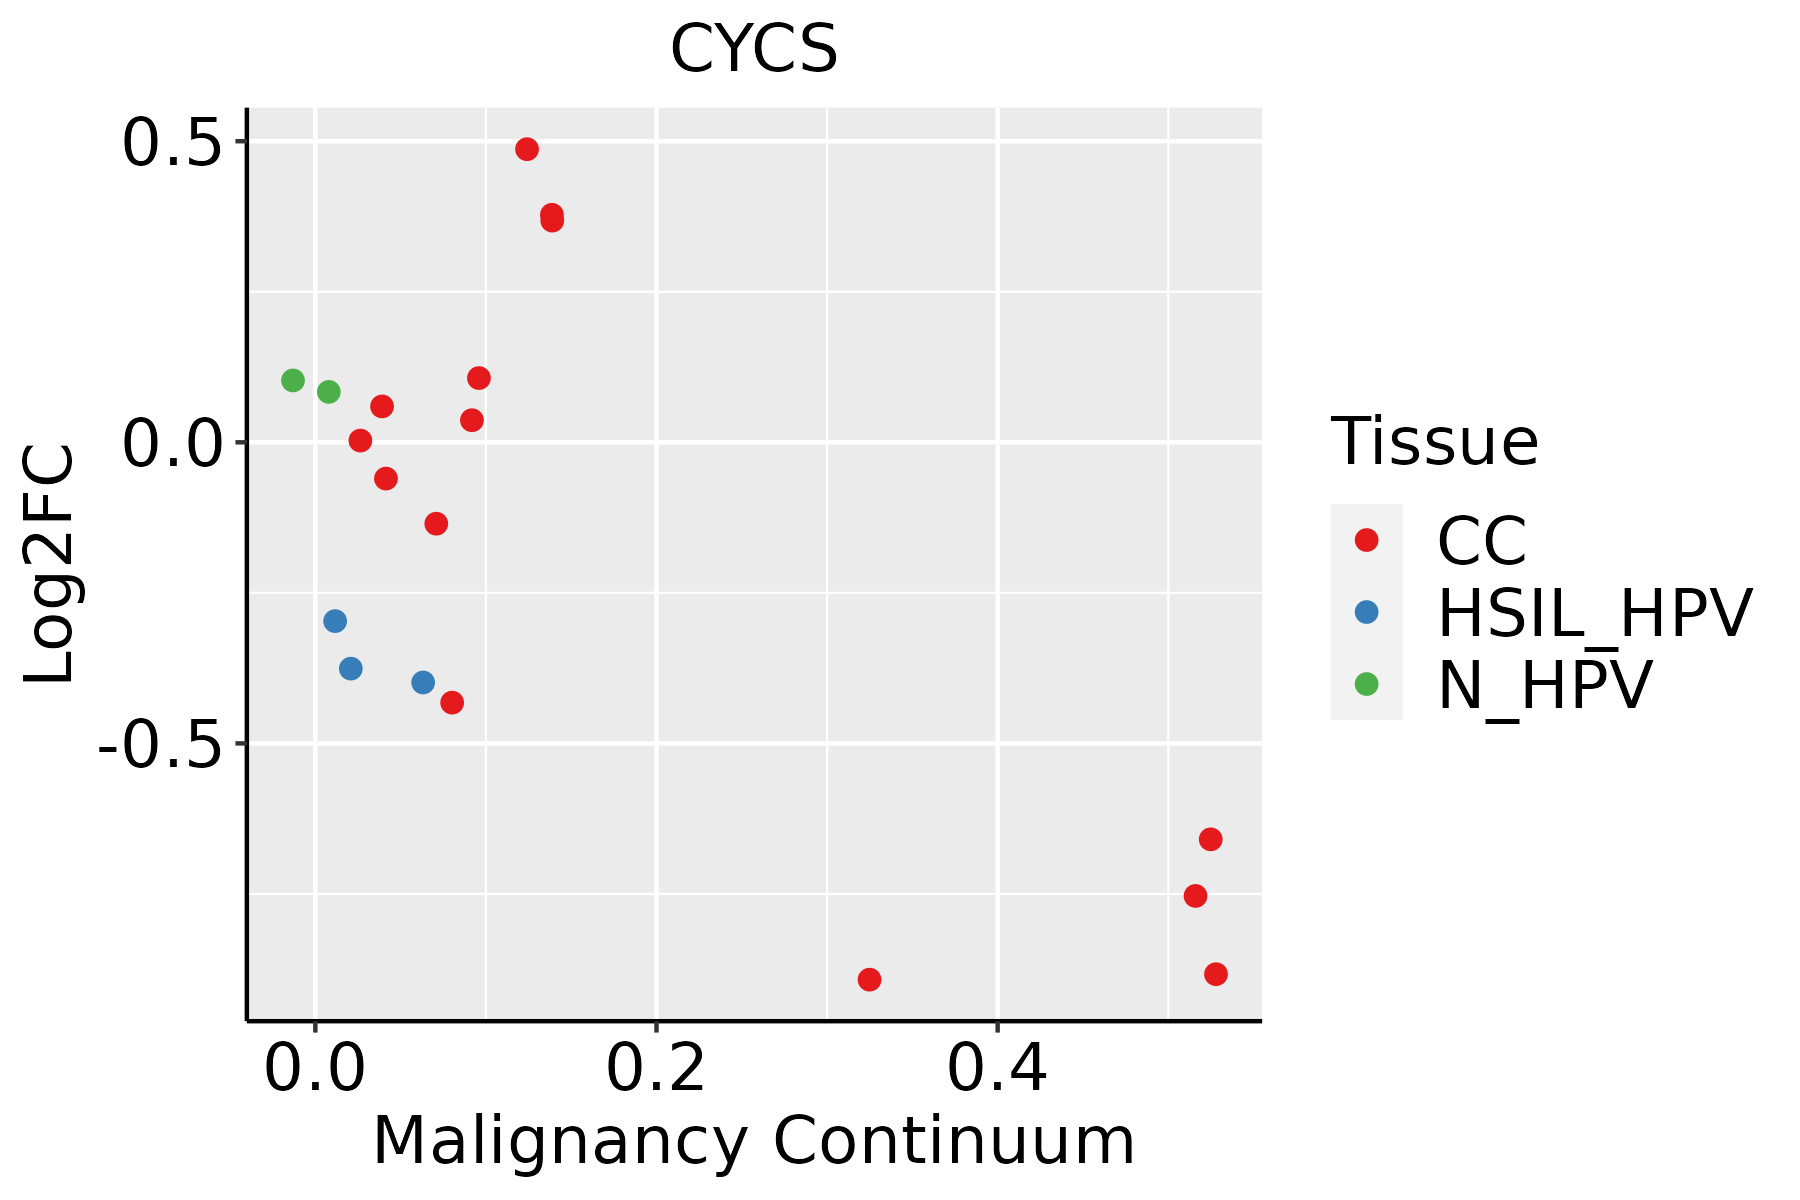 | CC: Cervix cancer |
| HSIL_HPV: HPV-infected high-grade squamous intraepithelial lesions | ||
| N_HPV: HPV-infected normal cervix | ||
| Colorectum (GSE201348) |  | FAP: Familial adenomatous polyposis |
| CRC: Colorectal cancer | ||
| Colorectum (HTA11) |  | AD: Adenomas |
| SER: Sessile serrated lesions | ||
| MSI-H: Microsatellite-high colorectal cancer | ||
| MSS: Microsatellite stable colorectal cancer | ||
| Endometrium | 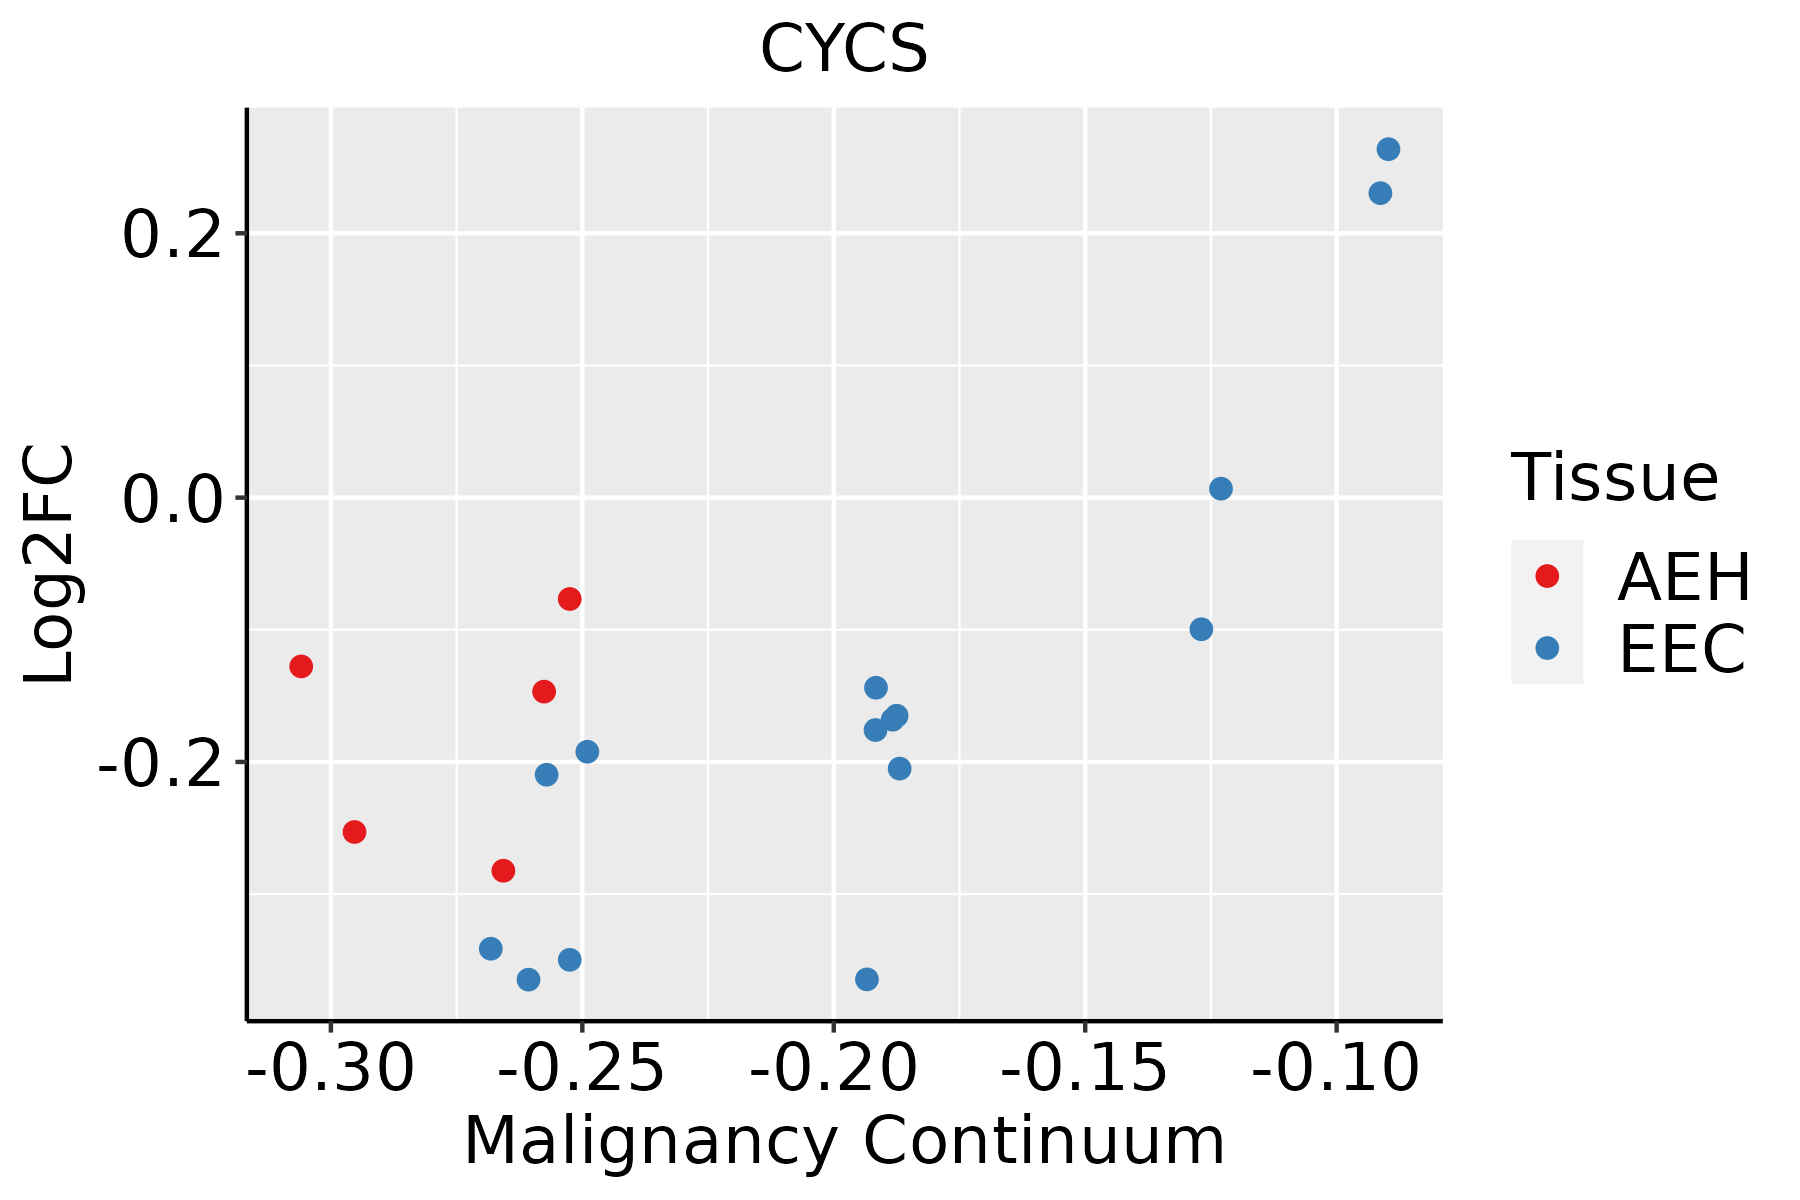 | AEH: Atypical endometrial hyperplasia |
| EEC: Endometrioid Cancer | ||
| Esophagus | 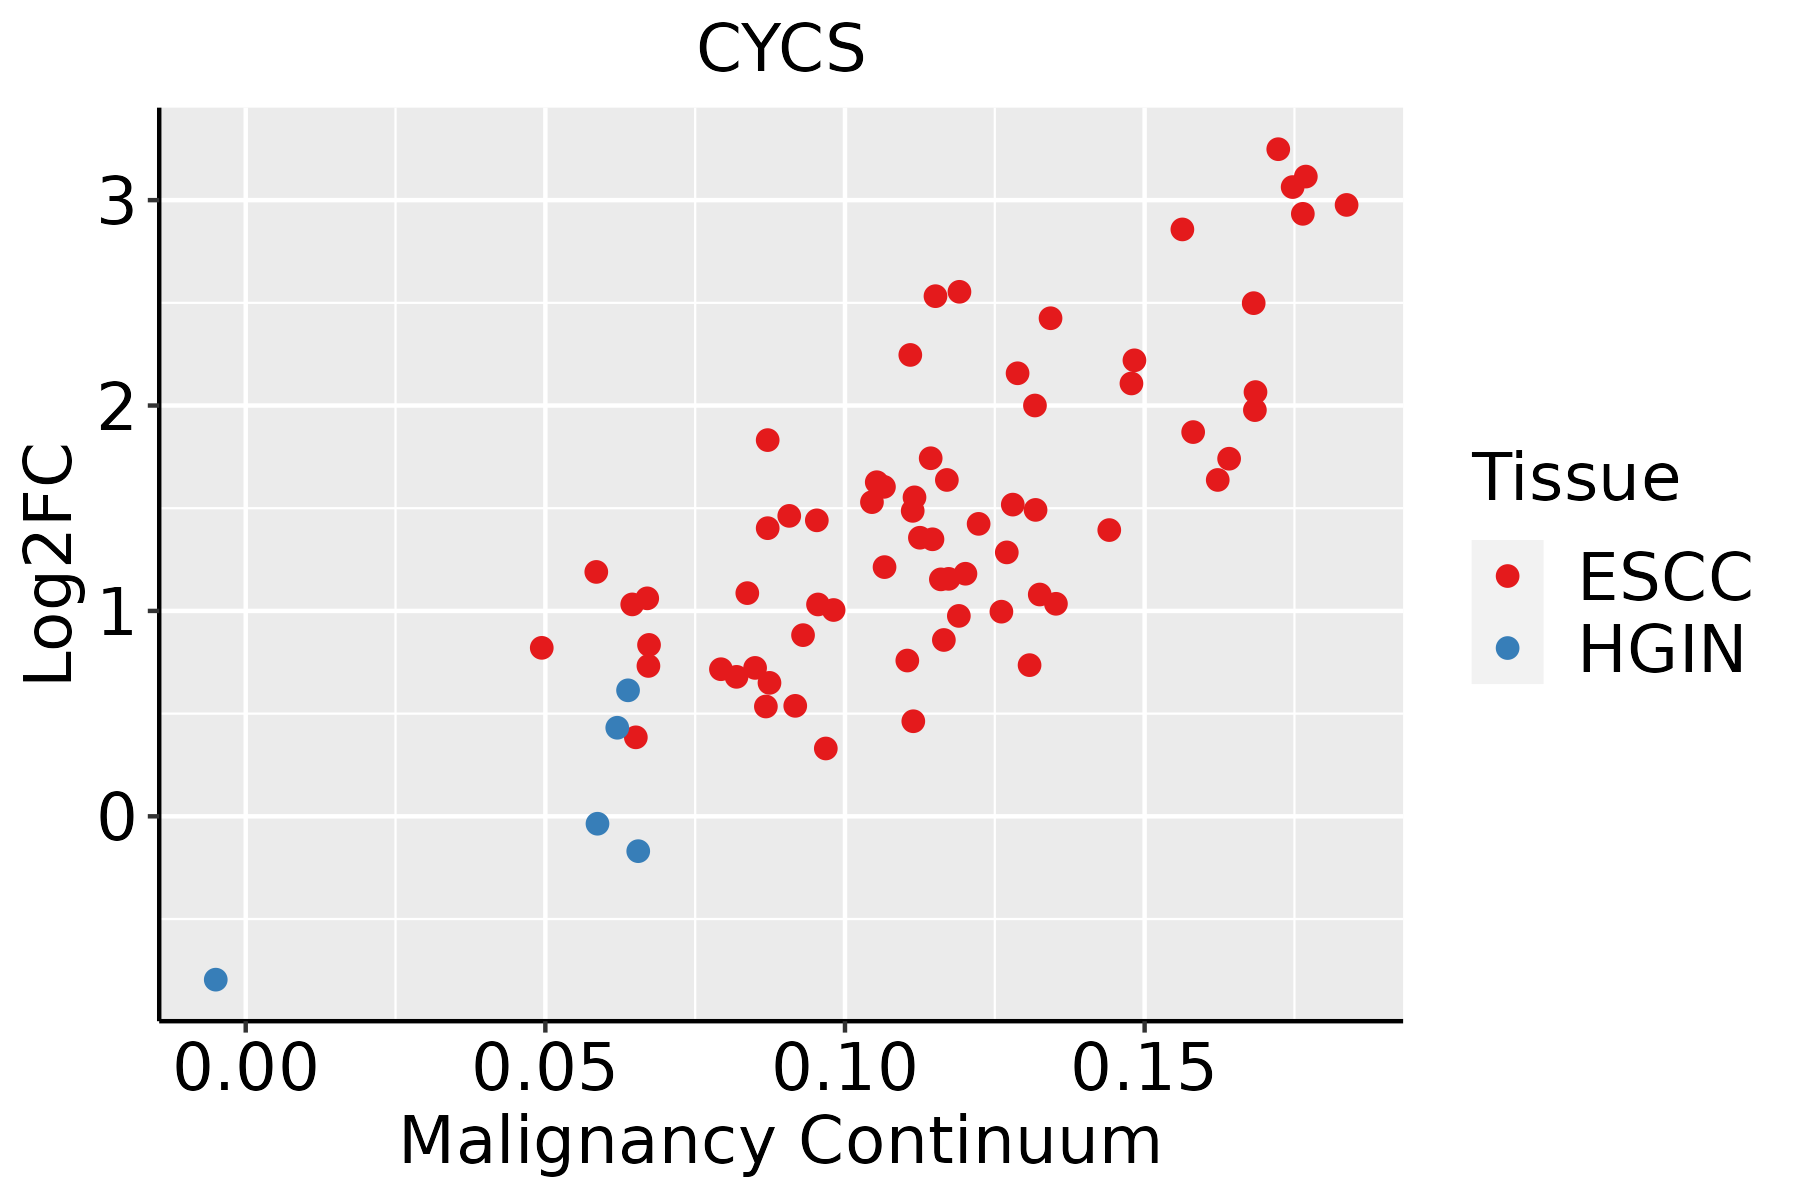 | ESCC: Esophageal squamous cell carcinoma |
| HGIN: High-grade intraepithelial neoplasias | ||
| LGIN: Low-grade intraepithelial neoplasias | ||
| GC | 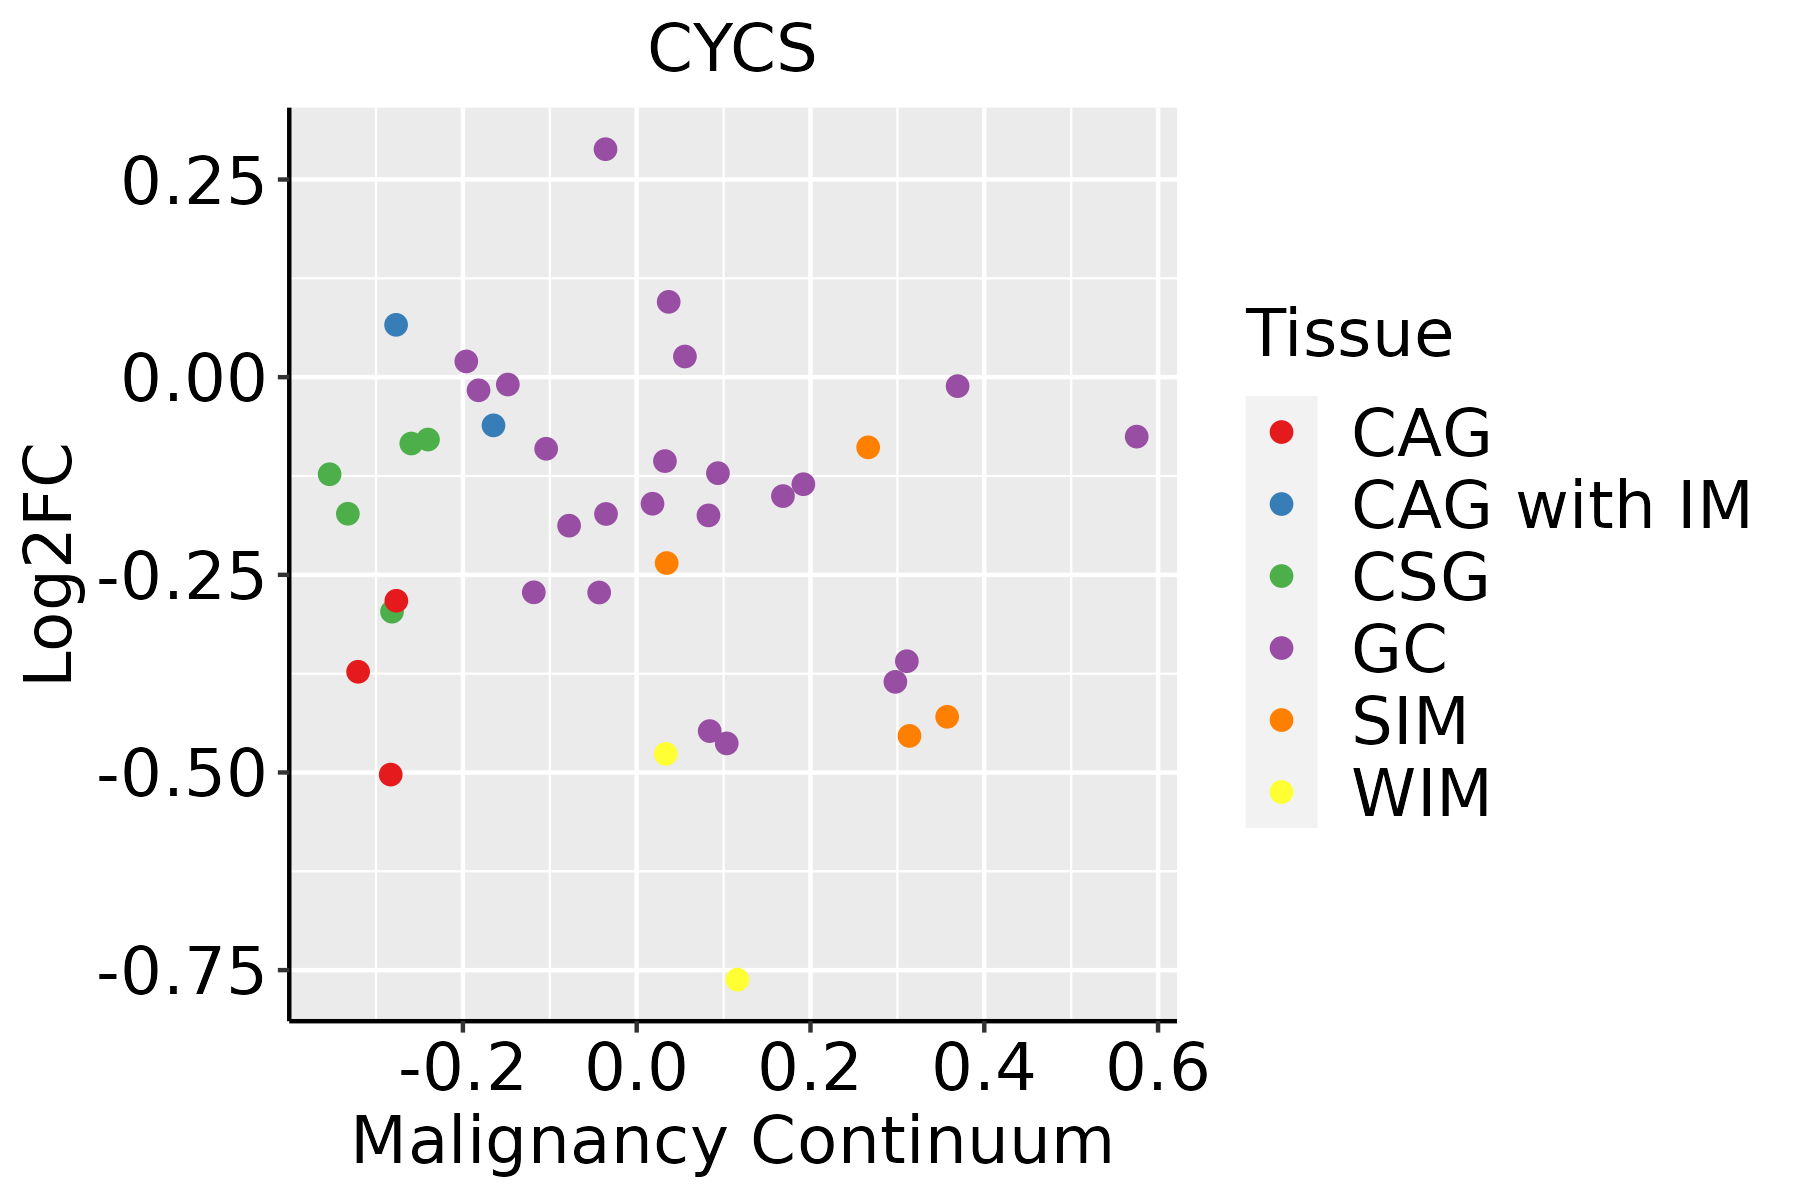 | CAG: Chronic atrophic gastritis |
| CAG with IM: Chronic atrophic gastritis with intestinal metaplasia | ||
| CSG: Chronic superficial gastritis | ||
| GC: Gastric cancer | ||
| SIM: Severe intestinal metaplasia | ||
| WIM: Wild intestinal metaplasia | ||
| Liver | 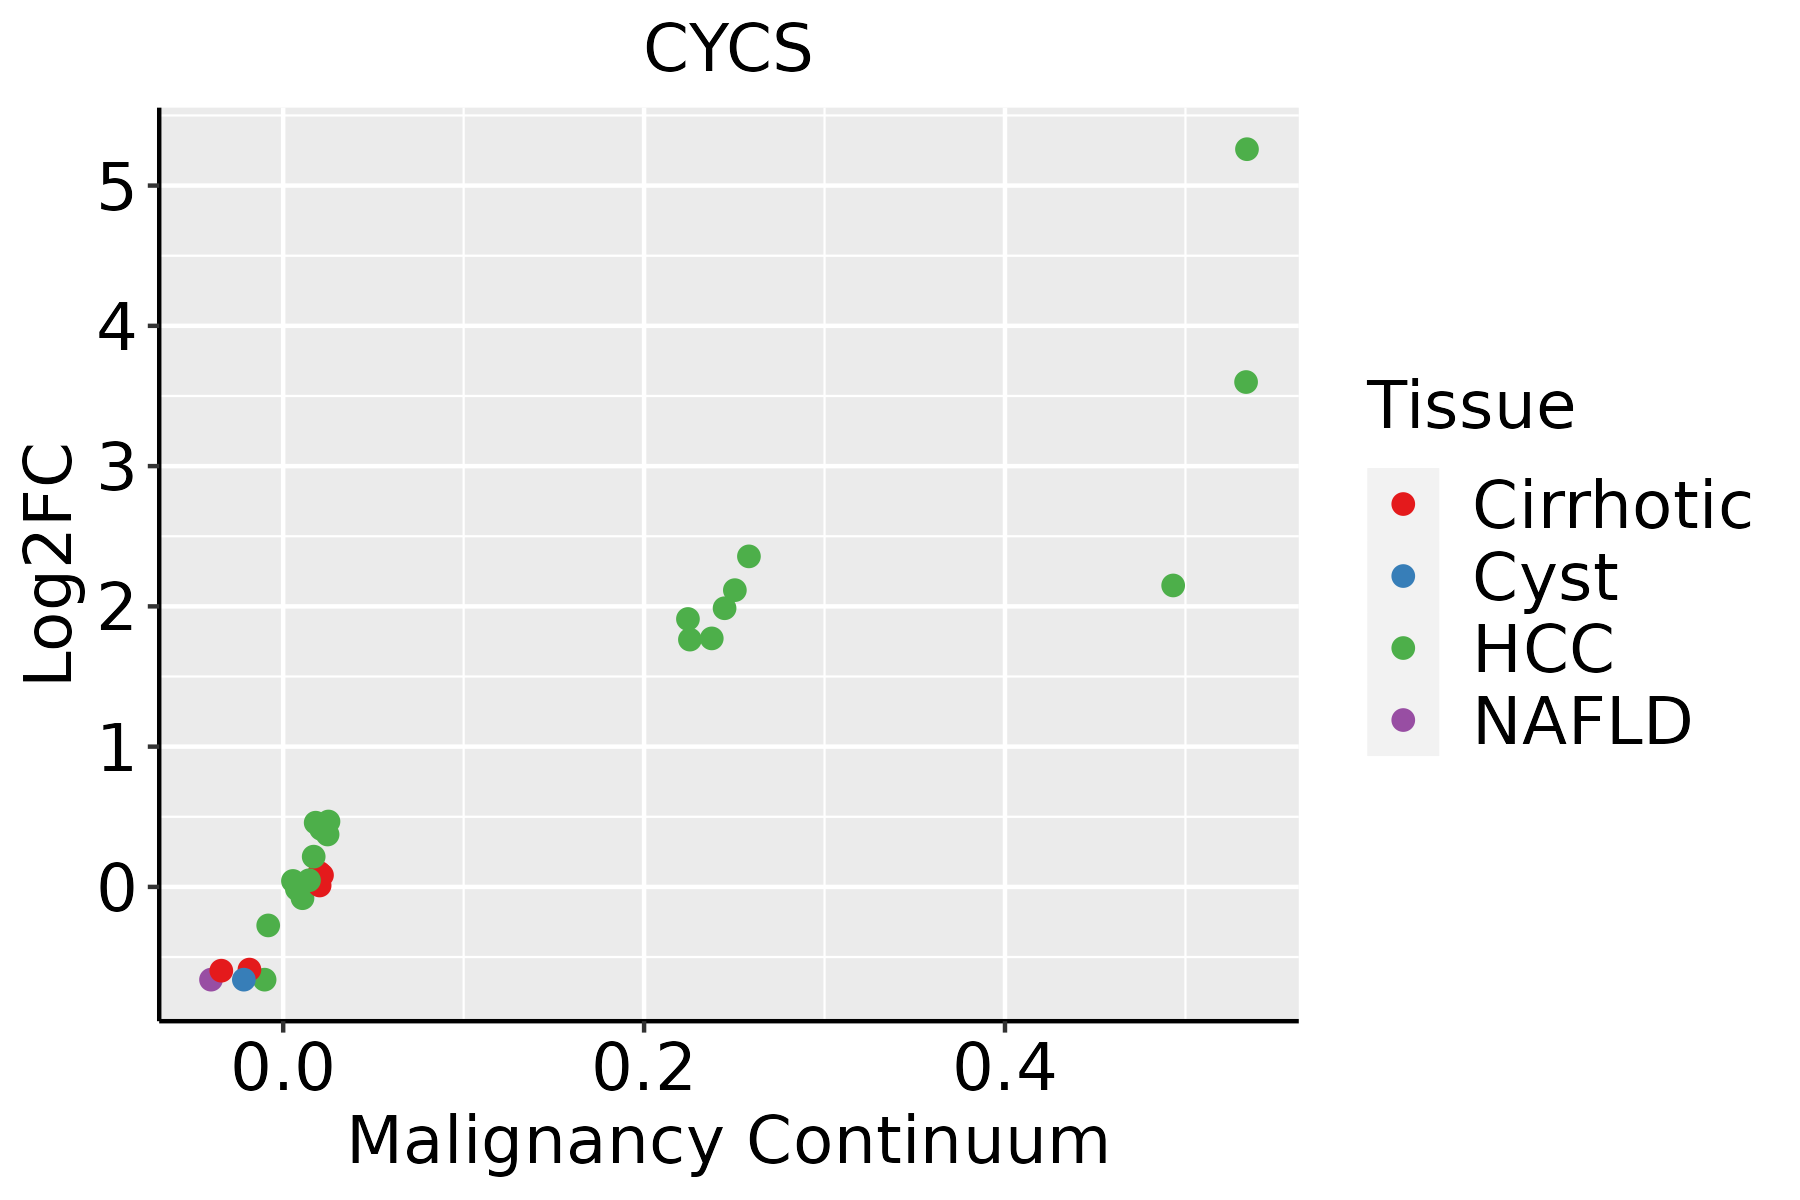 | HCC: Hepatocellular carcinoma |
| NAFLD: Non-alcoholic fatty liver disease | ||
| Oral Cavity | 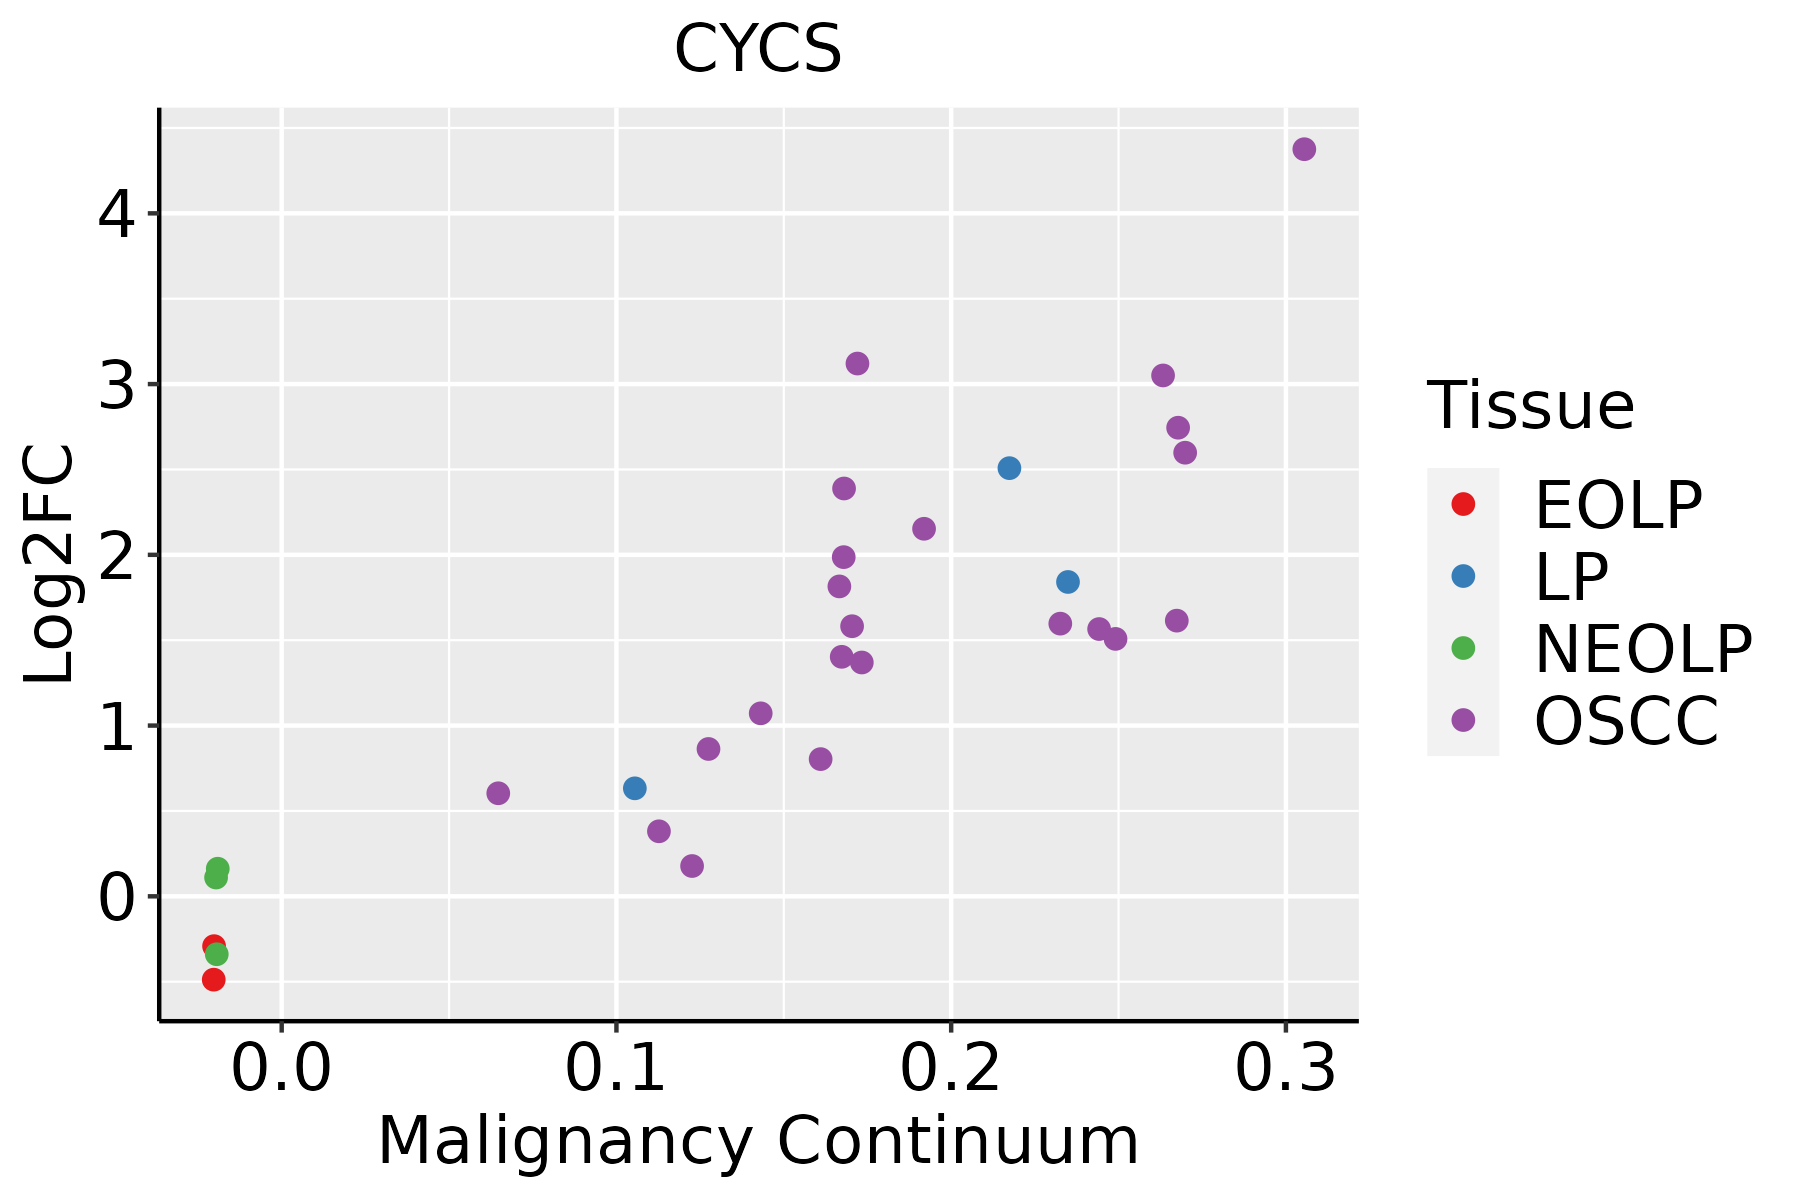 | EOLP: Erosive Oral lichen planus |
| LP: leukoplakia | ||
| NEOLP: Non-erosive oral lichen planus | ||
| OSCC: Oral squamous cell carcinoma | ||
| Prostate | 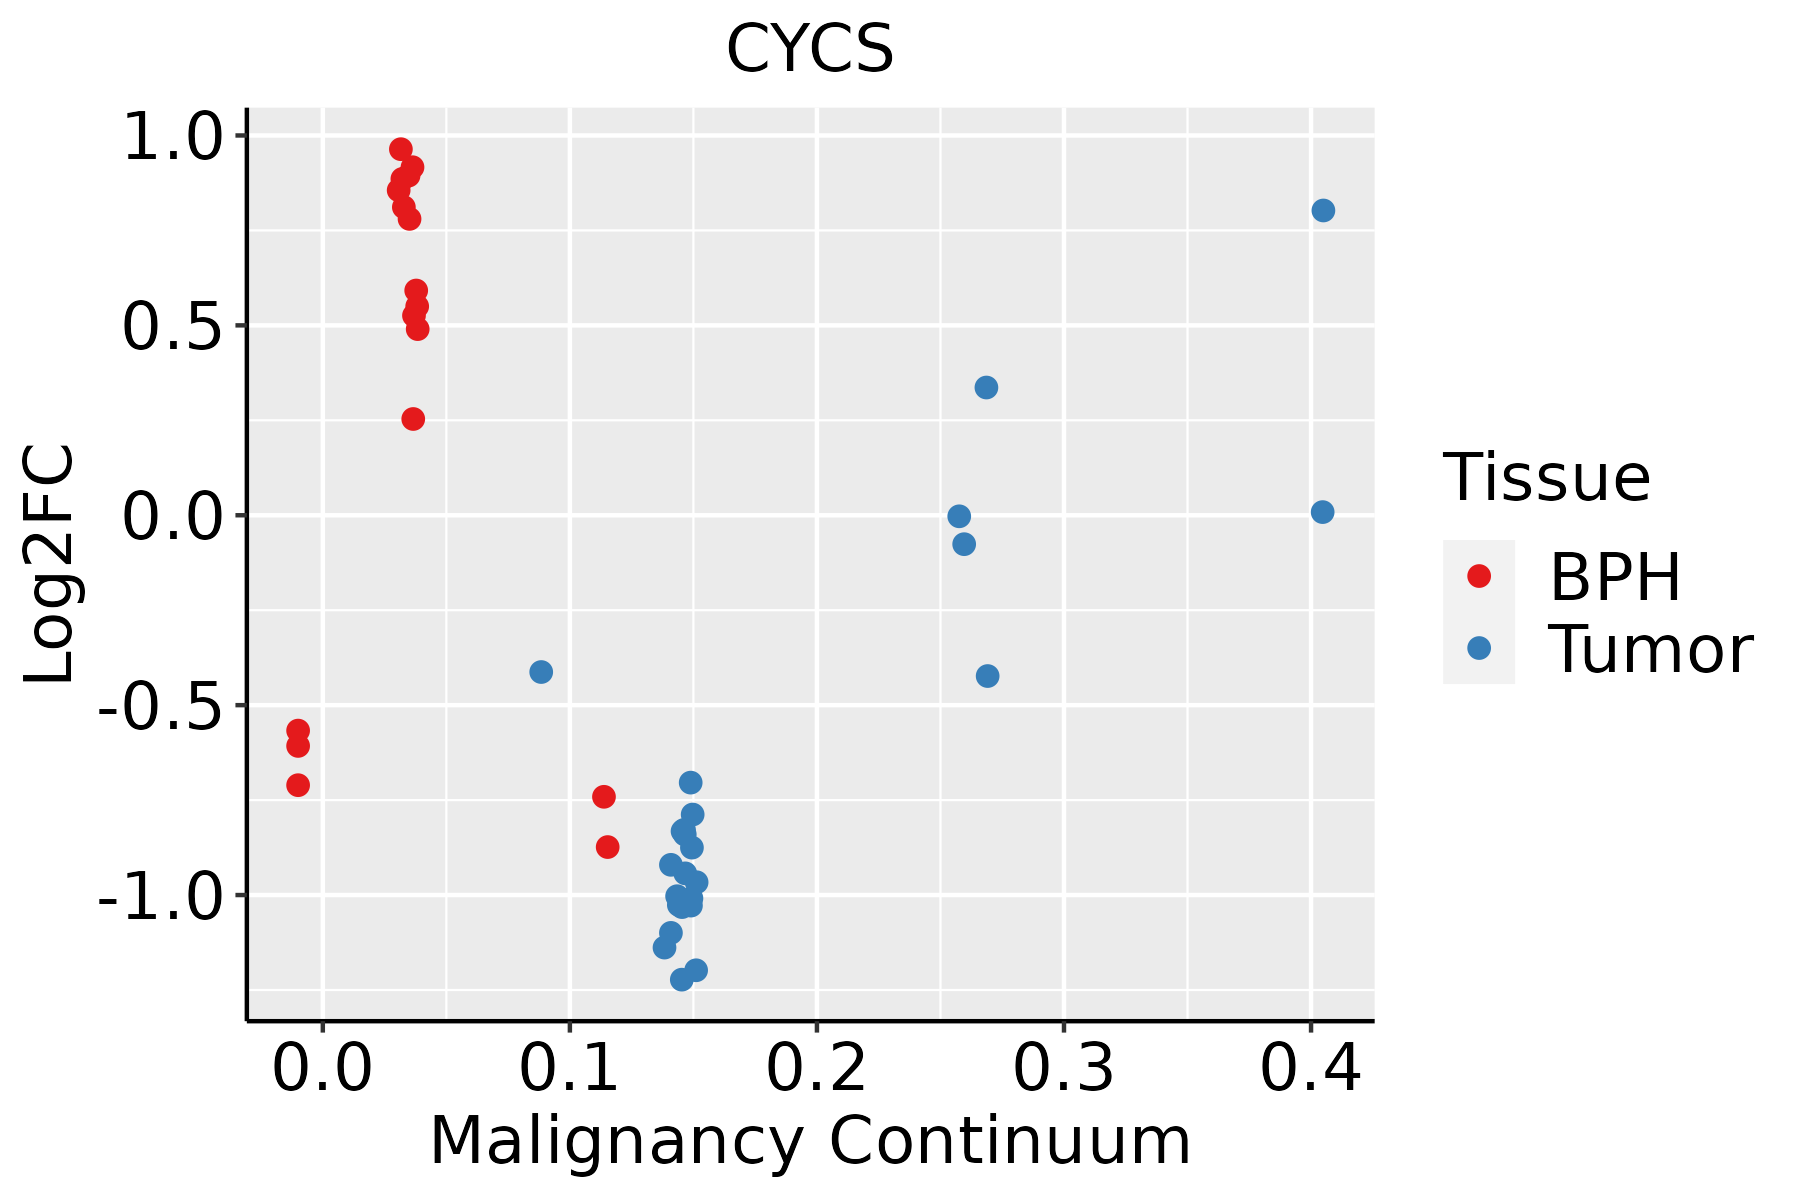 | BPH: Benign Prostatic Hyperplasia |
| Skin |  | AK: Actinic keratosis |
| cSCC: Cutaneous squamous cell carcinoma | ||
| SCCIS:squamous cell carcinoma in situ | ||
| Thyroid | 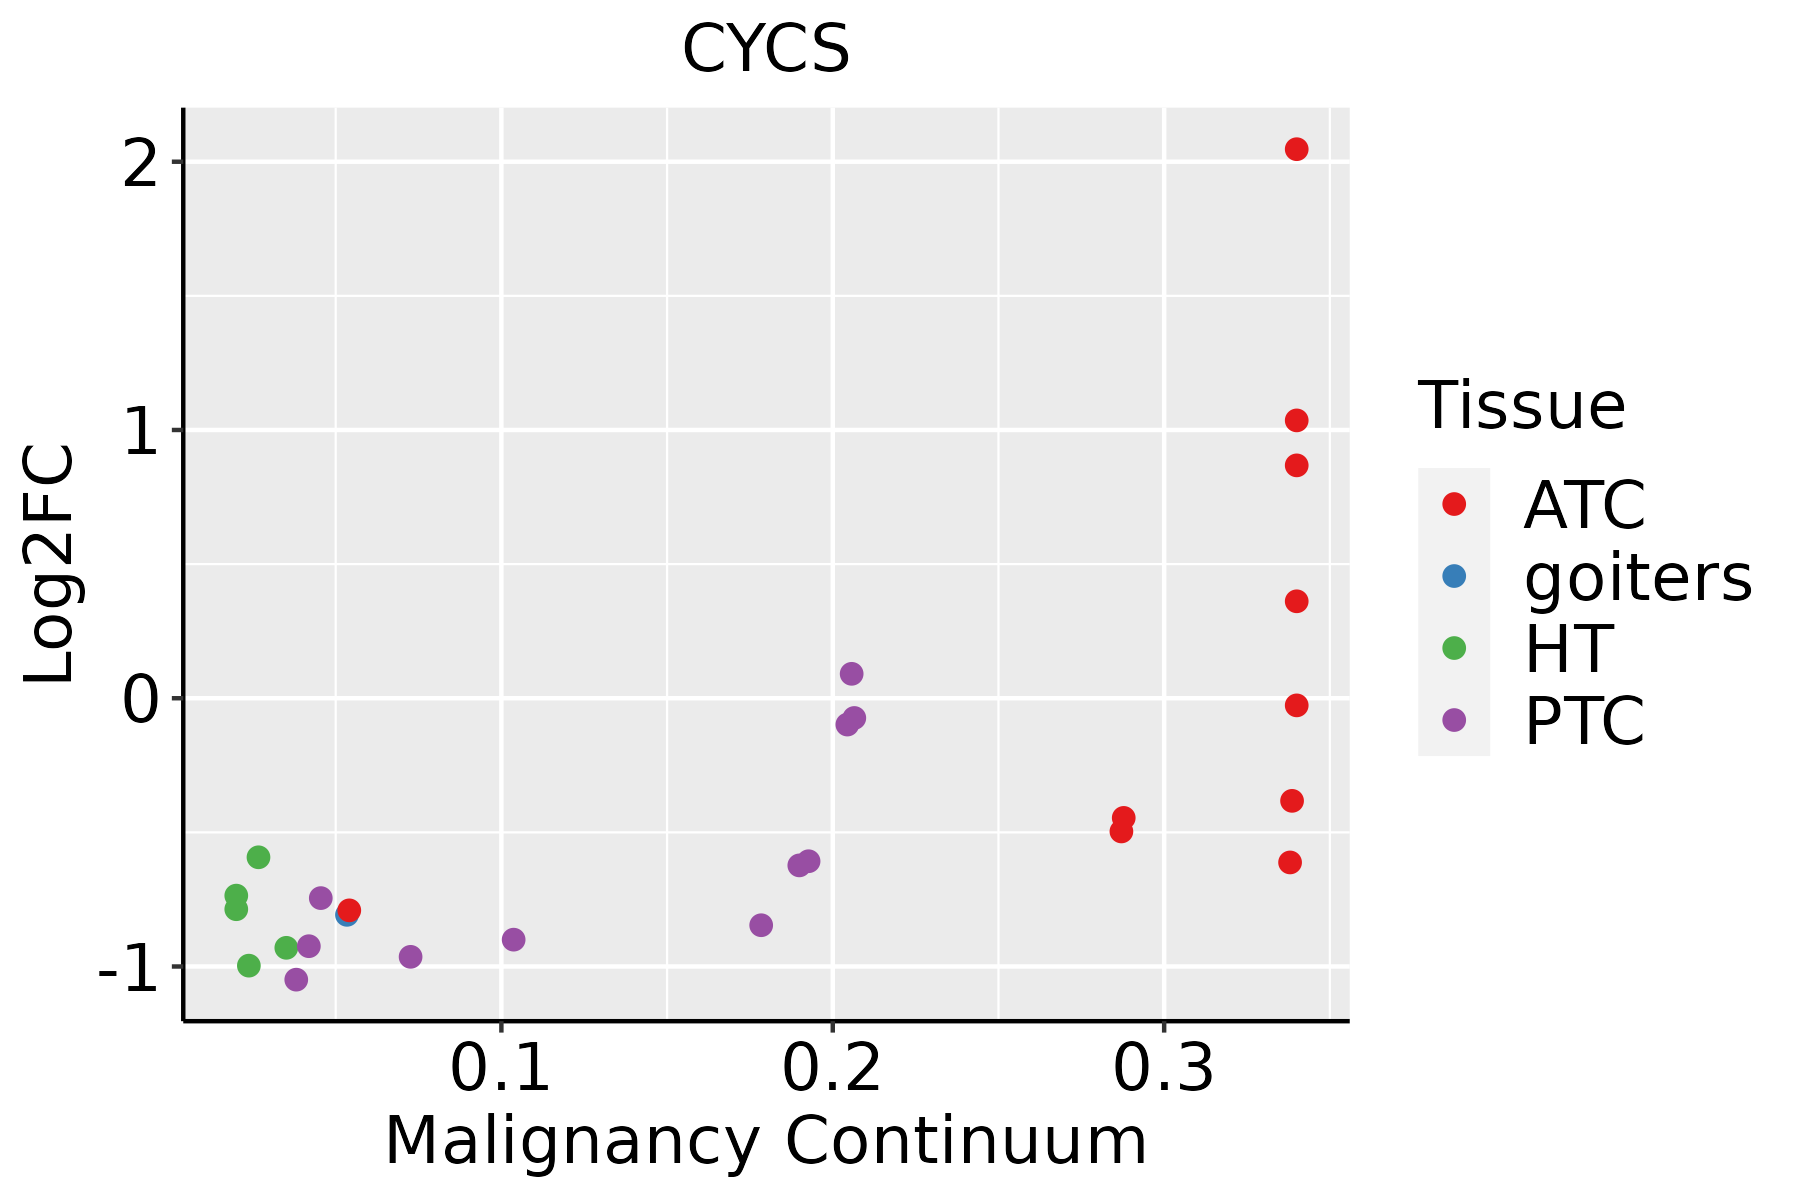 | ATC: Anaplastic thyroid cancer |
| HT: Hashimoto's thyroiditis | ||
| PTC: Papillary thyroid cancer |
| ∗log2FC in expression of this searched gene in stem-like cells from each diseased tissue sample relative to stem-like cells in normal samples in each tissue plotted against the malignancy continuum. Samples are colored based on if they are from different disease stage. |
Top |
Malignant transformation related pathway analysis |
| Find out the enriched GO biological processes and KEGG pathways involved in transition from healthy to precancer to cancer |
| Tissue | Disease Stage | Enriched GO biological Processes |
| Colorectum | AD |  |
| Colorectum | SER |  |
| Colorectum | MSS |  |
| Colorectum | MSI-H |  |
| Colorectum | FAP |  |
| ∗Top 15 enriched GO BP terms are showed in the bar plot of each disease state in each tissue. Each row represents a significant GO biological process which is colored according to the -log10(p.adjust). |
| Page: 1 2 3 4 5 6 7 8 9 |
| GO ID | Tissue | Disease Stage | Description | Gene Ratio | Bg Ratio | pvalue | p.adjust | Count |
| GO:00460349 | Breast | Precancer | ATP metabolic process | 82/1080 | 277/18723 | 1.94e-36 | 5.19e-33 | 82 |
| GO:00061199 | Breast | Precancer | oxidative phosphorylation | 53/1080 | 141/18723 | 1.15e-29 | 2.04e-26 | 53 |
| GO:00090608 | Breast | Precancer | aerobic respiration | 58/1080 | 189/18723 | 5.69e-27 | 7.62e-24 | 58 |
| GO:00060918 | Breast | Precancer | generation of precursor metabolites and energy | 94/1080 | 490/18723 | 1.54e-25 | 1.64e-22 | 94 |
| GO:00453338 | Breast | Precancer | cellular respiration | 59/1080 | 230/18723 | 5.97e-23 | 5.32e-20 | 59 |
| GO:00159808 | Breast | Precancer | energy derivation by oxidation of organic compounds | 70/1080 | 318/18723 | 8.33e-23 | 6.37e-20 | 70 |
| GO:00196468 | Breast | Precancer | aerobic electron transport chain | 34/1080 | 87/18723 | 3.95e-20 | 2.64e-17 | 34 |
| GO:00427738 | Breast | Precancer | ATP synthesis coupled electron transport | 35/1080 | 95/18723 | 1.08e-19 | 5.76e-17 | 35 |
| GO:00427758 | Breast | Precancer | mitochondrial ATP synthesis coupled electron transport | 35/1080 | 95/18723 | 1.08e-19 | 5.76e-17 | 35 |
| GO:00229048 | Breast | Precancer | respiratory electron transport chain | 35/1080 | 114/18723 | 8.51e-17 | 3.26e-14 | 35 |
| GO:00229008 | Breast | Precancer | electron transport chain | 42/1080 | 175/18723 | 1.37e-15 | 4.59e-13 | 42 |
| GO:00525479 | Breast | Precancer | regulation of peptidase activity | 71/1080 | 461/18723 | 2.72e-14 | 6.94e-12 | 71 |
| GO:00525489 | Breast | Precancer | regulation of endopeptidase activity | 67/1080 | 432/18723 | 1.06e-13 | 2.36e-11 | 67 |
| GO:20001169 | Breast | Precancer | regulation of cysteine-type endopeptidase activity | 43/1080 | 235/18723 | 1.30e-11 | 1.83e-09 | 43 |
| GO:00432819 | Breast | Precancer | regulation of cysteine-type endopeptidase activity involved in apoptotic process | 40/1080 | 209/18723 | 1.59e-11 | 2.07e-09 | 40 |
| GO:00458629 | Breast | Precancer | positive regulation of proteolysis | 51/1080 | 372/18723 | 7.77e-09 | 5.70e-07 | 51 |
| GO:00109529 | Breast | Precancer | positive regulation of peptidase activity | 33/1080 | 197/18723 | 3.01e-08 | 1.89e-06 | 33 |
| GO:00432808 | Breast | Precancer | positive regulation of cysteine-type endopeptidase activity involved in apoptotic process | 24/1080 | 129/18723 | 3.13e-07 | 1.50e-05 | 24 |
| GO:00109509 | Breast | Precancer | positive regulation of endopeptidase activity | 29/1080 | 179/18723 | 4.23e-07 | 1.90e-05 | 29 |
| GO:00061228 | Breast | Precancer | mitochondrial electron transport, ubiquinol to cytochrome c | 7/1080 | 11/18723 | 5.61e-07 | 2.46e-05 | 7 |
| Page: 1 2 3 4 5 6 7 8 9 10 11 12 13 14 15 16 17 18 19 20 21 22 23 24 25 26 27 28 29 30 31 32 33 34 35 36 |
| Pathway ID | Tissue | Disease Stage | Description | Gene Ratio | Bg Ratio | pvalue | p.adjust | qvalue | Count |
| hsa0502261 | Stomach | CAG | Pathways of neurodegeneration - multiple diseases | 46/368 | 476/8465 | 2.08e-07 | 3.75e-06 | 3.01e-06 | 46 |
| hsa0513061 | Stomach | CAG | Pathogenic Escherichia coli infection | 25/368 | 197/8465 | 1.26e-06 | 1.96e-05 | 1.57e-05 | 25 |
| hsa054166 | Stomach | CAG | Viral myocarditis | 13/368 | 60/8465 | 1.29e-06 | 1.96e-05 | 1.57e-05 | 13 |
| hsa0501061 | Stomach | CAG | Alzheimer disease | 38/368 | 384/8465 | 1.45e-06 | 2.10e-05 | 1.68e-05 | 38 |
| hsa0513261 | Stomach | CAG | Salmonella infection | 28/368 | 249/8465 | 3.34e-06 | 4.60e-05 | 3.69e-05 | 28 |
| hsa051676 | Stomach | CAG | Kaposi sarcoma-associated herpesvirus infection | 20/368 | 194/8465 | 2.83e-04 | 3.27e-03 | 2.62e-03 | 20 |
| hsa051456 | Stomach | CAG | Toxoplasmosis | 14/368 | 112/8465 | 3.34e-04 | 3.44e-03 | 2.76e-03 | 14 |
| hsa051696 | Stomach | CAG | Epstein-Barr virus infection | 20/368 | 202/8465 | 4.81e-04 | 4.34e-03 | 3.48e-03 | 20 |
| hsa0513161 | Stomach | CAG | Shigellosis | 21/368 | 247/8465 | 2.47e-03 | 1.79e-02 | 1.43e-02 | 21 |
| hsa0501271 | Stomach | CAG | Parkinson disease | 44/368 | 266/8465 | 7.32e-15 | 7.05e-13 | 5.65e-13 | 44 |
| hsa0493271 | Stomach | CAG | Non-alcoholic fatty liver disease | 33/368 | 155/8465 | 1.26e-14 | 9.09e-13 | 7.28e-13 | 33 |
| hsa0502071 | Stomach | CAG | Prion disease | 42/368 | 273/8465 | 4.09e-13 | 1.97e-11 | 1.58e-11 | 42 |
| hsa0019071 | Stomach | CAG | Oxidative phosphorylation | 27/368 | 134/8465 | 1.40e-11 | 5.06e-10 | 4.06e-10 | 27 |
| hsa0501471 | Stomach | CAG | Amyotrophic lateral sclerosis | 46/368 | 364/8465 | 3.68e-11 | 1.06e-09 | 8.52e-10 | 46 |
| hsa0501671 | Stomach | CAG | Huntington disease | 41/368 | 306/8465 | 7.51e-11 | 1.97e-09 | 1.58e-09 | 41 |
| hsa0541771 | Stomach | CAG | Lipid and atherosclerosis | 29/368 | 215/8465 | 4.50e-08 | 1.00e-06 | 8.02e-07 | 29 |
| hsa051347 | Stomach | CAG | Legionellosis | 14/368 | 57/8465 | 9.41e-08 | 1.94e-06 | 1.56e-06 | 14 |
| hsa0502271 | Stomach | CAG | Pathways of neurodegeneration - multiple diseases | 46/368 | 476/8465 | 2.08e-07 | 3.75e-06 | 3.01e-06 | 46 |
| hsa0513071 | Stomach | CAG | Pathogenic Escherichia coli infection | 25/368 | 197/8465 | 1.26e-06 | 1.96e-05 | 1.57e-05 | 25 |
| hsa054167 | Stomach | CAG | Viral myocarditis | 13/368 | 60/8465 | 1.29e-06 | 1.96e-05 | 1.57e-05 | 13 |
| Page: 1 2 3 4 5 6 7 8 9 10 11 12 13 14 15 16 17 18 19 20 21 22 23 24 25 26 27 28 29 30 31 32 33 34 35 36 37 38 39 40 41 42 43 44 45 46 47 48 49 50 51 52 53 54 55 56 57 58 59 60 |
Top |
Cell-cell communication analysis |
| Identification of potential cell-cell interactions between two cell types and their ligand-receptor pairs for different disease states |
| Ligand | Receptor | LRpair | Pathway | Tissue | Disease Stage |
| Page: 1 |
Top |
Single-cell gene regulatory network inference analysis |
| Find out the significant the regulons (TFs) and the target genes of each regulon across cell types for different disease states |
| TF | Cell Type | Tissue | Disease Stage | Target Gene | RSS | Regulon Activity |
| ∗The dot plots of a searched regulon are shown for all cell subpopulations in each disease state of each tissue based on the regulon specific score inferred using pySCENIC and by calculating the average expression. |
| Page: 1 |
Top |
Somatic mutation of malignant transformation related genes |
| Annotation of somatic variants for genes involved in malignant transformation |
| Hugo Symbol | Variant Class | Variant Classification | dbSNP RS | HGVSc | HGVSp | HGVSp Short | SWISSPROT | BIOTYPE | SIFT | PolyPhen | Tumor Sample Barcode | Tissue | Histology | Sex | Age | Stage | Therapy Types | Drugs | Outcome |
| CYCS | SNV | Missense_Mutation | novel | c.64G>A | p.Glu22Lys | p.E22K | P99999 | protein_coding | deleterious(0.01) | benign(0.162) | TCGA-HM-A4S6-01 | Cervix | cervical & endocervical cancer | Female | <65 | III/IV | Chemotherapy | cisplatin | CR |
| CYCS | SNV | Missense_Mutation | novel | c.163A>G | p.Asn55Asp | p.N55D | P99999 | protein_coding | deleterious(0.05) | benign(0.031) | TCGA-F5-6814-01 | Colorectum | rectum adenocarcinoma | Male | <65 | I/II | Unknown | Unknown | SD |
| CYCS | SNV | Missense_Mutation | novel | c.4G>A | p.Gly2Ser | p.G2S | P99999 | protein_coding | deleterious(0.04) | benign(0.167) | TCGA-A5-A0G2-01 | Endometrium | uterine corpus endometrioid carcinoma | Female | <65 | III/IV | Unknown | Unknown | SD |
| CYCS | SNV | Missense_Mutation | novel | c.243G>T | p.Met81Ile | p.M81I | P99999 | protein_coding | tolerated(0.09) | benign(0.167) | TCGA-A5-A2K5-01 | Endometrium | uterine corpus endometrioid carcinoma | Female | >=65 | I/II | Unknown | Unknown | SD |
| CYCS | SNV | Missense_Mutation | rs11548796 | c.91N>T | p.Pro31Ser | p.P31S | P99999 | protein_coding | deleterious(0.04) | possibly_damaging(0.786) | TCGA-AP-A1DK-01 | Endometrium | uterine corpus endometrioid carcinoma | Female | <65 | I/II | Unknown | Unknown | SD |
| CYCS | SNV | Missense_Mutation | novel | c.142T>C | p.Ser48Pro | p.S48P | P99999 | protein_coding | deleterious(0.01) | benign(0.007) | TCGA-B5-A3FC-01 | Endometrium | uterine corpus endometrioid carcinoma | Female | <65 | I/II | Unknown | Unknown | SD |
| CYCS | SNV | Missense_Mutation | c.281N>C | p.Asp94Ala | p.D94A | P99999 | protein_coding | deleterious(0.01) | benign(0.225) | TCGA-BS-A0TC-01 | Endometrium | uterine corpus endometrioid carcinoma | Female | >=65 | I/II | Unknown | Unknown | SD | |
| CYCS | SNV | Missense_Mutation | c.29N>G | p.Ile10Ser | p.I10S | P99999 | protein_coding | deleterious(0.02) | probably_damaging(0.931) | TCGA-BS-A0UF-01 | Endometrium | uterine corpus endometrioid carcinoma | Female | >=65 | I/II | Unknown | Unknown | SD | |
| CYCS | SNV | Missense_Mutation | novel | c.290N>T | p.Ala97Val | p.A97V | P99999 | protein_coding | deleterious(0.03) | benign(0.146) | TCGA-EO-A22R-01 | Endometrium | uterine corpus endometrioid carcinoma | Female | <65 | I/II | Unknown | Unknown | SD |
| CYCS | SNV | Missense_Mutation | novel | c.4G>C | p.Gly2Arg | p.G2R | P99999 | protein_coding | deleterious(0.01) | possibly_damaging(0.863) | TCGA-78-7145-01 | Lung | lung adenocarcinoma | Female | <65 | III/IV | Chemotherapy | cisplatin | PD |
| Page: 1 2 |
Top |
Related drugs of malignant transformation related genes |
| Identification of chemicals and drugs interact with genes involved in malignant transfromation |
| (DGIdb 4.0) |
| Entrez ID | Symbol | Category | Interaction Types | Drug Claim Name | Drug Name | PMIDs |
| Page: 1 |

Copyright 2023-Present -The University of Texas Health Science Center at Houston |