
|
|||||
|
 | |
| |
| |
| |
| |
| |
|
Gene: FOS |
Gene summary for FOS |
| Gene information | Species | Human | Gene symbol | FOS | Gene ID | 2353 |
| Gene name | Fos proto-oncogene, AP-1 transcription factor subunit | |
| Gene Alias | AP-1 | |
| Cytomap | 14q24.3 | |
| Gene Type | protein-coding | GO ID | GO:0000003 | UniProtAcc | P01100 |
Top |
Malignant transformation analysis |
| Identification of the aberrant gene expression in precancerous and cancerous lesions by comparing the gene expression of stem-like cells in diseased tissues with normal stem cells |
| Entrez ID | Symbol | Replicates | Species | Organ | Tissue | Adj P-value | Log2FC | Malignancy |
| 2353 | FOS | GSM4909281 | Human | Breast | IDC | 1.24e-03 | -4.07e-01 | 0.21 |
| 2353 | FOS | GSM4909282 | Human | Breast | IDC | 1.85e-13 | 3.46e-01 | -0.0288 |
| 2353 | FOS | GSM4909285 | Human | Breast | IDC | 5.38e-11 | -2.57e-02 | 0.21 |
| 2353 | FOS | GSM4909286 | Human | Breast | IDC | 5.23e-22 | -5.77e-01 | 0.1081 |
| 2353 | FOS | GSM4909290 | Human | Breast | IDC | 4.42e-16 | -8.28e-01 | 0.2096 |
| 2353 | FOS | GSM4909293 | Human | Breast | IDC | 3.02e-05 | 3.12e-01 | 0.1581 |
| 2353 | FOS | GSM4909294 | Human | Breast | IDC | 1.48e-12 | -7.28e-01 | 0.2022 |
| 2353 | FOS | GSM4909297 | Human | Breast | IDC | 7.74e-04 | 2.09e-01 | 0.1517 |
| 2353 | FOS | GSM4909298 | Human | Breast | IDC | 4.57e-04 | -3.05e-01 | 0.1551 |
| 2353 | FOS | GSM4909299 | Human | Breast | IDC | 1.16e-38 | 6.21e-01 | 0.035 |
| 2353 | FOS | GSM4909300 | Human | Breast | IDC | 2.17e-25 | 7.36e-01 | 0.0334 |
| 2353 | FOS | GSM4909301 | Human | Breast | IDC | 4.87e-36 | 5.67e-01 | 0.1577 |
| 2353 | FOS | GSM4909304 | Human | Breast | IDC | 1.06e-08 | -5.00e-01 | 0.1636 |
| 2353 | FOS | GSM4909305 | Human | Breast | IDC | 1.57e-23 | 5.62e-01 | 0.0436 |
| 2353 | FOS | GSM4909306 | Human | Breast | IDC | 5.59e-12 | 2.19e-01 | 0.1564 |
| 2353 | FOS | GSM4909308 | Human | Breast | IDC | 9.08e-24 | 5.22e-01 | 0.158 |
| 2353 | FOS | GSM4909309 | Human | Breast | IDC | 1.04e-08 | 3.67e-01 | 0.0483 |
| 2353 | FOS | GSM4909311 | Human | Breast | IDC | 1.87e-06 | -3.38e-01 | 0.1534 |
| 2353 | FOS | GSM4909312 | Human | Breast | IDC | 1.76e-07 | 2.99e-01 | 0.1552 |
| 2353 | FOS | GSM4909313 | Human | Breast | IDC | 4.23e-17 | 5.05e-01 | 0.0391 |
| Page: 1 2 3 4 5 6 7 8 9 10 11 12 13 14 15 16 17 |
| Tissue | Expression Dynamics | Abbreviation |
| Breast | 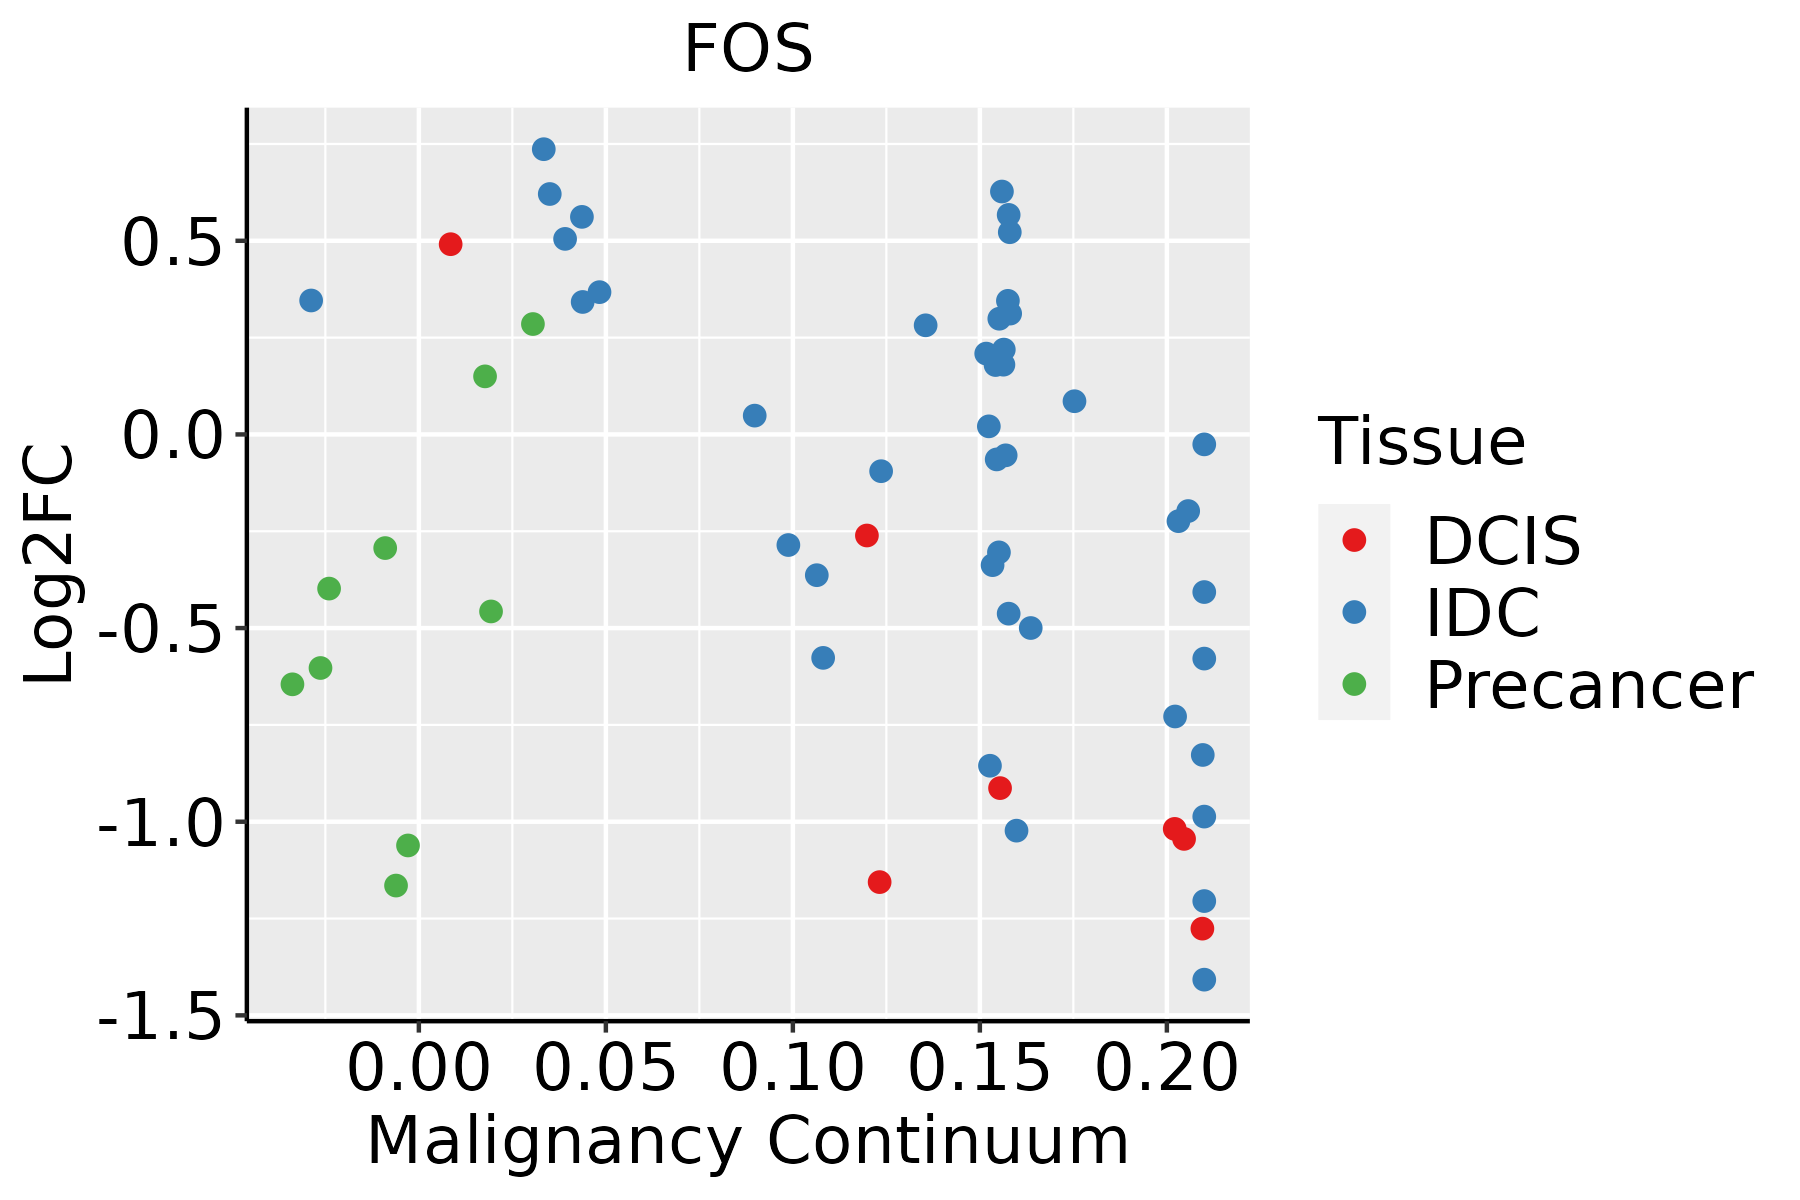 | IDC: Invasive ductal carcinoma |
| DCIS: Ductal carcinoma in situ | ||
| Precancer(BRCA1-mut): Precancerous lesion from BRCA1 mutation carriers | ||
| Cervix | 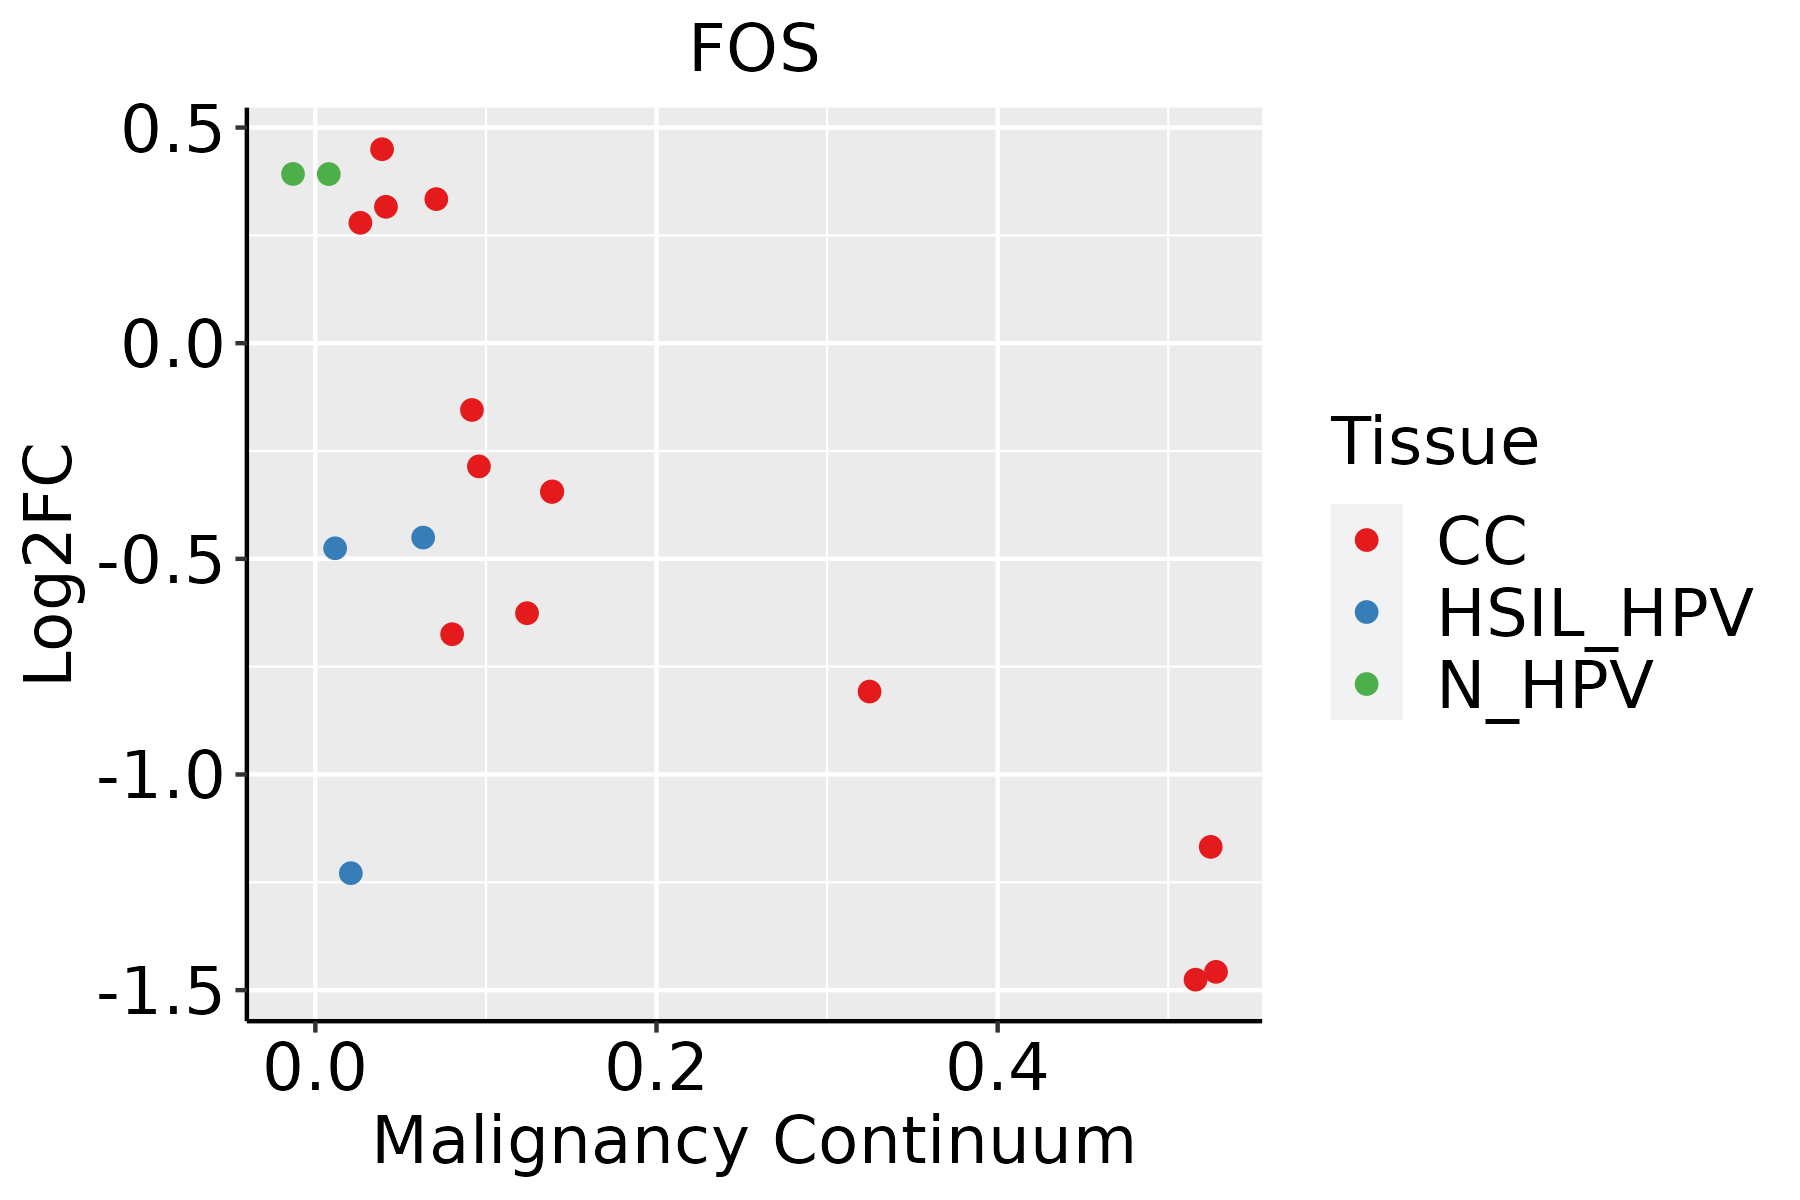 | CC: Cervix cancer |
| HSIL_HPV: HPV-infected high-grade squamous intraepithelial lesions | ||
| N_HPV: HPV-infected normal cervix | ||
| Colorectum (GSE201348) |  | FAP: Familial adenomatous polyposis |
| CRC: Colorectal cancer | ||
| Colorectum (HTA11) |  | AD: Adenomas |
| SER: Sessile serrated lesions | ||
| MSI-H: Microsatellite-high colorectal cancer | ||
| MSS: Microsatellite stable colorectal cancer | ||
| Endometrium | 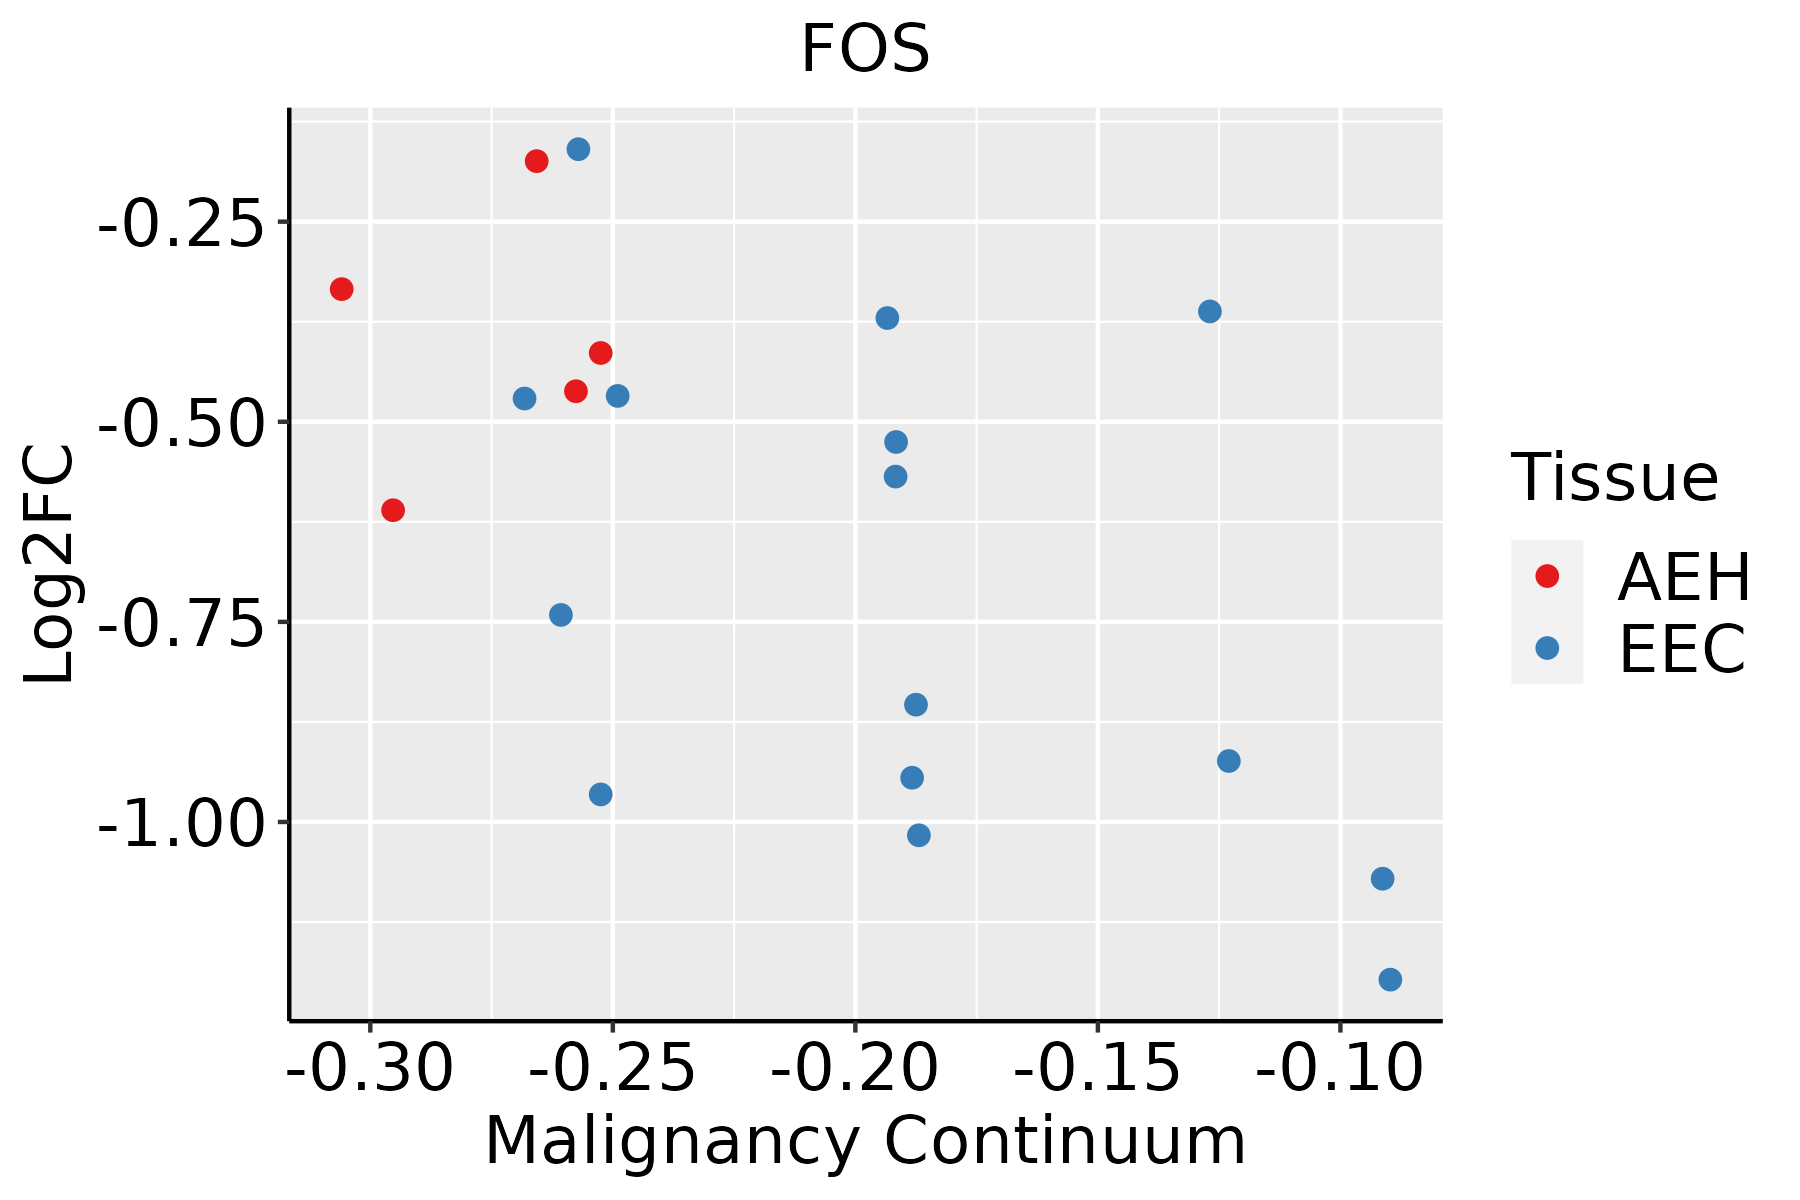 | AEH: Atypical endometrial hyperplasia |
| EEC: Endometrioid Cancer | ||
| Esophagus | 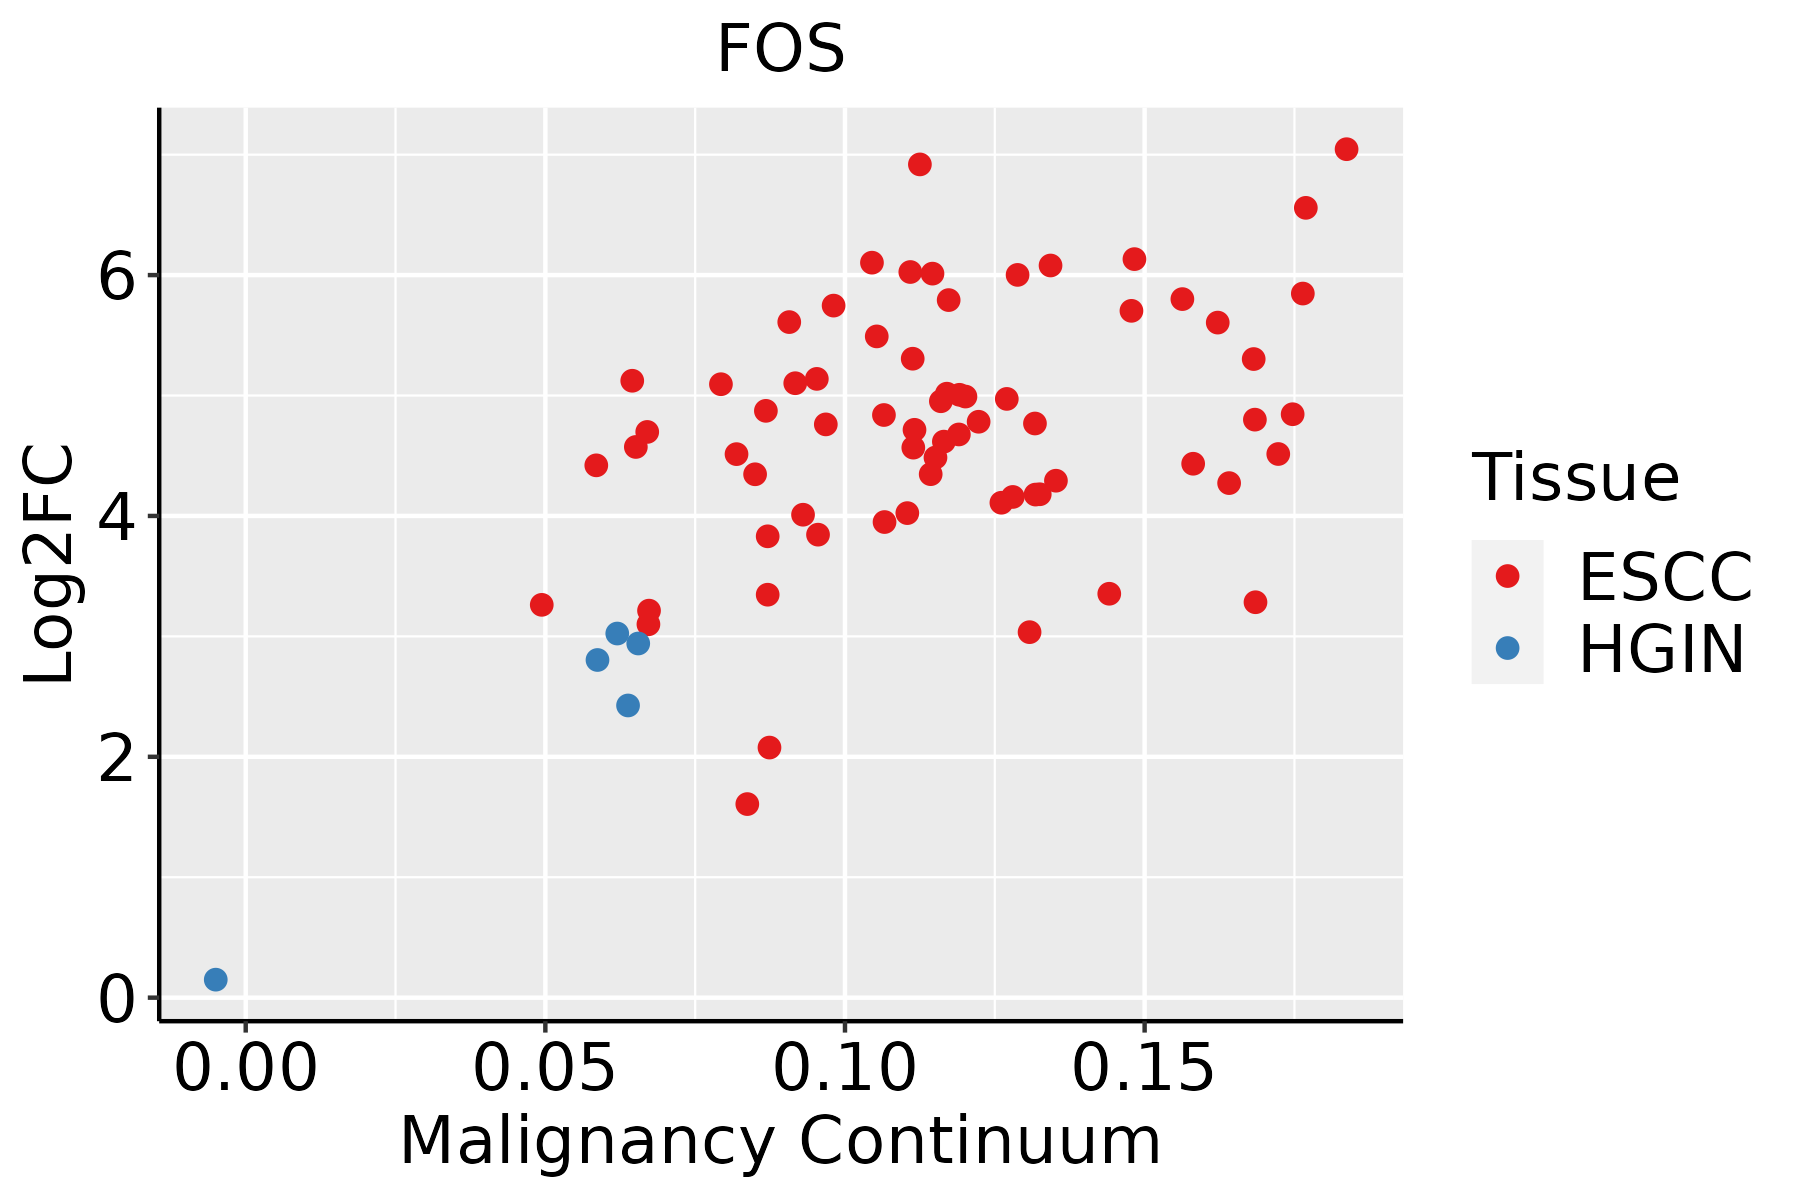 | ESCC: Esophageal squamous cell carcinoma |
| HGIN: High-grade intraepithelial neoplasias | ||
| LGIN: Low-grade intraepithelial neoplasias | ||
| GC | 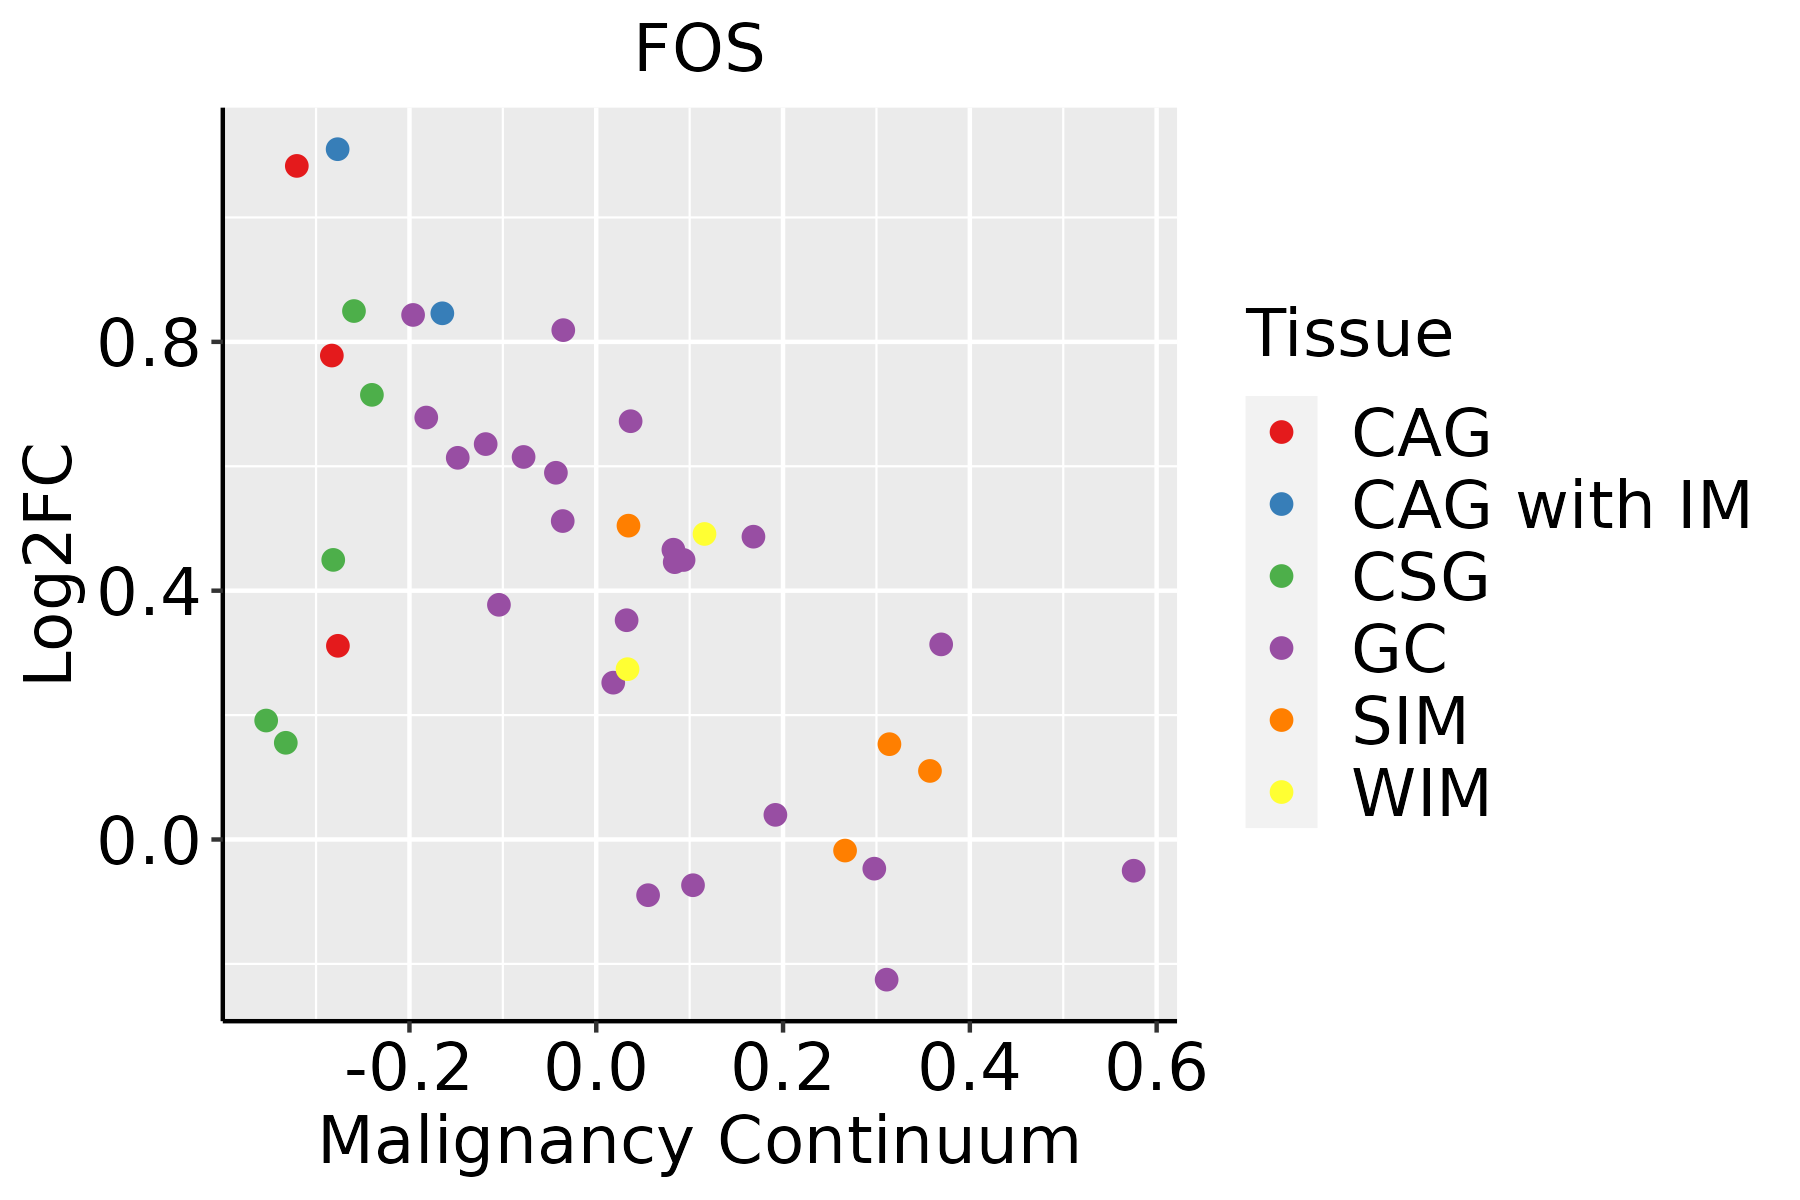 | CAG: Chronic atrophic gastritis |
| CAG with IM: Chronic atrophic gastritis with intestinal metaplasia | ||
| CSG: Chronic superficial gastritis | ||
| GC: Gastric cancer | ||
| SIM: Severe intestinal metaplasia | ||
| WIM: Wild intestinal metaplasia | ||
| Liver | 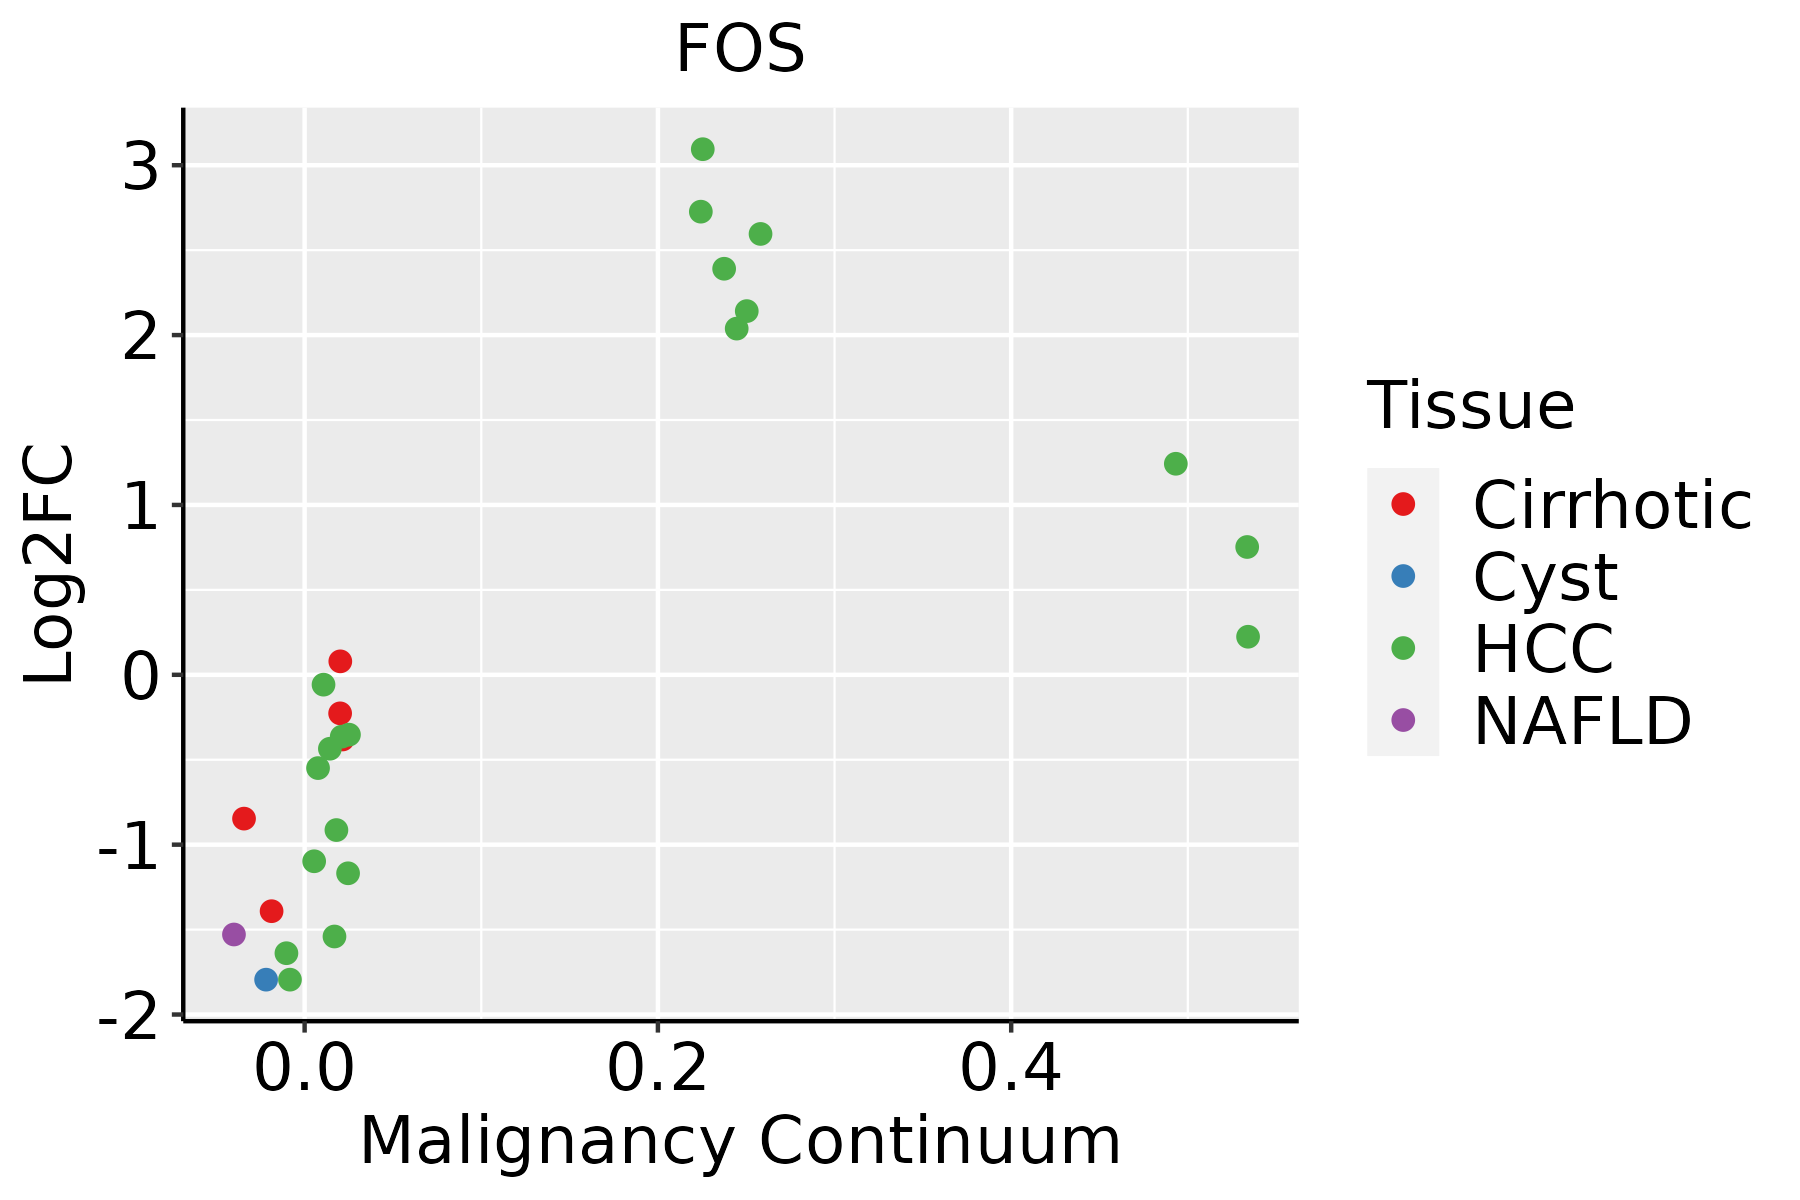 | HCC: Hepatocellular carcinoma |
| NAFLD: Non-alcoholic fatty liver disease | ||
| Lung |  | AAH: Atypical adenomatous hyperplasia |
| AIS: Adenocarcinoma in situ | ||
| IAC: Invasive lung adenocarcinoma | ||
| MIA: Minimally invasive adenocarcinoma | ||
| Oral Cavity |  | EOLP: Erosive Oral lichen planus |
| LP: leukoplakia | ||
| NEOLP: Non-erosive oral lichen planus | ||
| OSCC: Oral squamous cell carcinoma | ||
| Prostate | 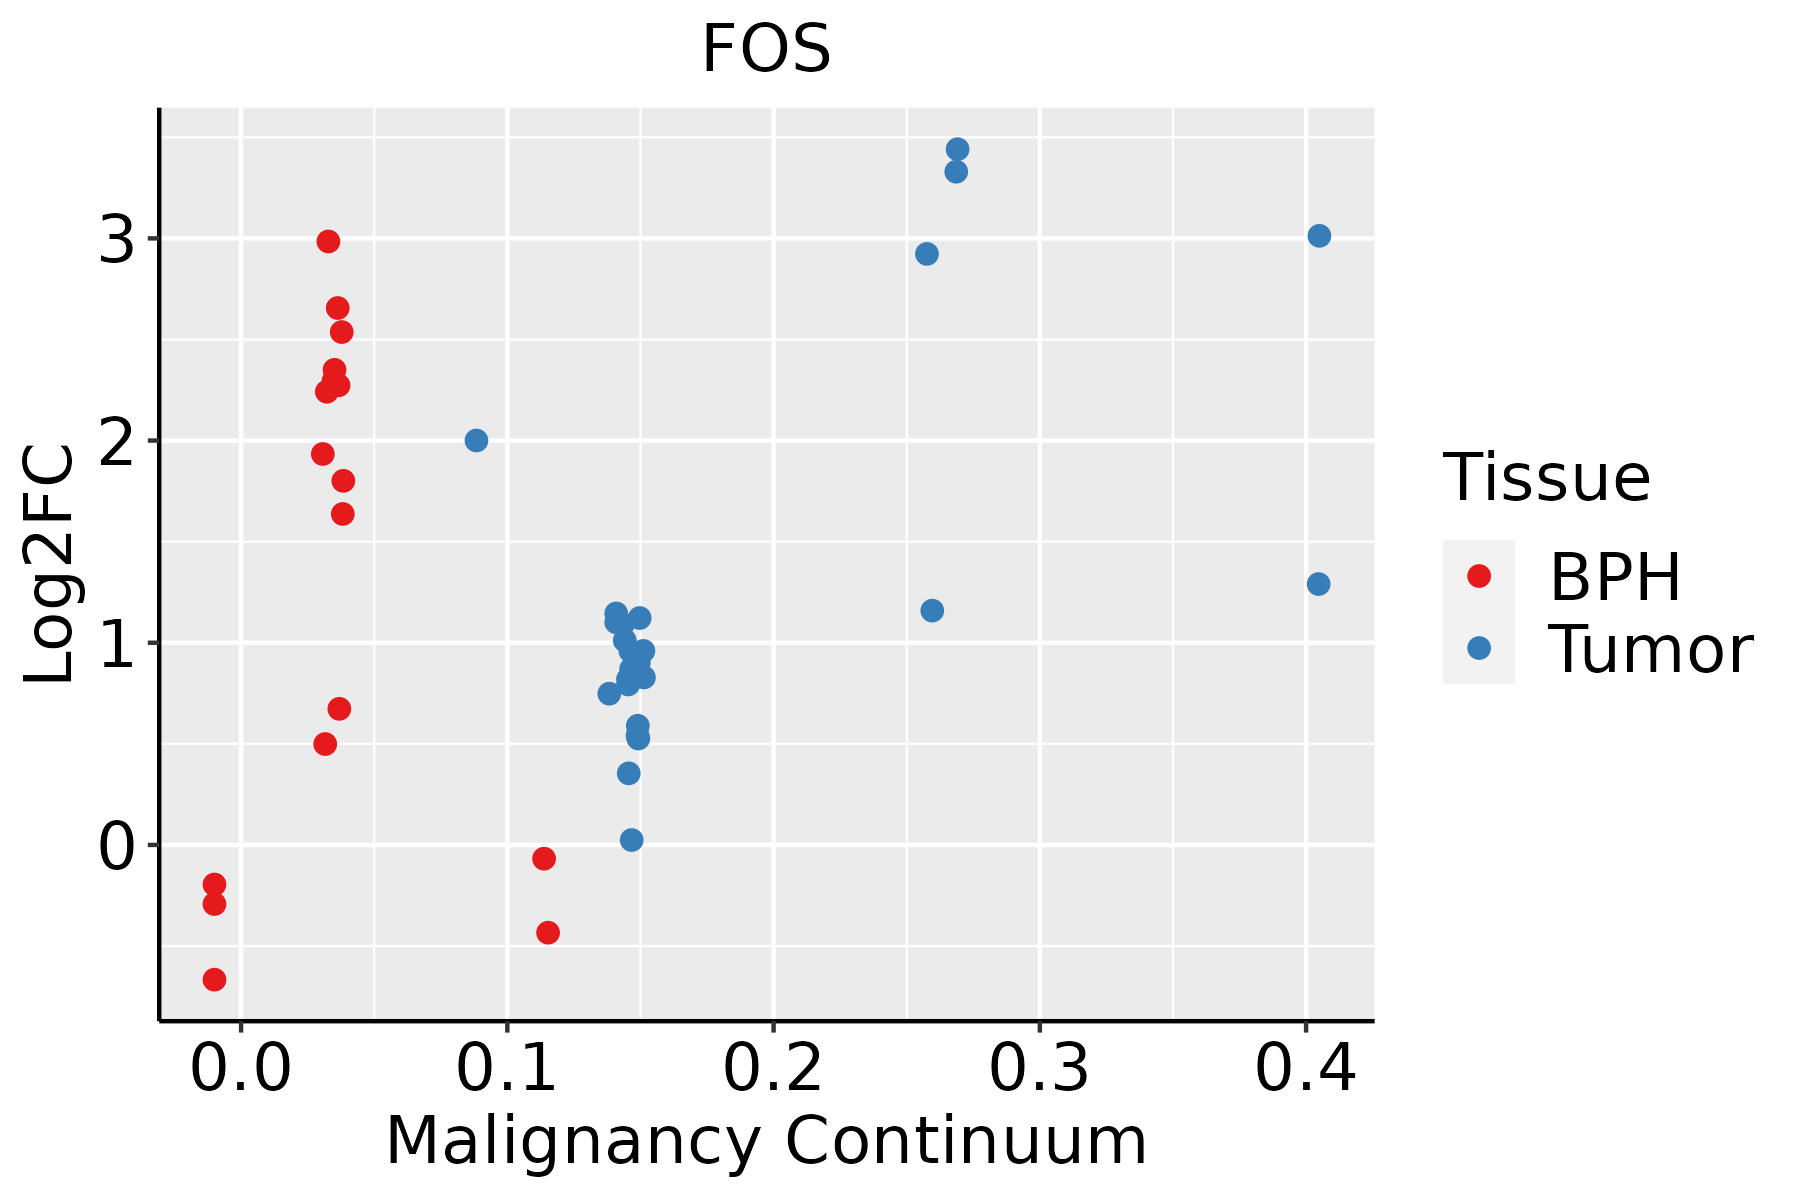 | BPH: Benign Prostatic Hyperplasia |
| Skin | 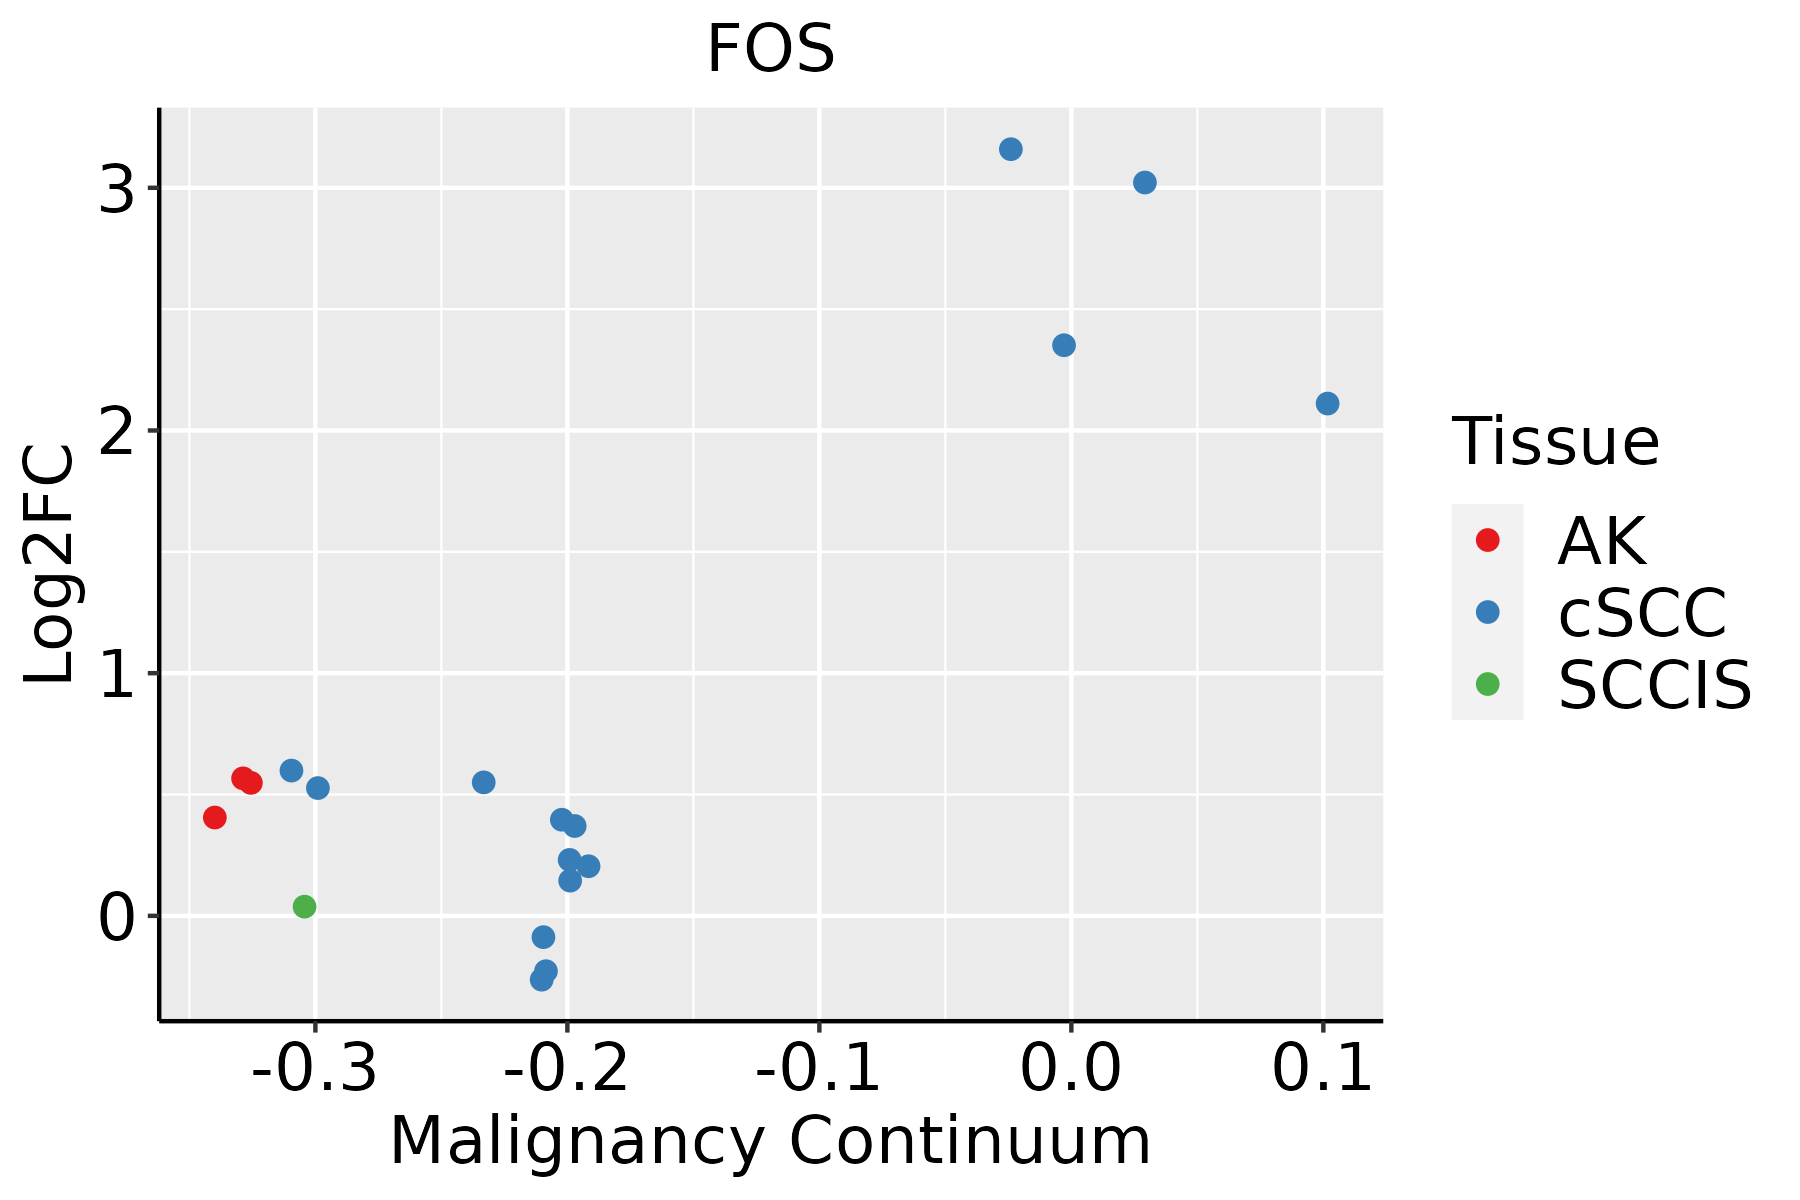 | AK: Actinic keratosis |
| cSCC: Cutaneous squamous cell carcinoma | ||
| SCCIS:squamous cell carcinoma in situ | ||
| Thyroid | 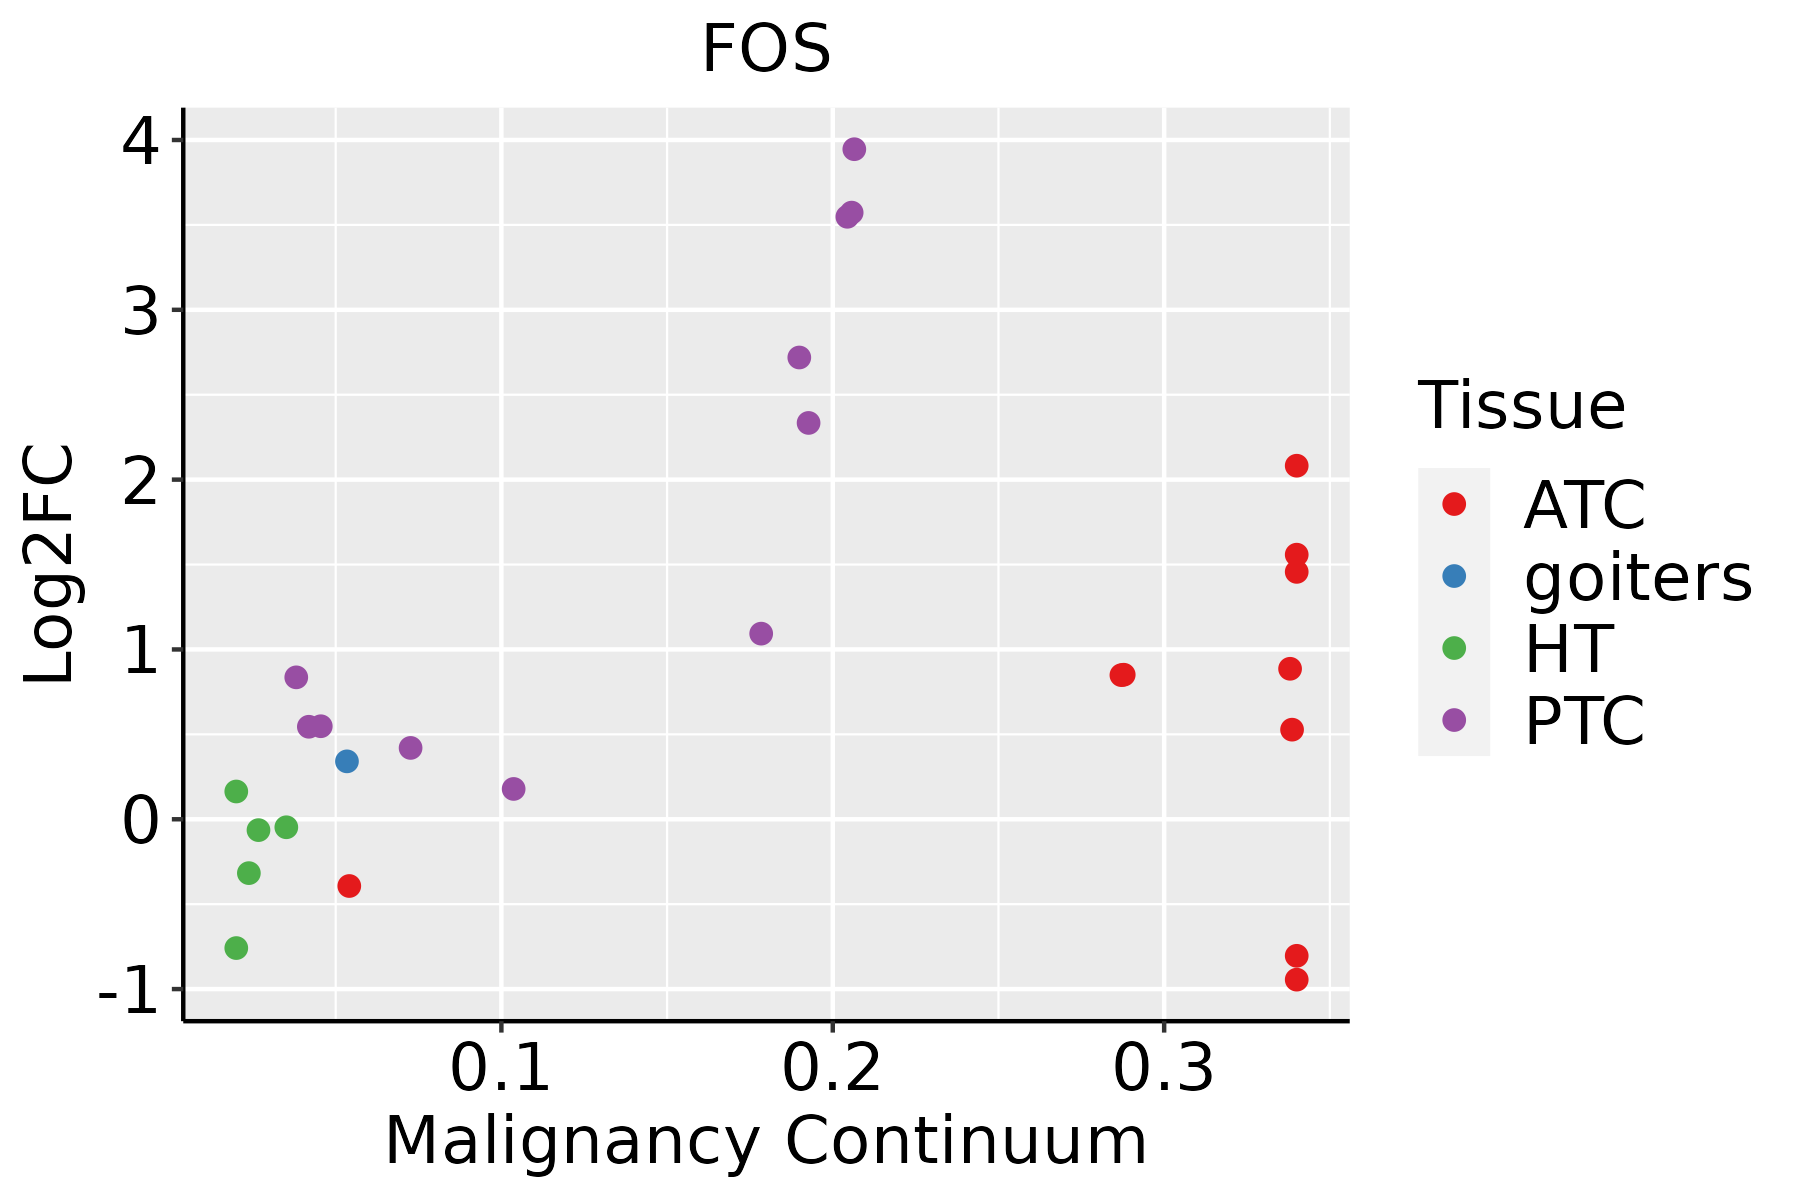 | ATC: Anaplastic thyroid cancer |
| HT: Hashimoto's thyroiditis | ||
| PTC: Papillary thyroid cancer |
| ∗log2FC in expression of this searched gene in stem-like cells from each diseased tissue sample relative to stem-like cells in normal samples in each tissue plotted against the malignancy continuum. Samples are colored based on if they are from different disease stage. |
Top |
Malignant transformation related pathway analysis |
| Find out the enriched GO biological processes and KEGG pathways involved in transition from healthy to precancer to cancer |
| Tissue | Disease Stage | Enriched GO biological Processes |
| Colorectum | AD |  |
| Colorectum | SER |  |
| Colorectum | MSS |  |
| Colorectum | MSI-H |  |
| Colorectum | FAP |  |
| ∗Top 15 enriched GO BP terms are showed in the bar plot of each disease state in each tissue. Each row represents a significant GO biological process which is colored according to the -log10(p.adjust). |
| Page: 1 2 3 4 5 6 7 8 9 |
| GO ID | Tissue | Disease Stage | Description | Gene Ratio | Bg Ratio | pvalue | p.adjust | Count |
| GO:00069799 | Breast | Precancer | response to oxidative stress | 70/1080 | 446/18723 | 1.59e-14 | 4.26e-12 | 70 |
| GO:00485459 | Breast | Precancer | response to steroid hormone | 53/1080 | 339/18723 | 3.07e-11 | 3.66e-09 | 53 |
| GO:00621979 | Breast | Precancer | cellular response to chemical stress | 51/1080 | 337/18723 | 2.40e-10 | 2.34e-08 | 51 |
| GO:00003029 | Breast | Precancer | response to reactive oxygen species | 38/1080 | 222/18723 | 1.47e-09 | 1.23e-07 | 38 |
| GO:00709979 | Breast | Precancer | neuron death | 50/1080 | 361/18723 | 7.75e-09 | 5.70e-07 | 50 |
| GO:00319608 | Breast | Precancer | response to corticosteroid | 30/1080 | 167/18723 | 2.50e-08 | 1.65e-06 | 30 |
| GO:00345999 | Breast | Precancer | cellular response to oxidative stress | 42/1080 | 288/18723 | 2.78e-08 | 1.79e-06 | 42 |
| GO:00513848 | Breast | Precancer | response to glucocorticoid | 26/1080 | 148/18723 | 3.32e-07 | 1.57e-05 | 26 |
| GO:00100389 | Breast | Precancer | response to metal ion | 47/1080 | 373/18723 | 3.88e-07 | 1.79e-05 | 47 |
| GO:19012149 | Breast | Precancer | regulation of neuron death | 41/1080 | 319/18723 | 1.27e-06 | 4.80e-05 | 41 |
| GO:00075653 | Breast | Precancer | female pregnancy | 29/1080 | 193/18723 | 2.07e-06 | 7.31e-05 | 29 |
| GO:00447063 | Breast | Precancer | multi-multicellular organism process | 31/1080 | 220/18723 | 3.73e-06 | 1.19e-04 | 31 |
| GO:00092667 | Breast | Precancer | response to temperature stimulus | 27/1080 | 178/18723 | 3.85e-06 | 1.21e-04 | 27 |
| GO:00300999 | Breast | Precancer | myeloid cell differentiation | 45/1080 | 381/18723 | 4.00e-06 | 1.25e-04 | 45 |
| GO:00075688 | Breast | Precancer | aging | 41/1080 | 339/18723 | 5.95e-06 | 1.71e-04 | 41 |
| GO:00022378 | Breast | Precancer | response to molecule of bacterial origin | 43/1080 | 363/18723 | 6.05e-06 | 1.72e-04 | 43 |
| GO:00324968 | Breast | Precancer | response to lipopolysaccharide | 41/1080 | 343/18723 | 7.94e-06 | 2.17e-04 | 41 |
| GO:00466868 | Breast | Precancer | response to cadmium ion | 14/1080 | 68/18723 | 2.74e-05 | 6.21e-04 | 14 |
| GO:00346149 | Breast | Precancer | cellular response to reactive oxygen species | 23/1080 | 155/18723 | 2.82e-05 | 6.31e-04 | 23 |
| GO:00456379 | Breast | Precancer | regulation of myeloid cell differentiation | 28/1080 | 210/18723 | 3.05e-05 | 6.72e-04 | 28 |
| Page: 1 2 3 4 5 6 7 8 9 10 11 12 13 14 15 16 17 18 19 20 21 22 23 24 25 26 27 28 29 30 31 32 33 34 35 36 37 38 39 40 41 42 43 44 45 46 47 48 49 50 51 52 53 54 55 56 57 58 59 60 61 62 63 64 65 66 67 68 69 70 71 72 73 74 75 76 77 78 79 80 81 82 83 84 85 |
| Pathway ID | Tissue | Disease Stage | Description | Gene Ratio | Bg Ratio | pvalue | p.adjust | qvalue | Count |
| hsa0493210 | Stomach | SIM | Non-alcoholic fatty liver disease | 38/465 | 155/8465 | 1.79e-15 | 1.09e-13 | 8.74e-14 | 38 |
| hsa0541710 | Stomach | SIM | Lipid and atherosclerosis | 34/465 | 215/8465 | 1.80e-08 | 4.20e-07 | 3.37e-07 | 34 |
| hsa05130101 | Stomach | SIM | Pathogenic Escherichia coli infection | 31/465 | 197/8465 | 8.76e-08 | 1.66e-06 | 1.34e-06 | 31 |
| hsa05418101 | Stomach | SIM | Fluid shear stress and atherosclerosis | 25/465 | 139/8465 | 1.16e-07 | 2.07e-06 | 1.66e-06 | 25 |
| hsa05132101 | Stomach | SIM | Salmonella infection | 32/465 | 249/8465 | 5.48e-06 | 7.57e-05 | 6.08e-05 | 32 |
| hsa0516610 | Stomach | SIM | Human T-cell leukemia virus 1 infection | 28/465 | 222/8465 | 3.02e-05 | 3.82e-04 | 3.07e-04 | 28 |
| hsa0465710 | Stomach | SIM | IL-17 signaling pathway | 16/465 | 94/8465 | 4.58e-05 | 5.57e-04 | 4.47e-04 | 16 |
| hsa0491510 | Stomach | SIM | Estrogen signaling pathway | 20/465 | 138/8465 | 5.98e-05 | 6.73e-04 | 5.40e-04 | 20 |
| hsa053238 | Stomach | SIM | Rheumatoid arthritis | 13/465 | 93/8465 | 1.61e-03 | 1.28e-02 | 1.03e-02 | 13 |
| hsa0516710 | Stomach | SIM | Kaposi sarcoma-associated herpesvirus infection | 21/465 | 194/8465 | 2.18e-03 | 1.54e-02 | 1.24e-02 | 21 |
| hsa051408 | Stomach | SIM | Leishmaniasis | 11/465 | 77/8465 | 3.04e-03 | 2.01e-02 | 1.61e-02 | 11 |
| hsa05171111 | Stomach | SIM | Coronavirus disease - COVID-19 | 65/465 | 232/8465 | 1.47e-29 | 2.23e-27 | 1.79e-27 | 65 |
| hsa05208111 | Stomach | SIM | Chemical carcinogenesis - reactive oxygen species | 48/465 | 223/8465 | 8.30e-17 | 8.41e-15 | 6.75e-15 | 48 |
| hsa0493211 | Stomach | SIM | Non-alcoholic fatty liver disease | 38/465 | 155/8465 | 1.79e-15 | 1.09e-13 | 8.74e-14 | 38 |
| hsa0541711 | Stomach | SIM | Lipid and atherosclerosis | 34/465 | 215/8465 | 1.80e-08 | 4.20e-07 | 3.37e-07 | 34 |
| hsa05130111 | Stomach | SIM | Pathogenic Escherichia coli infection | 31/465 | 197/8465 | 8.76e-08 | 1.66e-06 | 1.34e-06 | 31 |
| hsa05418111 | Stomach | SIM | Fluid shear stress and atherosclerosis | 25/465 | 139/8465 | 1.16e-07 | 2.07e-06 | 1.66e-06 | 25 |
| hsa05132111 | Stomach | SIM | Salmonella infection | 32/465 | 249/8465 | 5.48e-06 | 7.57e-05 | 6.08e-05 | 32 |
| hsa0516611 | Stomach | SIM | Human T-cell leukemia virus 1 infection | 28/465 | 222/8465 | 3.02e-05 | 3.82e-04 | 3.07e-04 | 28 |
| hsa0465711 | Stomach | SIM | IL-17 signaling pathway | 16/465 | 94/8465 | 4.58e-05 | 5.57e-04 | 4.47e-04 | 16 |
| Page: 1 2 3 4 5 6 7 8 9 10 11 12 13 14 15 16 17 18 19 20 21 22 23 24 25 26 27 28 29 30 31 32 33 34 35 36 37 38 39 40 41 42 43 44 45 46 47 48 49 50 51 52 53 |
Top |
Cell-cell communication analysis |
| Identification of potential cell-cell interactions between two cell types and their ligand-receptor pairs for different disease states |
| Ligand | Receptor | LRpair | Pathway | Tissue | Disease Stage |
| Page: 1 |
Top |
Single-cell gene regulatory network inference analysis |
| Find out the significant the regulons (TFs) and the target genes of each regulon across cell types for different disease states |
| TF | Cell Type | Tissue | Disease Stage | Target Gene | RSS | Regulon Activity |
| FOS | MON | Colorectum | MSS | DUSP1,FOSB,ZFP36, etc. | 4.98e-01 |  |
| FOS | NEUT | Esophagus | Healthy | JUN,DUSP1,HSPA1B, etc. | 7.23e-01 |  |
| FOS | STM | Liver | Cirrhotic | JUNB,NR4A1,DUSP1, etc. | 3.72e-01 |  |
| FOS | STM | Oral cavity | EOLP | JUN,HSPA1A,HSPA1B, etc. | 8.08e-01 |  |
| FOS | STM | Oral cavity | NEOLP | JUN,HSPA1A,HSPA1B, etc. | 8.16e-01 |  |
| ∗The dot plots of a searched regulon are shown for all cell subpopulations in each disease state of each tissue based on the regulon specific score inferred using pySCENIC and by calculating the average expression. |
| Page: 1 |
Top |
Somatic mutation of malignant transformation related genes |
| Annotation of somatic variants for genes involved in malignant transformation |
| Hugo Symbol | Variant Class | Variant Classification | dbSNP RS | HGVSc | HGVSp | HGVSp Short | SWISSPROT | BIOTYPE | SIFT | PolyPhen | Tumor Sample Barcode | Tissue | Histology | Sex | Age | Stage | Therapy Types | Drugs | Outcome |
| FOS | SNV | Missense_Mutation | rs771351750 | c.428N>A | p.Arg143Gln | p.R143Q | P01100 | protein_coding | deleterious(0) | probably_damaging(0.998) | TCGA-AN-A046-01 | Breast | breast invasive carcinoma | Female | >=65 | I/II | Unknown | Unknown | SD |
| FOS | SNV | Missense_Mutation | novel | c.11N>T | p.Ser4Leu | p.S4L | P01100 | protein_coding | tolerated(0.05) | benign(0.012) | TCGA-E2-A9RU-01 | Breast | breast invasive carcinoma | Female | >=65 | III/IV | Hormone Therapy | arimidex | SD |
| FOS | insertion | Frame_Shift_Ins | novel | c.807_808insCCATCCCAACTCA | p.Asp270ProfsTer6 | p.D270Pfs*6 | P01100 | protein_coding | TCGA-A8-A07P-01 | Breast | breast invasive carcinoma | Female | >=65 | I/II | Chemotherapy | 5-fluorouracil | SD | ||
| FOS | SNV | Missense_Mutation | c.755N>T | p.Ser252Leu | p.S252L | P01100 | protein_coding | tolerated(0.16) | benign(0.017) | TCGA-DG-A2KM-01 | Cervix | cervical & endocervical cancer | Female | <65 | I/II | Chemotherapy | cisplatin | SD | |
| FOS | SNV | Missense_Mutation | c.447N>A | p.Met149Ile | p.M149I | P01100 | protein_coding | tolerated(0.38) | possibly_damaging(0.62) | TCGA-EK-A2RC-01 | Cervix | cervical & endocervical cancer | Female | <65 | I/II | Unknown | Unknown | SD | |
| FOS | deletion | In_Frame_Del | novel | c.108_110delNNN | p.Phe37del | p.F37del | P01100 | protein_coding | TCGA-EA-A410-01 | Cervix | cervical & endocervical cancer | Female | <65 | I/II | Unknown | Unknown | SD | ||
| FOS | SNV | Missense_Mutation | rs746175046 | c.602N>A | p.Arg201Gln | p.R201Q | P01100 | protein_coding | tolerated(0.69) | benign(0.416) | TCGA-CA-6718-01 | Colorectum | colon adenocarcinoma | Male | <65 | I/II | Unknown | Unknown | PD |
| FOS | SNV | Missense_Mutation | c.161N>T | p.Ala54Val | p.A54V | P01100 | protein_coding | tolerated(0.09) | benign(0.017) | TCGA-NH-A50T-01 | Colorectum | colon adenocarcinoma | Female | >=65 | I/II | Unknown | Unknown | SD | |
| FOS | SNV | Missense_Mutation | c.544G>A | p.Glu182Lys | p.E182K | P01100 | protein_coding | deleterious(0) | probably_damaging(0.996) | TCGA-AG-A002-01 | Colorectum | rectum adenocarcinoma | Male | <65 | I/II | Unknown | Unknown | SD | |
| FOS | SNV | Missense_Mutation | c.544G>A | p.Glu182Lys | p.E182K | P01100 | protein_coding | deleterious(0) | probably_damaging(0.996) | TCGA-DC-5869-01 | Colorectum | rectum adenocarcinoma | Female | <65 | III/IV | Unknown | Unknown | SD |
| Page: 1 2 3 4 5 |
Top |
Related drugs of malignant transformation related genes |
| Identification of chemicals and drugs interact with genes involved in malignant transfromation |
| (DGIdb 4.0) |
| Entrez ID | Symbol | Category | Interaction Types | Drug Claim Name | Drug Name | PMIDs |
| 2353 | FOS | TRANSCRIPTION FACTOR, DRUGGABLE GENOME | SAPONIN | 12451485 | ||
| 2353 | FOS | TRANSCRIPTION FACTOR, DRUGGABLE GENOME | BACLOFEN | BACLOFEN | 11301212 | |
| 2353 | FOS | TRANSCRIPTION FACTOR, DRUGGABLE GENOME | ANTI-INFLAMMATORY DRUGS | 11164833 | ||
| 2353 | FOS | TRANSCRIPTION FACTOR, DRUGGABLE GENOME | INTERLEUKIN-1-BETA | 8677009 | ||
| 2353 | FOS | TRANSCRIPTION FACTOR, DRUGGABLE GENOME | PROTEIN KINASE A INHIBITOR | 9093533 | ||
| 2353 | FOS | TRANSCRIPTION FACTOR, DRUGGABLE GENOME | THROMBIN | THROMBIN | 2119237 | |
| 2353 | FOS | TRANSCRIPTION FACTOR, DRUGGABLE GENOME | MAPK INHIBITORS | 14511403 | ||
| 2353 | FOS | TRANSCRIPTION FACTOR, DRUGGABLE GENOME | BETA-INTERFERON | 2491749 | ||
| 2353 | FOS | TRANSCRIPTION FACTOR, DRUGGABLE GENOME | PACLITAXEL | PACLITAXEL | 9588740 | |
| 2353 | FOS | TRANSCRIPTION FACTOR, DRUGGABLE GENOME | MAGNESIUM SULFATE | 11336444 |
| Page: 1 2 |

Copyright 2023-Present -The University of Texas Health Science Center at Houston |