
|
|||||
|
 | |
| |
| |
| |
| |
| |
|
Gene: PPP2R5E |
Gene summary for PPP2R5E |
| Gene information | Species | Human | Gene symbol | PPP2R5E | Gene ID | 5529 |
| Gene name | protein phosphatase 2 regulatory subunit B'epsilon | |
| Gene Alias | B56E | |
| Cytomap | 14q23.2 | |
| Gene Type | protein-coding | GO ID | GO:0006464 | UniProtAcc | Q16537 |
Top |
Malignant transformation analysis |
| Identification of the aberrant gene expression in precancerous and cancerous lesions by comparing the gene expression of stem-like cells in diseased tissues with normal stem cells |
| Entrez ID | Symbol | Replicates | Species | Organ | Tissue | Adj P-value | Log2FC | Malignancy |
| 5529 | PPP2R5E | N_HPV_1 | Human | Cervix | N_HPV | 1.06e-02 | -1.03e-01 | 0.0079 |
| 5529 | PPP2R5E | CCI_1 | Human | Cervix | CC | 1.68e-03 | 5.76e-01 | 0.528 |
| 5529 | PPP2R5E | CCI_2 | Human | Cervix | CC | 2.06e-09 | 1.03e+00 | 0.5249 |
| 5529 | PPP2R5E | CCI_3 | Human | Cervix | CC | 1.28e-05 | 6.85e-01 | 0.516 |
| 5529 | PPP2R5E | L1 | Human | Cervix | CC | 3.31e-03 | -9.24e-02 | 0.0802 |
| 5529 | PPP2R5E | HTA11_3410_2000001011 | Human | Colorectum | AD | 6.54e-34 | -8.25e-01 | 0.0155 |
| 5529 | PPP2R5E | HTA11_2487_2000001011 | Human | Colorectum | SER | 1.89e-04 | -5.16e-01 | -0.1808 |
| 5529 | PPP2R5E | HTA11_2951_2000001011 | Human | Colorectum | AD | 1.93e-04 | -6.38e-01 | 0.0216 |
| 5529 | PPP2R5E | HTA11_83_2000001011 | Human | Colorectum | SER | 8.81e-04 | -3.51e-01 | -0.1526 |
| 5529 | PPP2R5E | HTA11_9341_2000001011 | Human | Colorectum | SER | 1.29e-03 | -4.02e-01 | -0.00410000000000005 |
| 5529 | PPP2R5E | HTA11_866_3004761011 | Human | Colorectum | AD | 5.40e-10 | -5.57e-01 | 0.096 |
| 5529 | PPP2R5E | HTA11_4255_2000001011 | Human | Colorectum | SER | 3.79e-02 | -3.02e-01 | 0.0446 |
| 5529 | PPP2R5E | HTA11_9408_2000001011 | Human | Colorectum | AD | 4.03e-03 | -5.63e-01 | 0.0451 |
| 5529 | PPP2R5E | HTA11_8622_2000001021 | Human | Colorectum | SER | 5.29e-03 | -6.32e-01 | 0.0528 |
| 5529 | PPP2R5E | HTA11_7696_3000711011 | Human | Colorectum | AD | 1.69e-11 | -5.14e-01 | 0.0674 |
| 5529 | PPP2R5E | HTA11_6818_2000001011 | Human | Colorectum | AD | 2.78e-02 | -4.48e-01 | 0.0112 |
| 5529 | PPP2R5E | HTA11_6818_2000001021 | Human | Colorectum | AD | 6.46e-06 | -5.91e-01 | 0.0588 |
| 5529 | PPP2R5E | HTA11_99999970781_79442 | Human | Colorectum | MSS | 4.53e-18 | -5.85e-01 | 0.294 |
| 5529 | PPP2R5E | HTA11_99999971662_82457 | Human | Colorectum | MSS | 1.19e-34 | -7.02e-01 | 0.3859 |
| 5529 | PPP2R5E | HTA11_99999973899_84307 | Human | Colorectum | MSS | 2.63e-05 | -6.70e-01 | 0.2585 |
| Page: 1 2 3 4 5 6 7 8 9 10 |
| Tissue | Expression Dynamics | Abbreviation |
| Cervix |  | CC: Cervix cancer |
| HSIL_HPV: HPV-infected high-grade squamous intraepithelial lesions | ||
| N_HPV: HPV-infected normal cervix | ||
| Colorectum (GSE201348) |  | FAP: Familial adenomatous polyposis |
| CRC: Colorectal cancer | ||
| Colorectum (HTA11) |  | AD: Adenomas |
| SER: Sessile serrated lesions | ||
| MSI-H: Microsatellite-high colorectal cancer | ||
| MSS: Microsatellite stable colorectal cancer | ||
| Esophagus | 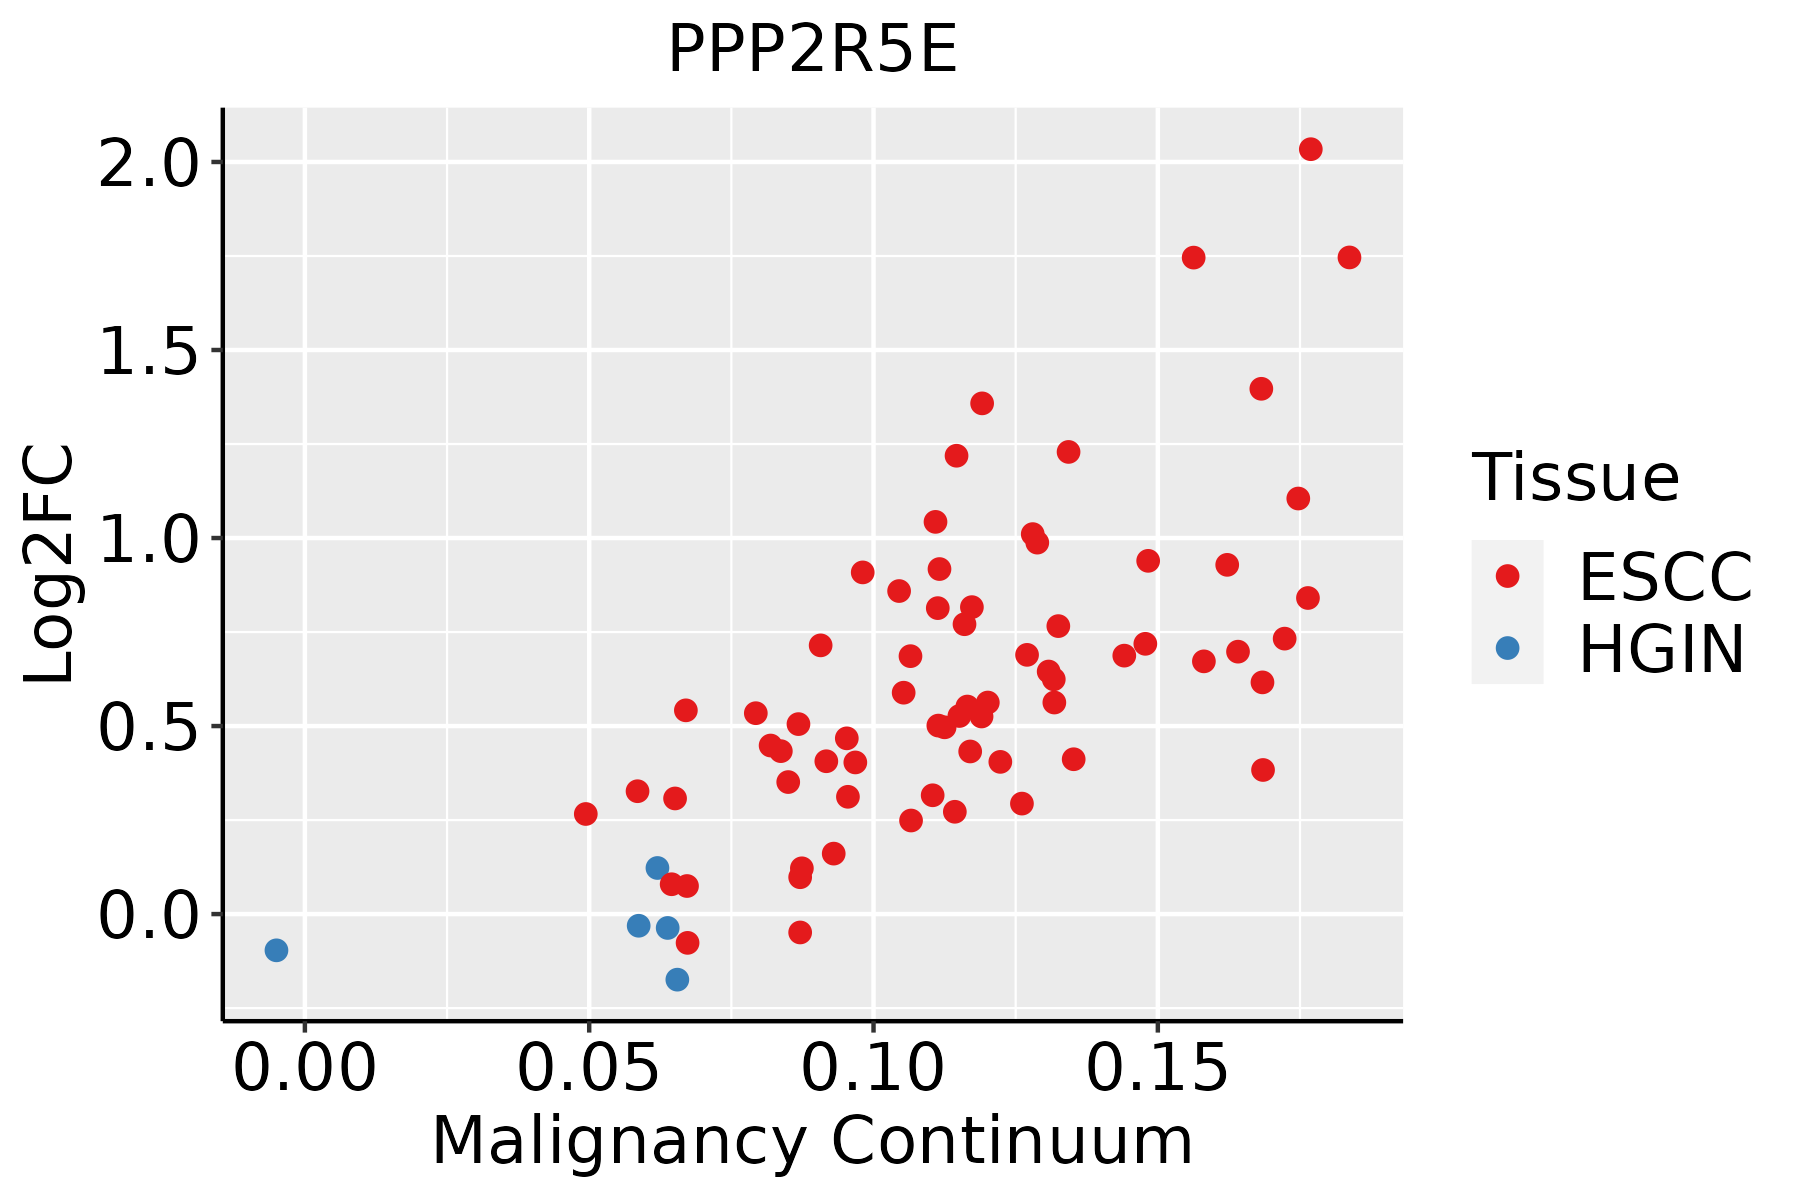 | ESCC: Esophageal squamous cell carcinoma |
| HGIN: High-grade intraepithelial neoplasias | ||
| LGIN: Low-grade intraepithelial neoplasias | ||
| Liver |  | HCC: Hepatocellular carcinoma |
| NAFLD: Non-alcoholic fatty liver disease | ||
| Lung | 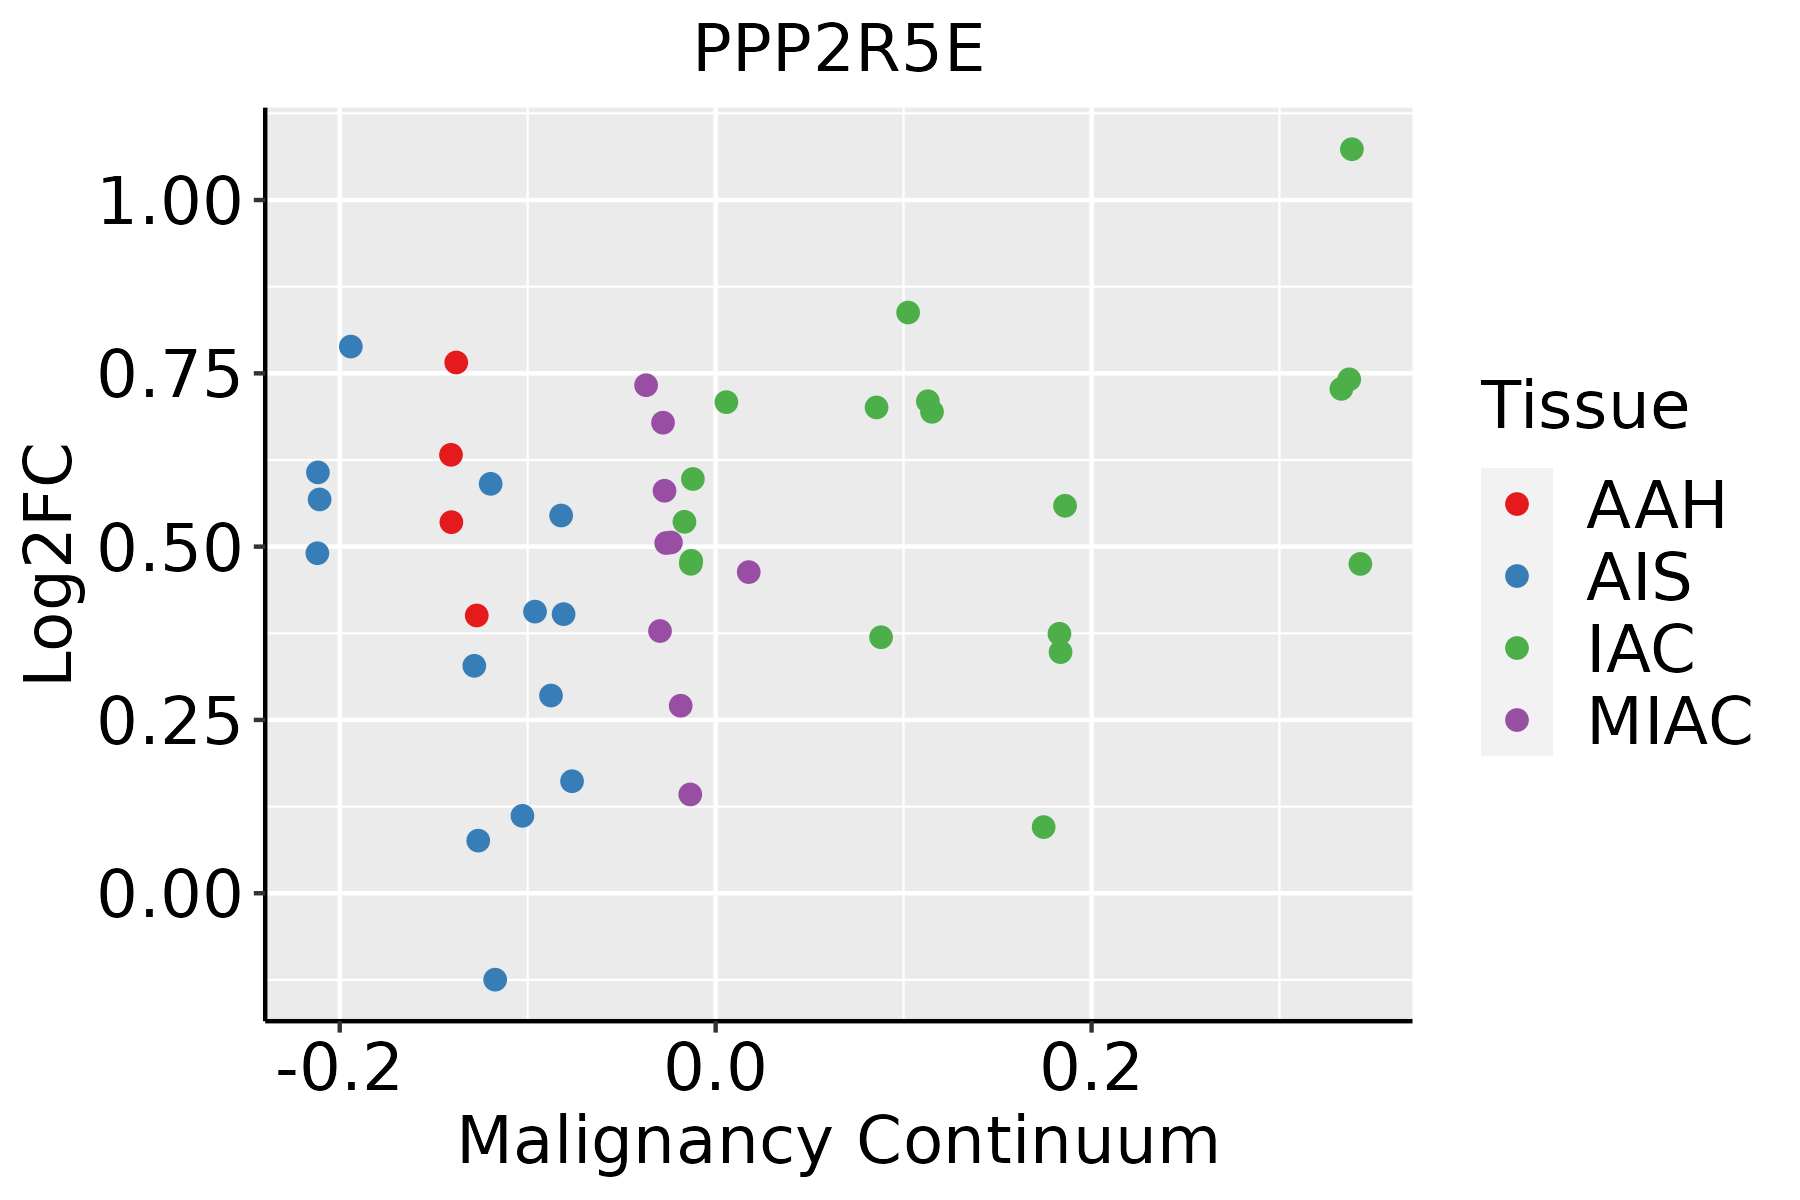 | AAH: Atypical adenomatous hyperplasia |
| AIS: Adenocarcinoma in situ | ||
| IAC: Invasive lung adenocarcinoma | ||
| MIA: Minimally invasive adenocarcinoma | ||
| Oral Cavity | 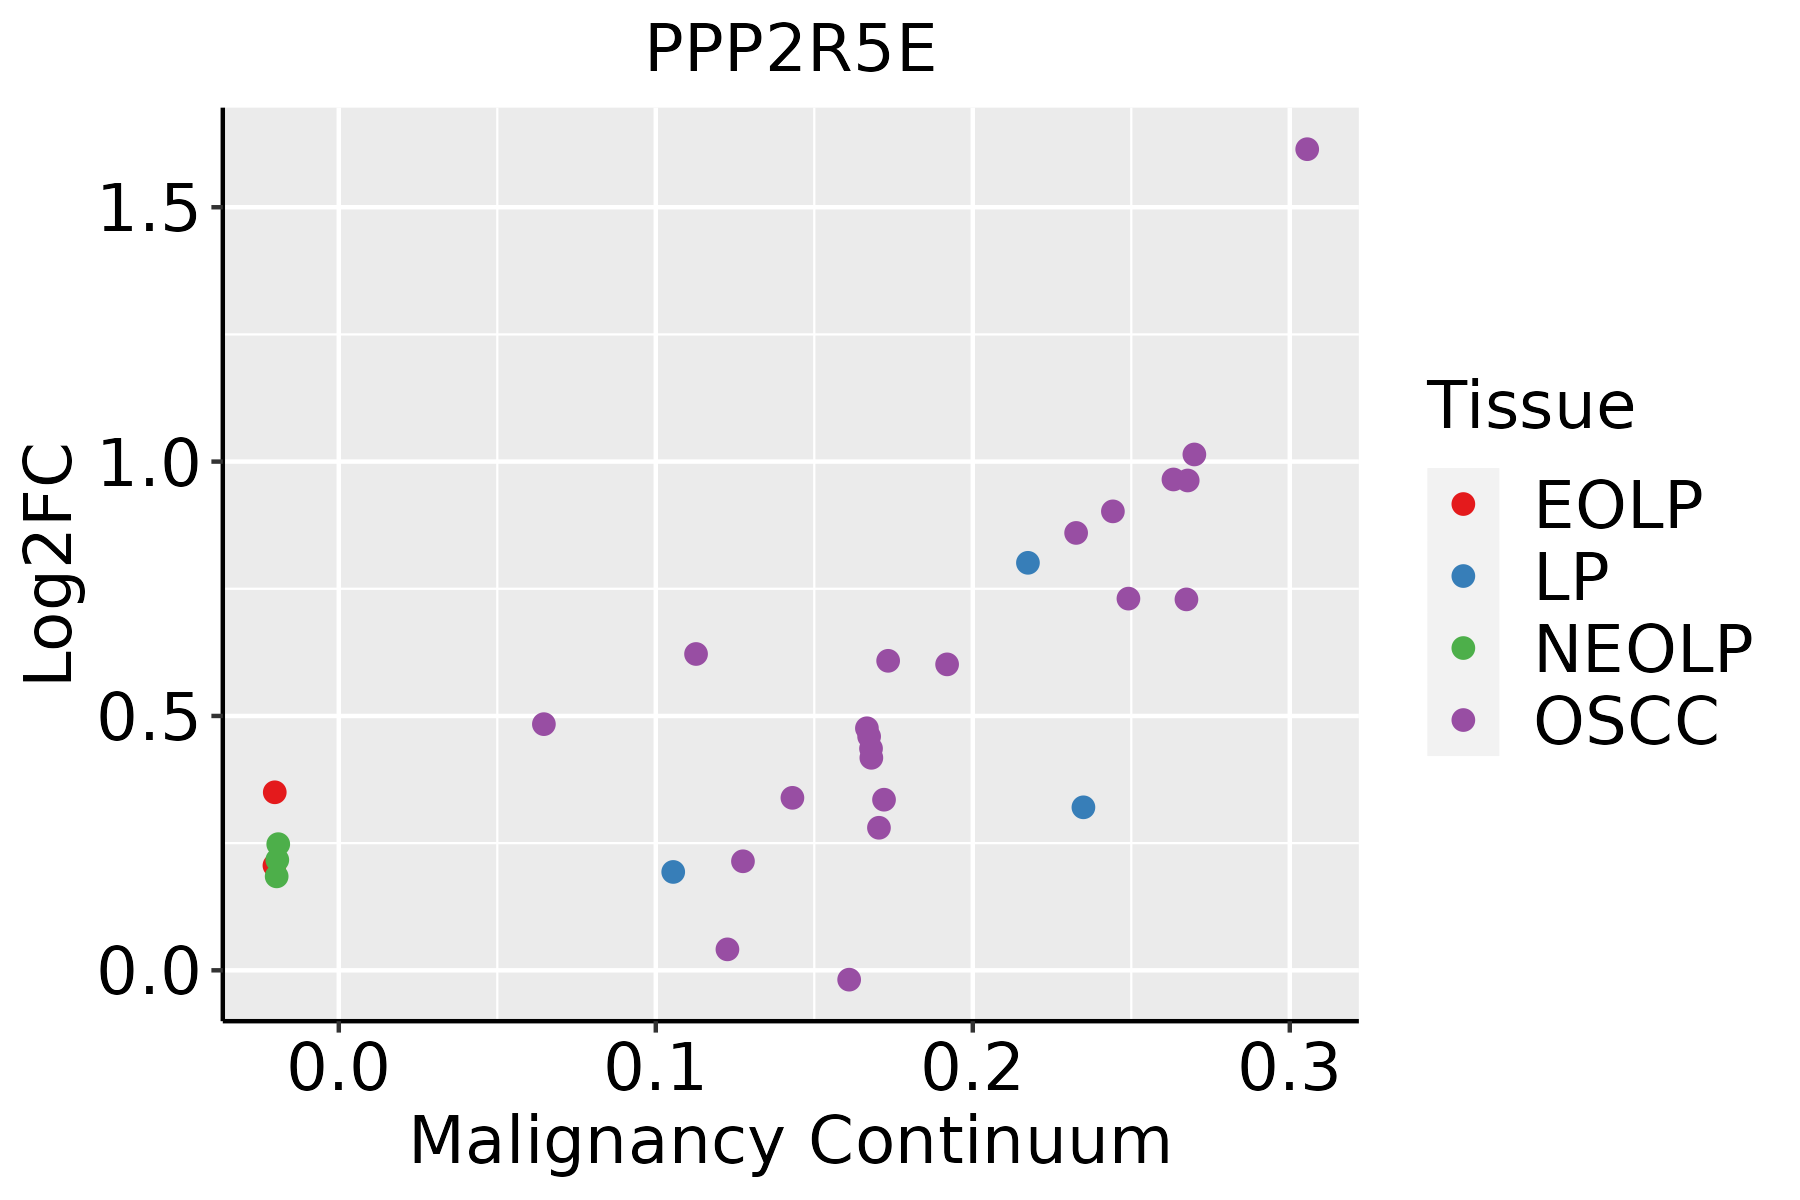 | EOLP: Erosive Oral lichen planus |
| LP: leukoplakia | ||
| NEOLP: Non-erosive oral lichen planus | ||
| OSCC: Oral squamous cell carcinoma | ||
| Skin | 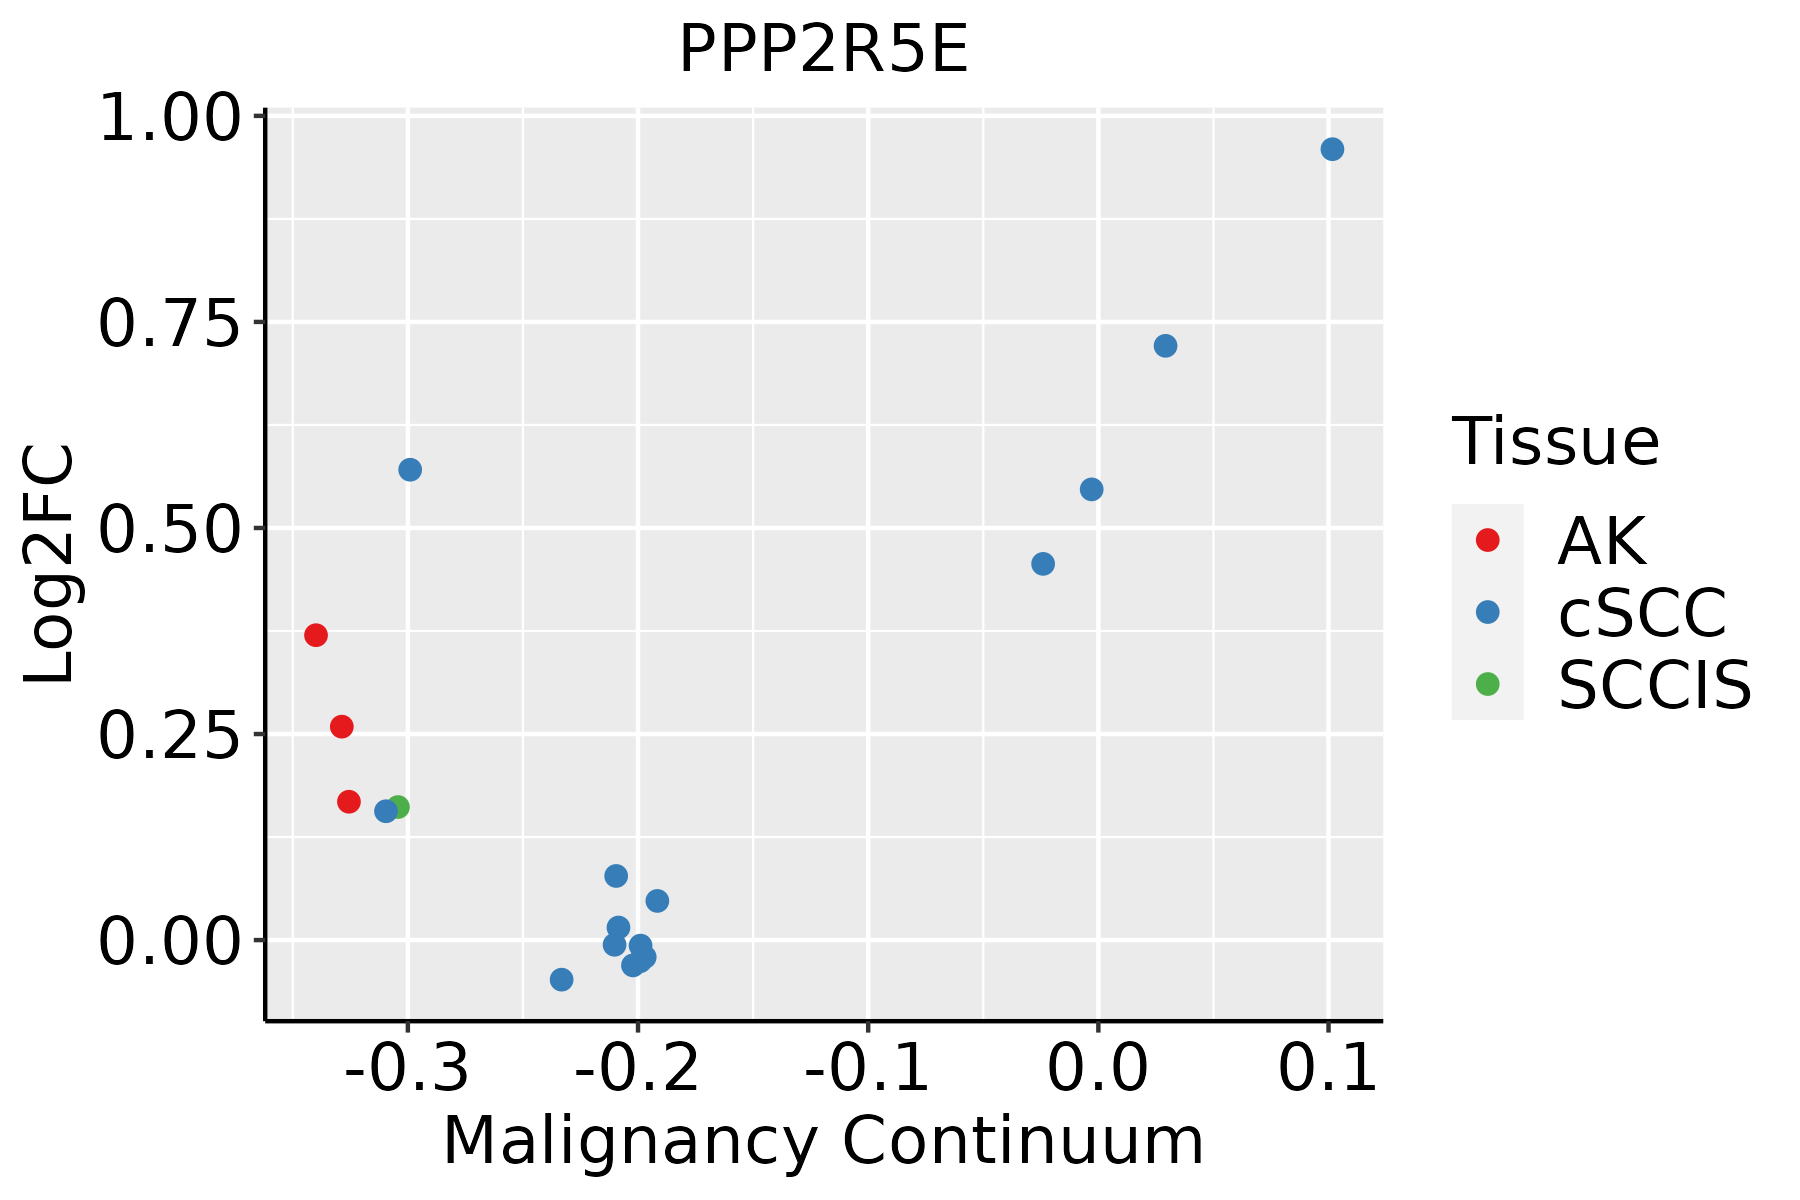 | AK: Actinic keratosis |
| cSCC: Cutaneous squamous cell carcinoma | ||
| SCCIS:squamous cell carcinoma in situ | ||
| Thyroid | 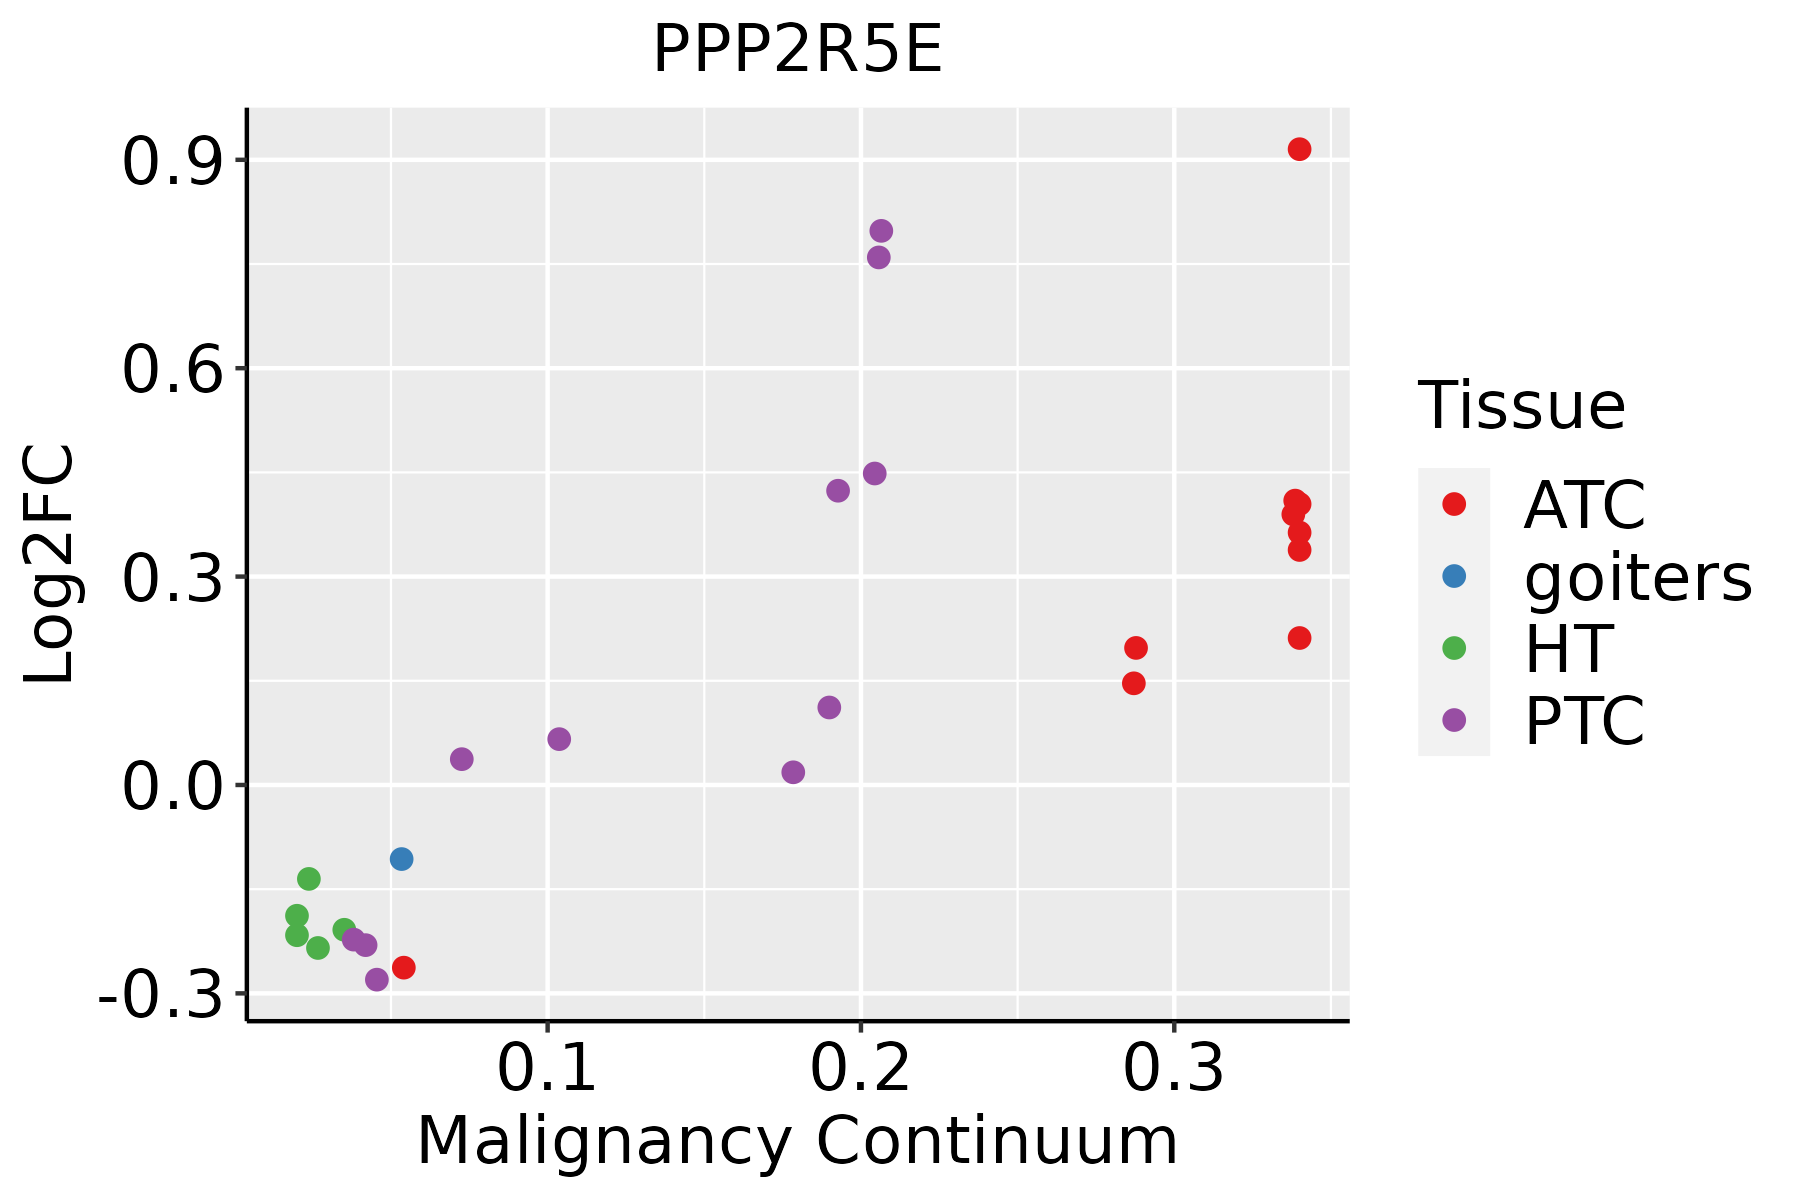 | ATC: Anaplastic thyroid cancer |
| HT: Hashimoto's thyroiditis | ||
| PTC: Papillary thyroid cancer |
| ∗log2FC in expression of this searched gene in stem-like cells from each diseased tissue sample relative to stem-like cells in normal samples in each tissue plotted against the malignancy continuum. Samples are colored based on if they are from different disease stage. |
Top |
Malignant transformation related pathway analysis |
| Find out the enriched GO biological processes and KEGG pathways involved in transition from healthy to precancer to cancer |
| Tissue | Disease Stage | Enriched GO biological Processes |
| Colorectum | AD |  |
| Colorectum | SER |  |
| Colorectum | MSS |  |
| Colorectum | MSI-H |  |
| Colorectum | FAP |  |
| ∗Top 15 enriched GO BP terms are showed in the bar plot of each disease state in each tissue. Each row represents a significant GO biological process which is colored according to the -log10(p.adjust). |
| Page: 1 2 3 4 5 6 7 8 9 |
| GO ID | Tissue | Disease Stage | Description | Gene Ratio | Bg Ratio | pvalue | p.adjust | Count |
| GO:00064708 | Cervix | CC | protein dephosphorylation | 60/2311 | 281/18723 | 1.33e-05 | 2.68e-04 | 60 |
| GO:00163117 | Cervix | CC | dephosphorylation | 73/2311 | 417/18723 | 1.23e-03 | 9.87e-03 | 73 |
| GO:0016311 | Colorectum | AD | dephosphorylation | 123/3918 | 417/18723 | 1.84e-05 | 3.82e-04 | 123 |
| GO:0006470 | Colorectum | AD | protein dephosphorylation | 88/3918 | 281/18723 | 2.56e-05 | 4.89e-04 | 88 |
| GO:00064701 | Colorectum | SER | protein dephosphorylation | 65/2897 | 281/18723 | 4.44e-04 | 6.51e-03 | 65 |
| GO:00163111 | Colorectum | SER | dephosphorylation | 86/2897 | 417/18723 | 2.73e-03 | 2.46e-02 | 86 |
| GO:00064702 | Colorectum | MSS | protein dephosphorylation | 73/3467 | 281/18723 | 1.15e-03 | 1.12e-02 | 73 |
| GO:00163112 | Colorectum | MSS | dephosphorylation | 101/3467 | 417/18723 | 1.98e-03 | 1.70e-02 | 101 |
| GO:00163113 | Colorectum | FAP | dephosphorylation | 95/2622 | 417/18723 | 7.07e-07 | 3.32e-05 | 95 |
| GO:00064704 | Colorectum | FAP | protein dephosphorylation | 69/2622 | 281/18723 | 1.47e-06 | 6.39e-05 | 69 |
| GO:00163114 | Colorectum | CRC | dephosphorylation | 79/2078 | 417/18723 | 1.27e-06 | 7.21e-05 | 79 |
| GO:00064705 | Colorectum | CRC | protein dephosphorylation | 57/2078 | 281/18723 | 4.49e-06 | 1.87e-04 | 57 |
| GO:001631110 | Esophagus | ESCC | dephosphorylation | 251/8552 | 417/18723 | 1.26e-09 | 2.99e-08 | 251 |
| GO:000647018 | Esophagus | ESCC | protein dephosphorylation | 177/8552 | 281/18723 | 3.13e-09 | 6.72e-08 | 177 |
| GO:00163115 | Liver | NAFLD | dephosphorylation | 69/1882 | 417/18723 | 2.27e-05 | 6.23e-04 | 69 |
| GO:00064706 | Liver | NAFLD | protein dephosphorylation | 50/1882 | 281/18723 | 4.53e-05 | 1.09e-03 | 50 |
| GO:000647011 | Liver | Cirrhotic | protein dephosphorylation | 96/4634 | 281/18723 | 2.32e-04 | 2.11e-03 | 96 |
| GO:001631111 | Liver | Cirrhotic | dephosphorylation | 130/4634 | 417/18723 | 1.58e-03 | 1.03e-02 | 130 |
| GO:001631121 | Liver | HCC | dephosphorylation | 230/7958 | 417/18723 | 1.00e-07 | 1.96e-06 | 230 |
| GO:000647021 | Liver | HCC | protein dephosphorylation | 162/7958 | 281/18723 | 1.91e-07 | 3.46e-06 | 162 |
| Page: 1 2 |
| Pathway ID | Tissue | Disease Stage | Description | Gene Ratio | Bg Ratio | pvalue | p.adjust | qvalue | Count |
| hsa051656 | Lung | IAC | Human papillomavirus infection | 71/1053 | 331/8465 | 1.88e-06 | 7.63e-05 | 5.06e-05 | 71 |
| hsa040719 | Lung | IAC | Sphingolipid signaling pathway | 28/1053 | 121/8465 | 7.30e-04 | 6.08e-03 | 4.04e-03 | 28 |
| hsa041514 | Lung | IAC | PI3K-Akt signaling pathway | 60/1053 | 354/8465 | 7.03e-03 | 2.86e-02 | 1.90e-02 | 60 |
| hsa041105 | Lung | IAC | Cell cycle | 30/1053 | 157/8465 | 1.03e-02 | 3.83e-02 | 2.54e-02 | 30 |
| hsa0516511 | Lung | IAC | Human papillomavirus infection | 71/1053 | 331/8465 | 1.88e-06 | 7.63e-05 | 5.06e-05 | 71 |
| hsa0407112 | Lung | IAC | Sphingolipid signaling pathway | 28/1053 | 121/8465 | 7.30e-04 | 6.08e-03 | 4.04e-03 | 28 |
| hsa0415111 | Lung | IAC | PI3K-Akt signaling pathway | 60/1053 | 354/8465 | 7.03e-03 | 2.86e-02 | 1.90e-02 | 60 |
| hsa0411012 | Lung | IAC | Cell cycle | 30/1053 | 157/8465 | 1.03e-02 | 3.83e-02 | 2.54e-02 | 30 |
| hsa0516521 | Lung | AIS | Human papillomavirus infection | 64/961 | 331/8465 | 1.03e-05 | 3.04e-04 | 1.95e-04 | 64 |
| hsa0407121 | Lung | AIS | Sphingolipid signaling pathway | 25/961 | 121/8465 | 2.03e-03 | 1.29e-02 | 8.24e-03 | 25 |
| hsa0415121 | Lung | AIS | PI3K-Akt signaling pathway | 57/961 | 354/8465 | 3.72e-03 | 2.00e-02 | 1.28e-02 | 57 |
| hsa0516531 | Lung | AIS | Human papillomavirus infection | 64/961 | 331/8465 | 1.03e-05 | 3.04e-04 | 1.95e-04 | 64 |
| hsa0407131 | Lung | AIS | Sphingolipid signaling pathway | 25/961 | 121/8465 | 2.03e-03 | 1.29e-02 | 8.24e-03 | 25 |
| hsa0415131 | Lung | AIS | PI3K-Akt signaling pathway | 57/961 | 354/8465 | 3.72e-03 | 2.00e-02 | 1.28e-02 | 57 |
| hsa051654 | Lung | MIAC | Human papillomavirus infection | 32/507 | 331/8465 | 4.78e-03 | 3.49e-02 | 2.52e-02 | 32 |
| hsa051655 | Lung | MIAC | Human papillomavirus infection | 32/507 | 331/8465 | 4.78e-03 | 3.49e-02 | 2.52e-02 | 32 |
| hsa041108 | Oral cavity | OSCC | Cell cycle | 118/3704 | 157/8465 | 7.15e-16 | 2.66e-14 | 1.35e-14 | 118 |
| hsa030158 | Oral cavity | OSCC | mRNA surveillance pathway | 75/3704 | 97/8465 | 1.30e-11 | 2.01e-10 | 1.02e-10 | 75 |
| hsa051659 | Oral cavity | OSCC | Human papillomavirus infection | 200/3704 | 331/8465 | 3.83e-10 | 4.93e-09 | 2.51e-09 | 200 |
| hsa0407114 | Oral cavity | OSCC | Sphingolipid signaling pathway | 82/3704 | 121/8465 | 6.97e-08 | 5.08e-07 | 2.58e-07 | 82 |
| Page: 1 2 3 4 5 6 7 8 |
Top |
Cell-cell communication analysis |
| Identification of potential cell-cell interactions between two cell types and their ligand-receptor pairs for different disease states |
| Ligand | Receptor | LRpair | Pathway | Tissue | Disease Stage |
| Page: 1 |
Top |
Single-cell gene regulatory network inference analysis |
| Find out the significant the regulons (TFs) and the target genes of each regulon across cell types for different disease states |
| TF | Cell Type | Tissue | Disease Stage | Target Gene | RSS | Regulon Activity |
| ∗The dot plots of a searched regulon are shown for all cell subpopulations in each disease state of each tissue based on the regulon specific score inferred using pySCENIC and by calculating the average expression. |
| Page: 1 |
Top |
Somatic mutation of malignant transformation related genes |
| Annotation of somatic variants for genes involved in malignant transformation |
| Hugo Symbol | Variant Class | Variant Classification | dbSNP RS | HGVSc | HGVSp | HGVSp Short | SWISSPROT | BIOTYPE | SIFT | PolyPhen | Tumor Sample Barcode | Tissue | Histology | Sex | Age | Stage | Therapy Types | Drugs | Outcome |
| PPP2R5E | SNV | Missense_Mutation | c.228N>G | p.Phe76Leu | p.F76L | Q16537 | protein_coding | deleterious(0) | probably_damaging(0.999) | TCGA-AC-A23H-01 | Breast | breast invasive carcinoma | Female | >=65 | I/II | Unknown | Unknown | PD | |
| PPP2R5E | SNV | Missense_Mutation | c.1330N>A | p.Glu444Lys | p.E444K | Q16537 | protein_coding | deleterious(0.02) | benign(0.089) | TCGA-BH-A0B5-01 | Breast | breast invasive carcinoma | Female | <65 | III/IV | Chemotherapy | adriamycin | CR | |
| PPP2R5E | deletion | Frame_Shift_Del | novel | c.1148delN | p.Ile383ThrfsTer29 | p.I383Tfs*29 | Q16537 | protein_coding | TCGA-D8-A27V-01 | Breast | breast invasive carcinoma | Female | <65 | I/II | Hormone Therapy | tamoxiphen | SD | ||
| PPP2R5E | SNV | Missense_Mutation | c.43N>C | p.Asp15His | p.D15H | Q16537 | protein_coding | deleterious(0.02) | probably_damaging(0.935) | TCGA-IR-A3LL-01 | Cervix | cervical & endocervical cancer | Female | <65 | I/II | Chemotherapy | cisplatin | CR | |
| PPP2R5E | SNV | Missense_Mutation | c.1226A>G | p.Asn409Ser | p.N409S | Q16537 | protein_coding | deleterious(0) | possibly_damaging(0.749) | TCGA-JW-A5VJ-01 | Cervix | cervical & endocervical cancer | Female | <65 | I/II | Unknown | Unknown | PD | |
| PPP2R5E | SNV | Missense_Mutation | c.331A>G | p.Thr111Ala | p.T111A | Q16537 | protein_coding | tolerated(0.24) | benign(0.001) | TCGA-AA-3663-01 | Colorectum | colon adenocarcinoma | Male | <65 | I/II | Unknown | Unknown | SD | |
| PPP2R5E | SNV | Missense_Mutation | c.10G>A | p.Ala4Thr | p.A4T | Q16537 | protein_coding | tolerated_low_confidence(0.46) | benign(0.001) | TCGA-AD-6895-01 | Colorectum | colon adenocarcinoma | Male | >=65 | III/IV | Unknown | Unknown | SD | |
| PPP2R5E | SNV | Missense_Mutation | novel | c.614G>T | p.Arg205Ile | p.R205I | Q16537 | protein_coding | deleterious(0) | probably_damaging(1) | TCGA-CA-6717-01 | Colorectum | colon adenocarcinoma | Male | <65 | I/II | Chemotherapy | oxaliplatin | CR |
| PPP2R5E | SNV | Missense_Mutation | c.7N>C | p.Ser3Pro | p.S3P | Q16537 | protein_coding | tolerated_low_confidence(0.08) | benign(0) | TCGA-D5-6541-01 | Colorectum | colon adenocarcinoma | Male | <65 | I/II | Unknown | Unknown | SD | |
| PPP2R5E | SNV | Missense_Mutation | novel | c.824G>A | p.Arg275Lys | p.R275K | Q16537 | protein_coding | tolerated(1) | benign(0.023) | TCGA-A5-A0G2-01 | Endometrium | uterine corpus endometrioid carcinoma | Female | <65 | III/IV | Unknown | Unknown | SD |
| Page: 1 2 3 4 5 6 |
Top |
Related drugs of malignant transformation related genes |
| Identification of chemicals and drugs interact with genes involved in malignant transfromation |
| (DGIdb 4.0) |
| Entrez ID | Symbol | Category | Interaction Types | Drug Claim Name | Drug Name | PMIDs |
| Page: 1 |

Copyright 2023-Present -The University of Texas Health Science Center at Houston |