
|
|||||
|
 | |
| |
| |
| |
| |
| |
|
Gene: PFN1 |
Gene summary for PFN1 |
| Gene information | Species | Human | Gene symbol | PFN1 | Gene ID | 5216 |
| Gene name | profilin 1 | |
| Gene Alias | ALS18 | |
| Cytomap | 17p13.2 | |
| Gene Type | protein-coding | GO ID | GO:0001667 | UniProtAcc | P07737 |
Top |
Malignant transformation analysis |
| Identification of the aberrant gene expression in precancerous and cancerous lesions by comparing the gene expression of stem-like cells in diseased tissues with normal stem cells |
| Entrez ID | Symbol | Replicates | Species | Organ | Tissue | Adj P-value | Log2FC | Malignancy |
| 5216 | PFN1 | GSM4909281 | Human | Breast | IDC | 1.34e-06 | 2.42e-01 | 0.21 |
| 5216 | PFN1 | GSM4909282 | Human | Breast | IDC | 2.68e-02 | 1.98e-01 | -0.0288 |
| 5216 | PFN1 | GSM4909285 | Human | Breast | IDC | 1.13e-03 | 2.25e-01 | 0.21 |
| 5216 | PFN1 | GSM4909286 | Human | Breast | IDC | 4.52e-46 | -6.45e-01 | 0.1081 |
| 5216 | PFN1 | GSM4909288 | Human | Breast | IDC | 1.43e-03 | -4.62e-01 | 0.0988 |
| 5216 | PFN1 | GSM4909292 | Human | Breast | IDC | 1.10e-04 | -8.23e-01 | 0.1236 |
| 5216 | PFN1 | GSM4909293 | Human | Breast | IDC | 4.09e-21 | -3.77e-01 | 0.1581 |
| 5216 | PFN1 | GSM4909294 | Human | Breast | IDC | 3.40e-11 | -5.08e-01 | 0.2022 |
| 5216 | PFN1 | GSM4909295 | Human | Breast | IDC | 1.03e-07 | 3.15e-01 | 0.0898 |
| 5216 | PFN1 | GSM4909296 | Human | Breast | IDC | 4.18e-05 | 2.11e-03 | 0.1524 |
| 5216 | PFN1 | GSM4909297 | Human | Breast | IDC | 1.37e-20 | -2.39e-01 | 0.1517 |
| 5216 | PFN1 | GSM4909298 | Human | Breast | IDC | 1.09e-03 | -1.17e-01 | 0.1551 |
| 5216 | PFN1 | GSM4909299 | Human | Breast | IDC | 2.69e-05 | -1.93e-01 | 0.035 |
| 5216 | PFN1 | GSM4909301 | Human | Breast | IDC | 8.85e-38 | 4.08e-01 | 0.1577 |
| 5216 | PFN1 | GSM4909303 | Human | Breast | IDC | 2.04e-07 | -5.90e-01 | 0.0438 |
| 5216 | PFN1 | GSM4909308 | Human | Breast | IDC | 2.83e-05 | -1.08e-01 | 0.158 |
| 5216 | PFN1 | GSM4909311 | Human | Breast | IDC | 2.46e-49 | -6.93e-01 | 0.1534 |
| 5216 | PFN1 | GSM4909312 | Human | Breast | IDC | 5.78e-04 | -2.37e-01 | 0.1552 |
| 5216 | PFN1 | GSM4909317 | Human | Breast | IDC | 1.77e-19 | -4.98e-01 | 0.1355 |
| 5216 | PFN1 | GSM4909319 | Human | Breast | IDC | 7.22e-65 | -7.13e-01 | 0.1563 |
| Page: 1 2 3 4 5 6 7 8 9 10 11 12 13 14 15 16 17 18 |
| Tissue | Expression Dynamics | Abbreviation |
| Breast |  | IDC: Invasive ductal carcinoma |
| DCIS: Ductal carcinoma in situ | ||
| Precancer(BRCA1-mut): Precancerous lesion from BRCA1 mutation carriers | ||
| Cervix |  | CC: Cervix cancer |
| HSIL_HPV: HPV-infected high-grade squamous intraepithelial lesions | ||
| N_HPV: HPV-infected normal cervix | ||
| Colorectum (GSE201348) |  | FAP: Familial adenomatous polyposis |
| CRC: Colorectal cancer | ||
| Colorectum (HTA11) |  | AD: Adenomas |
| SER: Sessile serrated lesions | ||
| MSI-H: Microsatellite-high colorectal cancer | ||
| MSS: Microsatellite stable colorectal cancer | ||
| Endometrium |  | AEH: Atypical endometrial hyperplasia |
| EEC: Endometrioid Cancer | ||
| Esophagus | 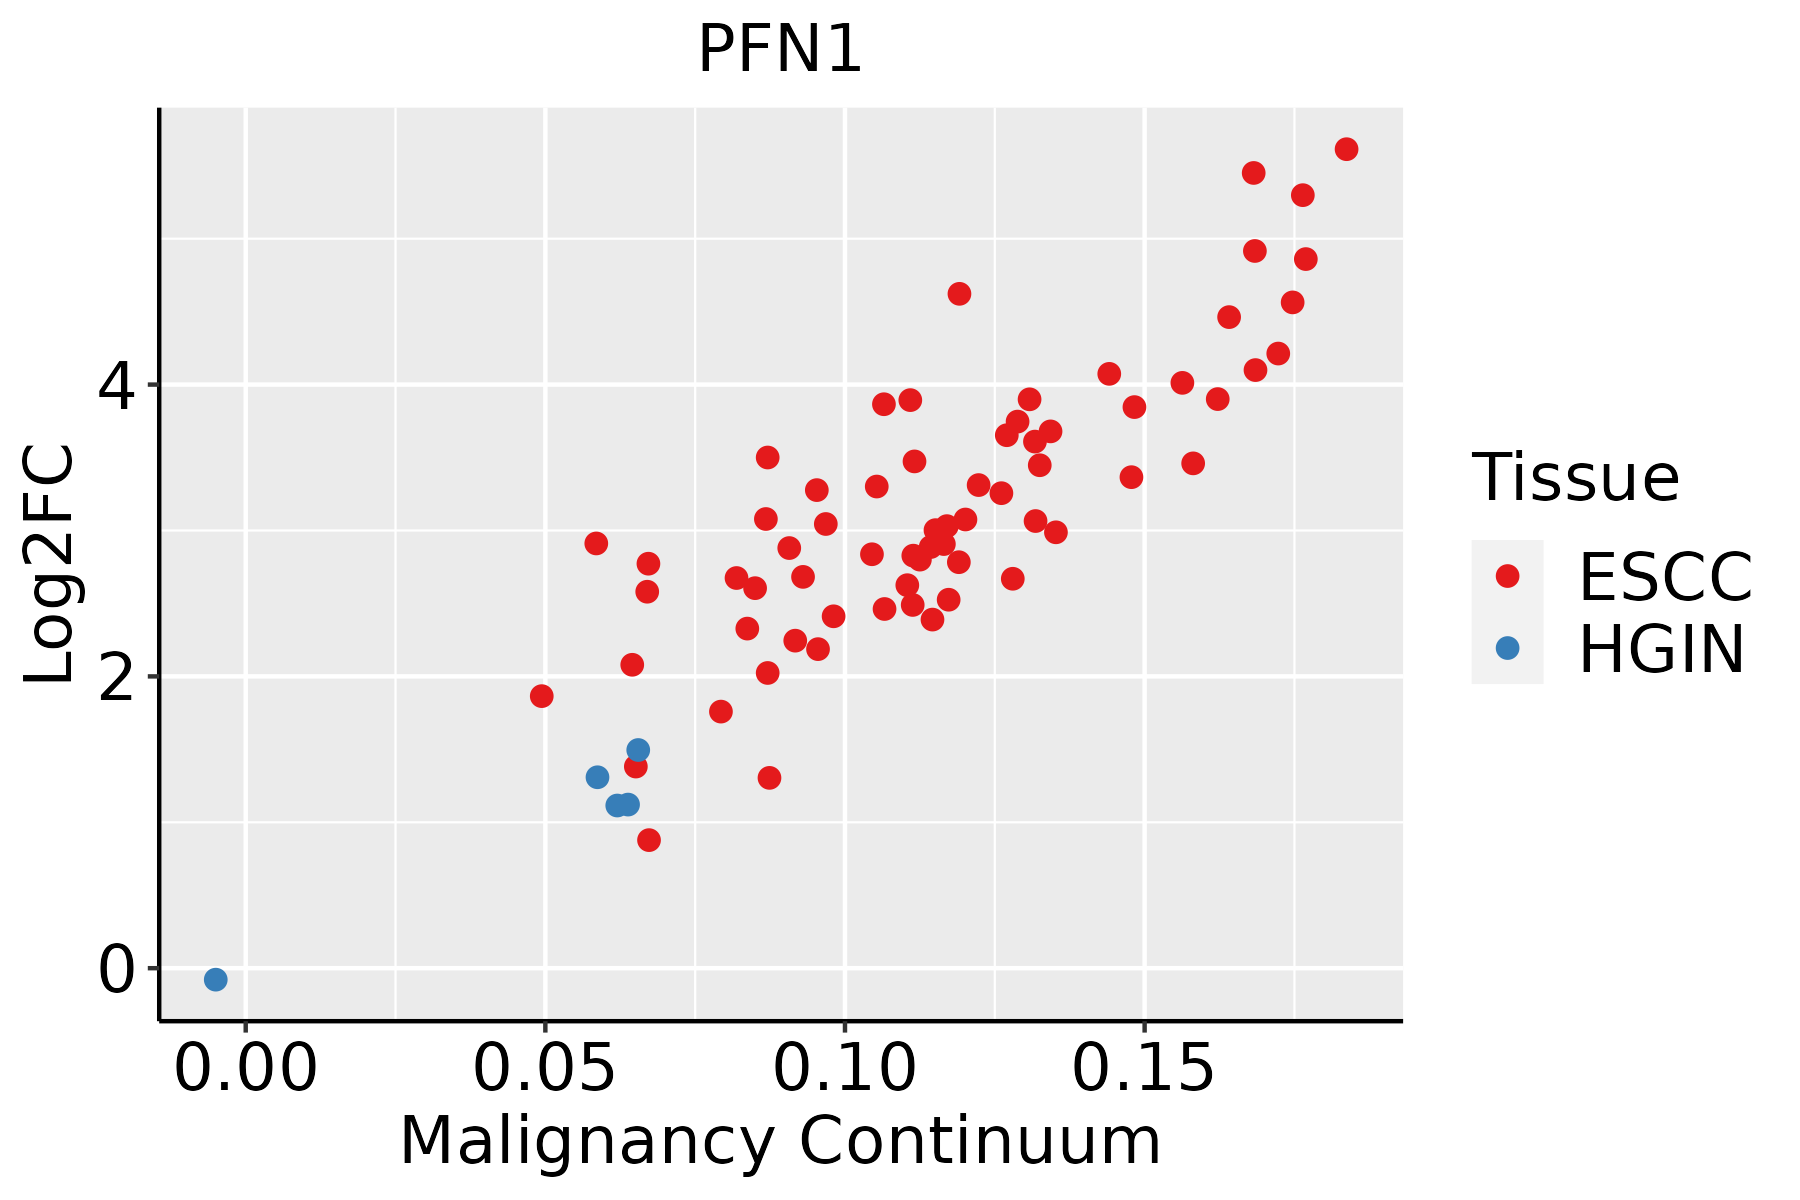 | ESCC: Esophageal squamous cell carcinoma |
| HGIN: High-grade intraepithelial neoplasias | ||
| LGIN: Low-grade intraepithelial neoplasias | ||
| GC | 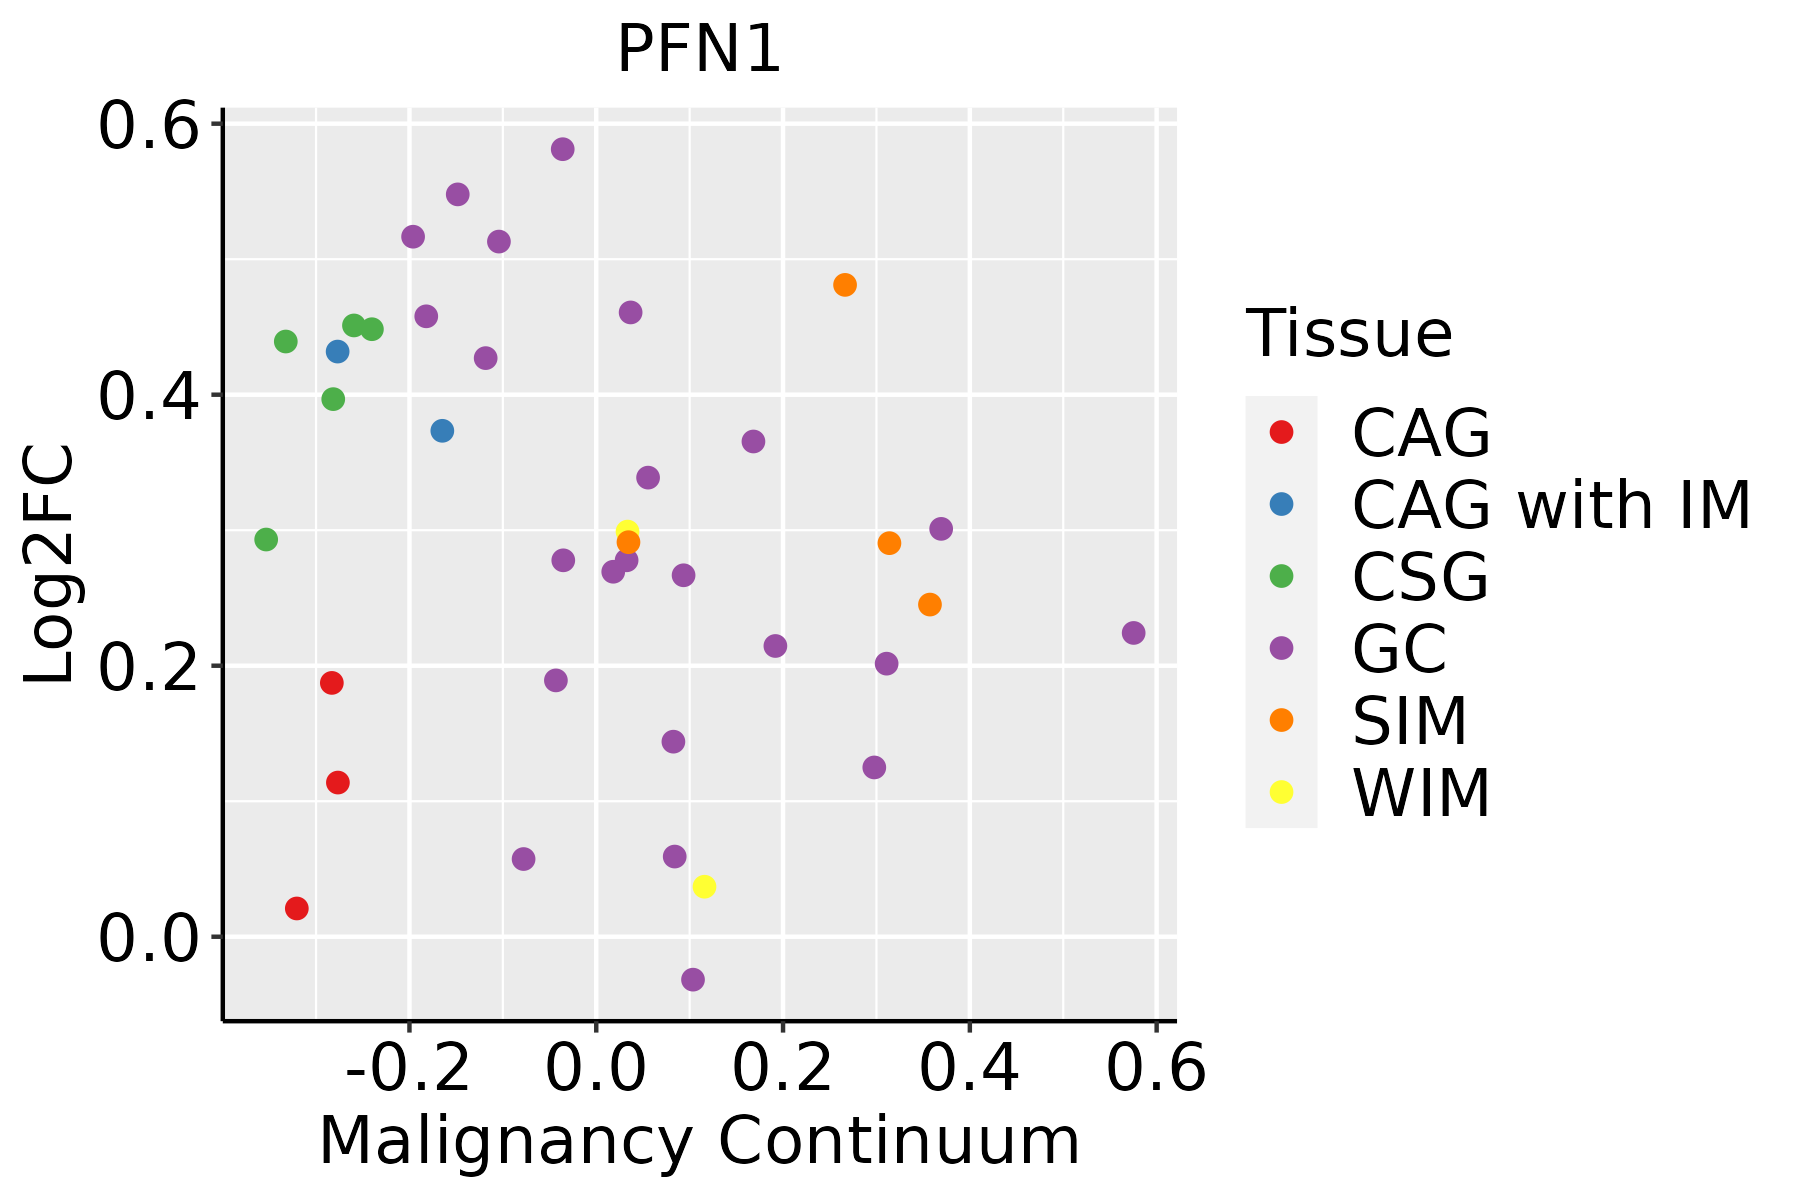 | CAG: Chronic atrophic gastritis |
| CAG with IM: Chronic atrophic gastritis with intestinal metaplasia | ||
| CSG: Chronic superficial gastritis | ||
| GC: Gastric cancer | ||
| SIM: Severe intestinal metaplasia | ||
| WIM: Wild intestinal metaplasia | ||
| Liver | 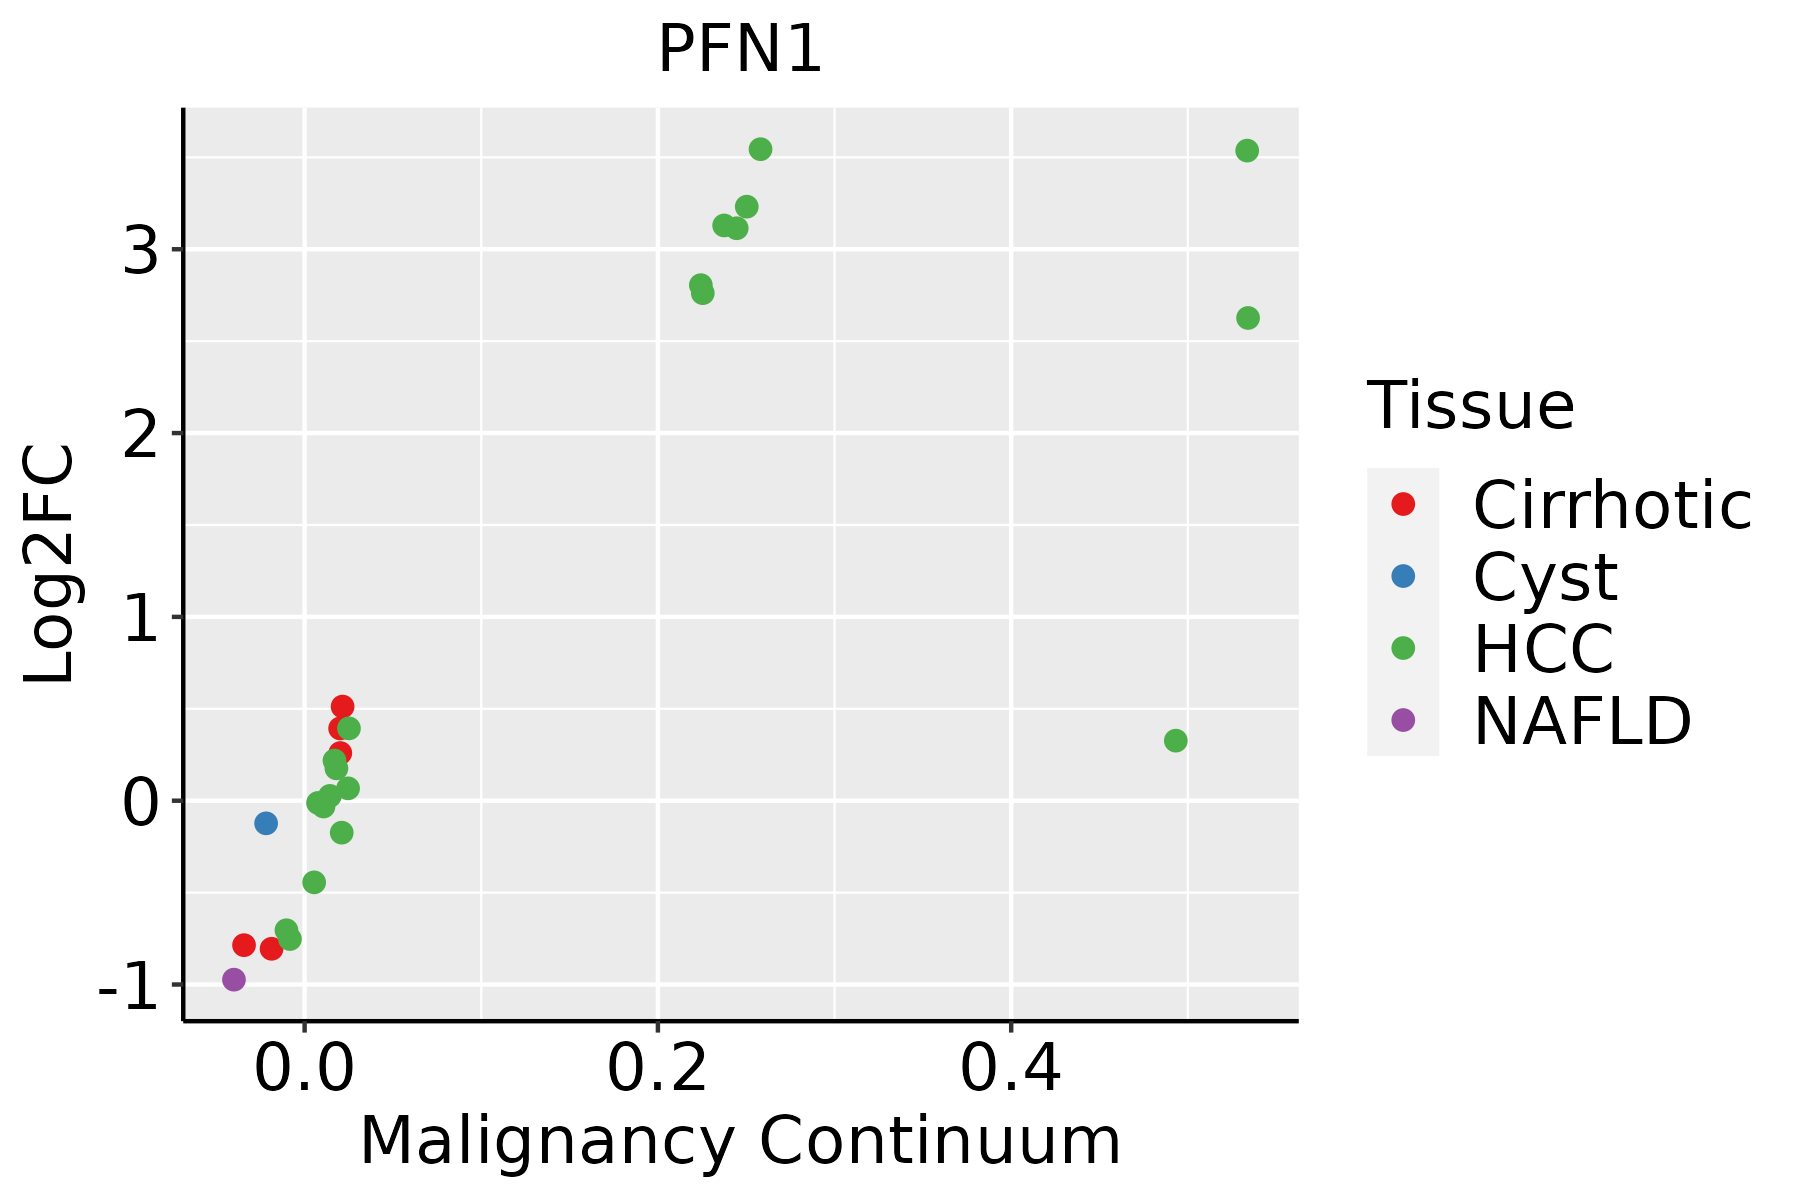 | HCC: Hepatocellular carcinoma |
| NAFLD: Non-alcoholic fatty liver disease | ||
| Lung | 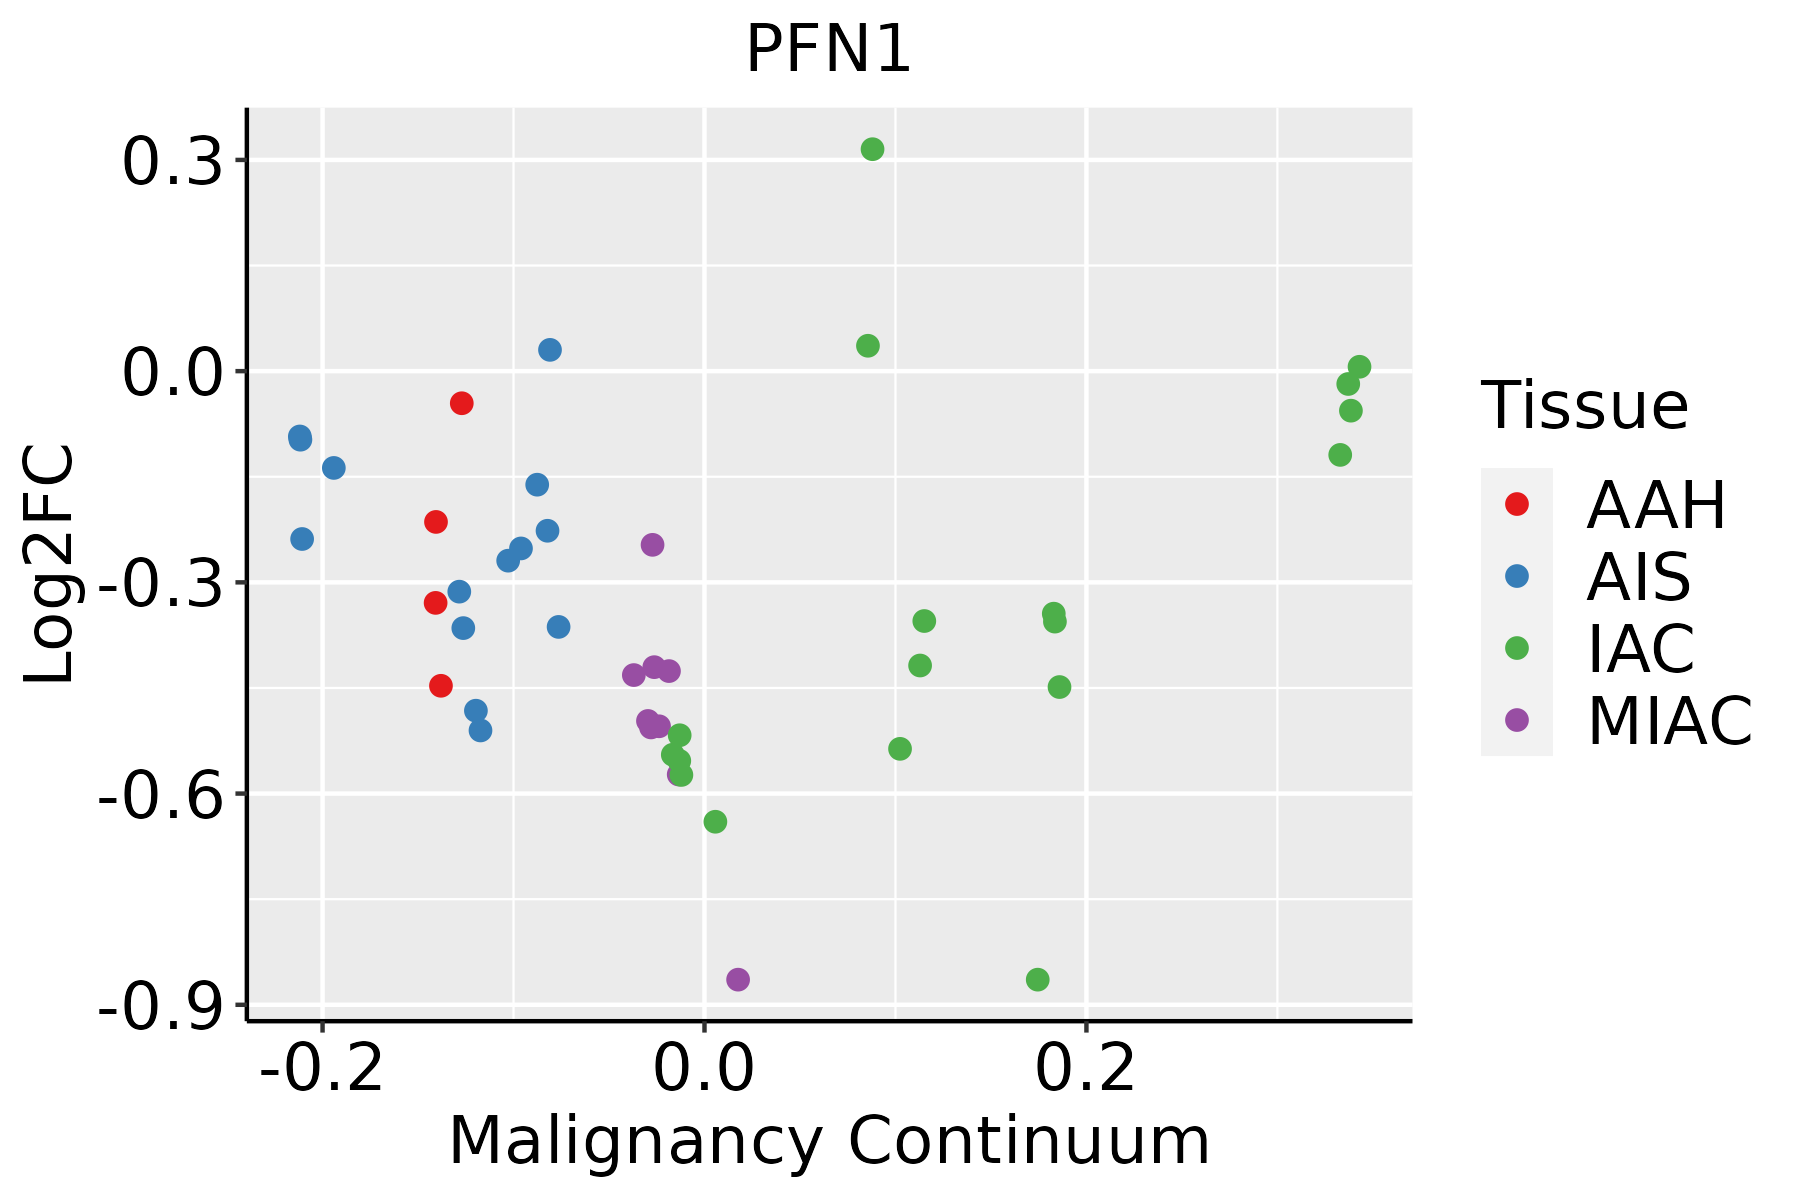 | AAH: Atypical adenomatous hyperplasia |
| AIS: Adenocarcinoma in situ | ||
| IAC: Invasive lung adenocarcinoma | ||
| MIA: Minimally invasive adenocarcinoma | ||
| Oral Cavity | 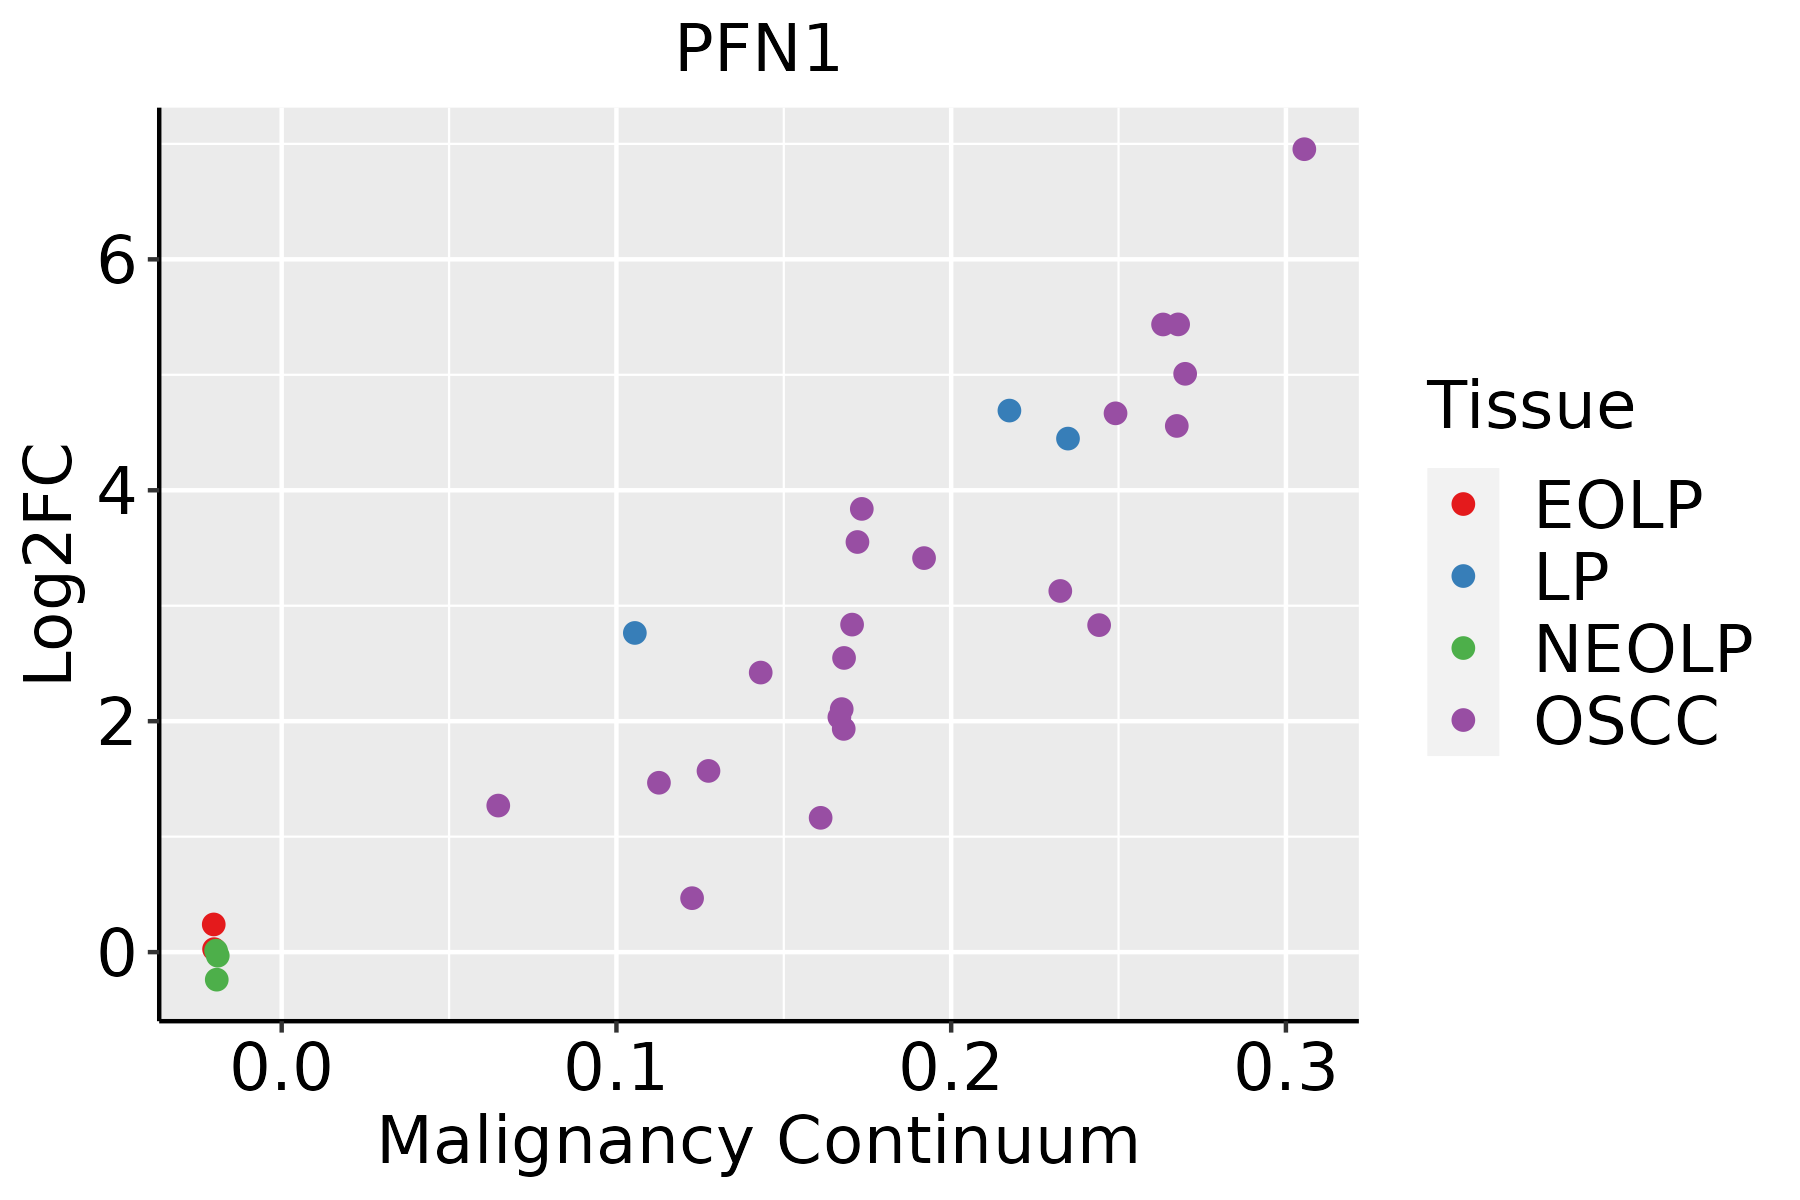 | EOLP: Erosive Oral lichen planus |
| LP: leukoplakia | ||
| NEOLP: Non-erosive oral lichen planus | ||
| OSCC: Oral squamous cell carcinoma | ||
| Prostate |  | BPH: Benign Prostatic Hyperplasia |
| Skin | 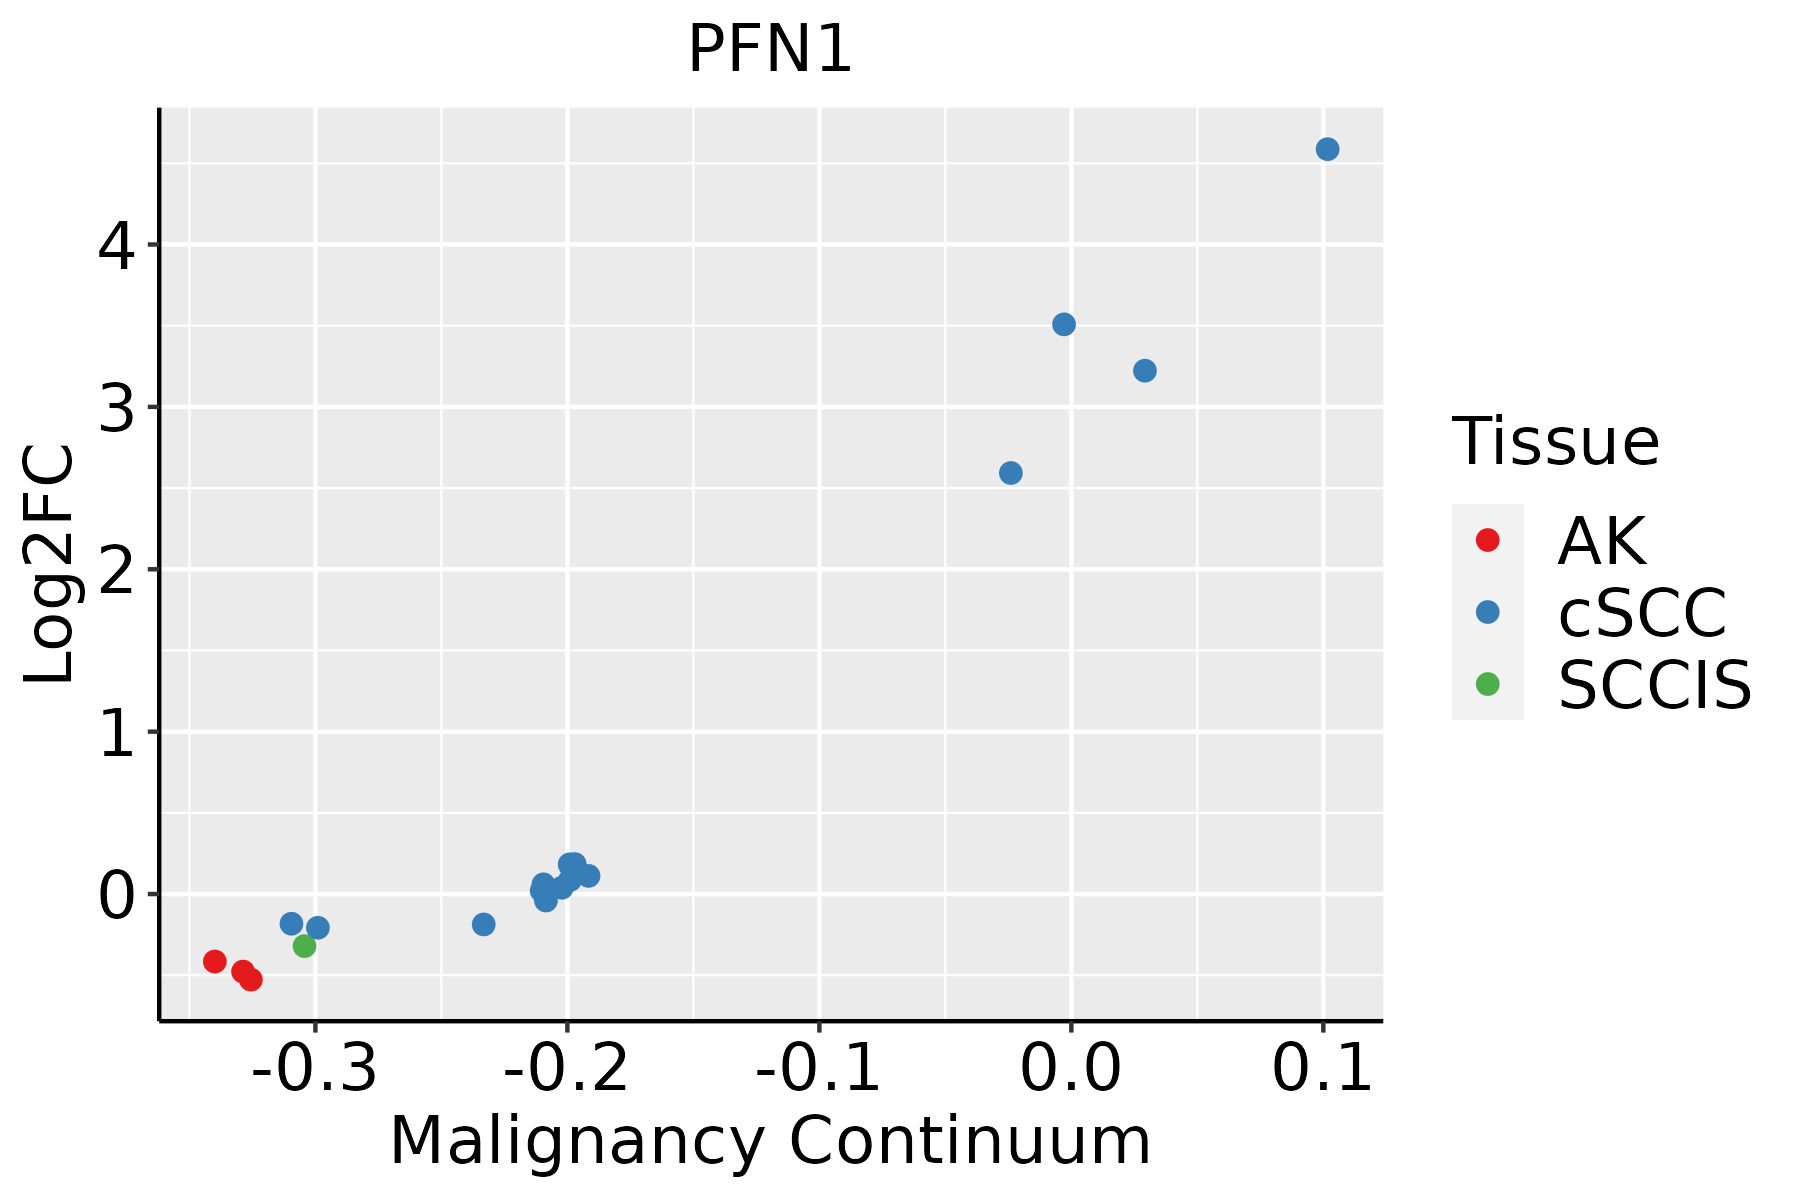 | AK: Actinic keratosis |
| cSCC: Cutaneous squamous cell carcinoma | ||
| SCCIS:squamous cell carcinoma in situ | ||
| Thyroid | 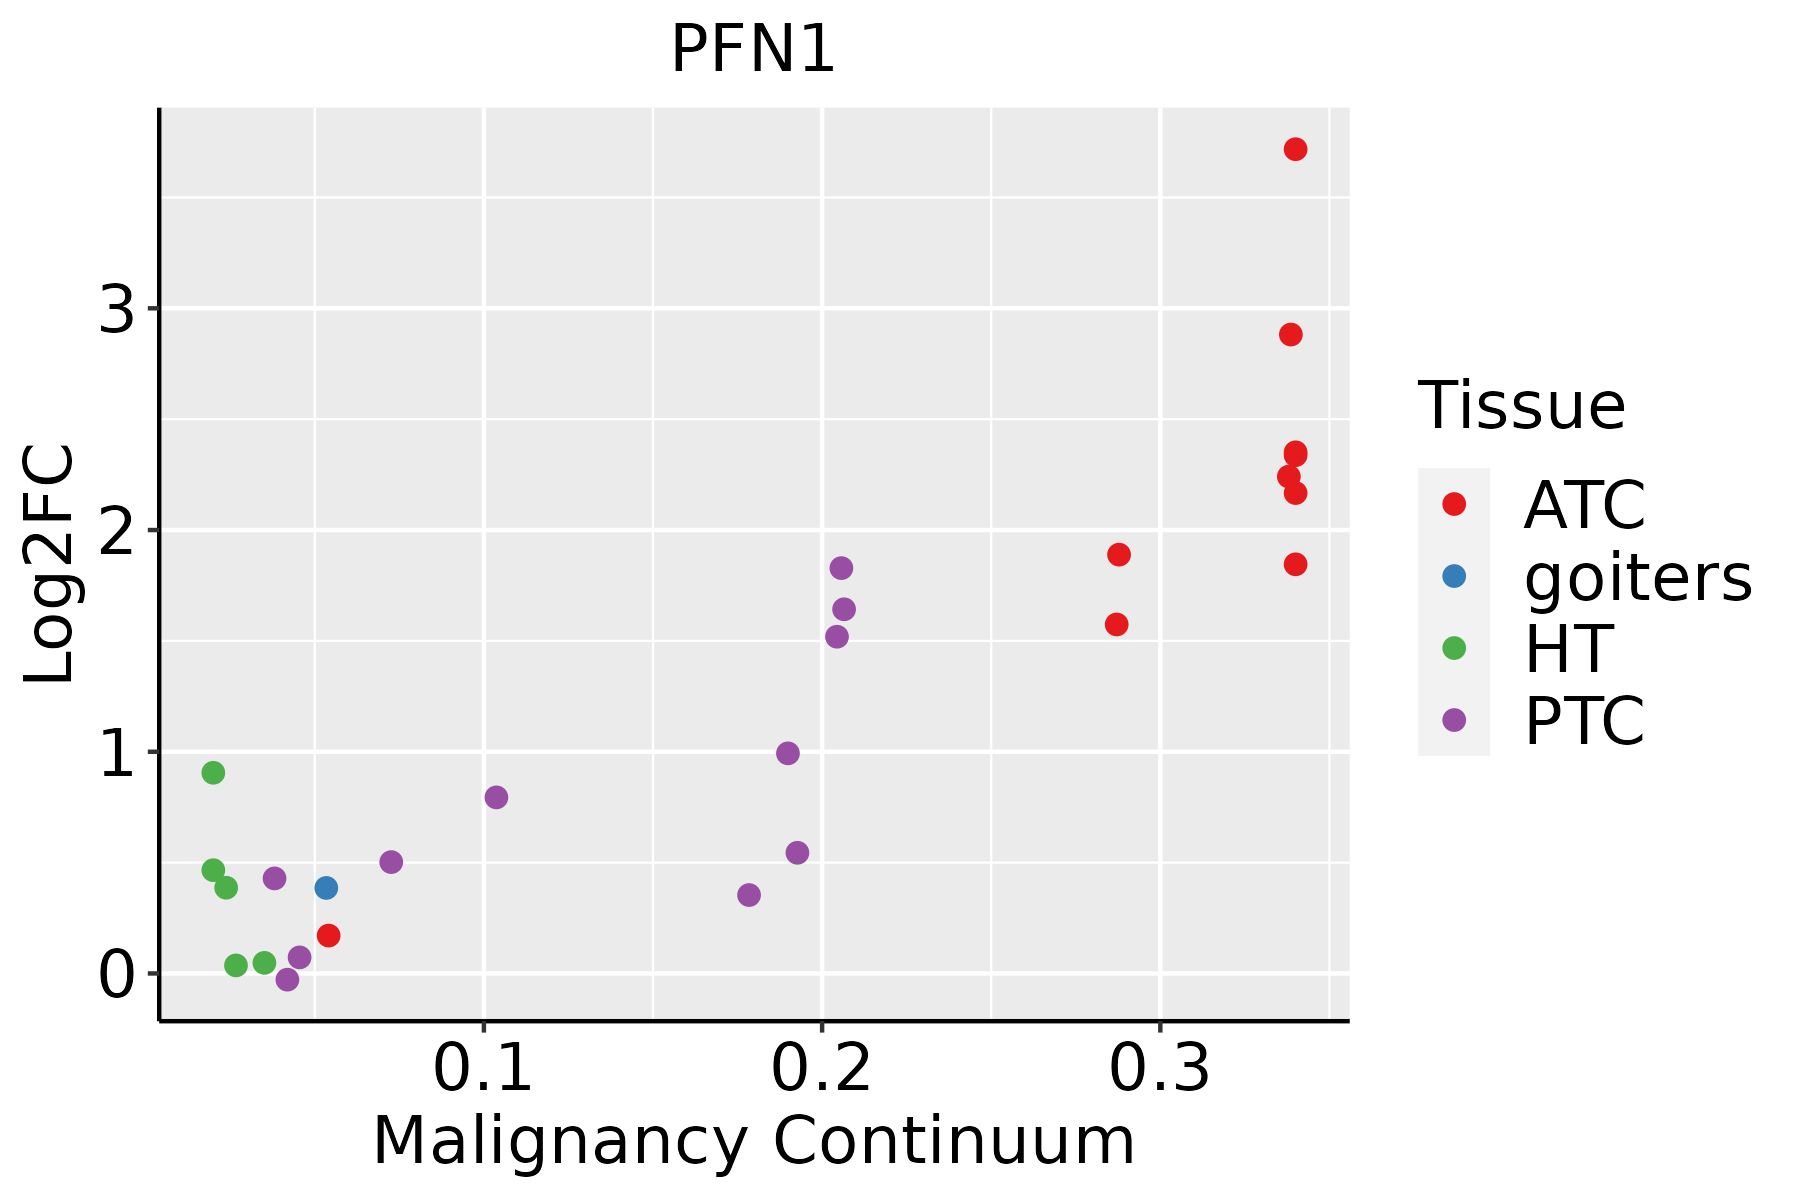 | ATC: Anaplastic thyroid cancer |
| HT: Hashimoto's thyroiditis | ||
| PTC: Papillary thyroid cancer |
| ∗log2FC in expression of this searched gene in stem-like cells from each diseased tissue sample relative to stem-like cells in normal samples in each tissue plotted against the malignancy continuum. Samples are colored based on if they are from different disease stage. |
Top |
Malignant transformation related pathway analysis |
| Find out the enriched GO biological processes and KEGG pathways involved in transition from healthy to precancer to cancer |
| Tissue | Disease Stage | Enriched GO biological Processes |
| Colorectum | AD |  |
| Colorectum | SER |  |
| Colorectum | MSS |  |
| Colorectum | MSI-H |  |
| Colorectum | FAP |  |
| ∗Top 15 enriched GO BP terms are showed in the bar plot of each disease state in each tissue. Each row represents a significant GO biological process which is colored according to the -log10(p.adjust). |
| Page: 1 2 3 4 5 6 7 8 9 |
| GO ID | Tissue | Disease Stage | Description | Gene Ratio | Bg Ratio | pvalue | p.adjust | Count |
| GO:00432549 | Breast | Precancer | regulation of protein-containing complex assembly | 50/1080 | 428/18723 | 1.63e-06 | 5.97e-05 | 50 |
| GO:00508219 | Breast | Precancer | protein stabilization | 29/1080 | 191/18723 | 1.67e-06 | 6.08e-05 | 29 |
| GO:00313349 | Breast | Precancer | positive regulation of protein-containing complex assembly | 33/1080 | 237/18723 | 2.39e-06 | 8.21e-05 | 33 |
| GO:00316479 | Breast | Precancer | regulation of protein stability | 38/1080 | 298/18723 | 3.73e-06 | 1.19e-04 | 38 |
| GO:00106348 | Breast | Precancer | positive regulation of epithelial cell migration | 25/1080 | 176/18723 | 2.75e-05 | 6.21e-04 | 25 |
| GO:19029059 | Breast | Precancer | positive regulation of supramolecular fiber organization | 28/1080 | 209/18723 | 2.79e-05 | 6.28e-04 | 28 |
| GO:00106319 | Breast | Precancer | epithelial cell migration | 40/1080 | 357/18723 | 4.57e-05 | 9.71e-04 | 40 |
| GO:19029039 | Breast | Precancer | regulation of supramolecular fiber organization | 42/1080 | 383/18723 | 4.92e-05 | 1.04e-03 | 42 |
| GO:00901329 | Breast | Precancer | epithelium migration | 40/1080 | 360/18723 | 5.51e-05 | 1.14e-03 | 40 |
| GO:00901309 | Breast | Precancer | tissue migration | 40/1080 | 365/18723 | 7.48e-05 | 1.47e-03 | 40 |
| GO:00329709 | Breast | Precancer | regulation of actin filament-based process | 42/1080 | 397/18723 | 1.11e-04 | 2.01e-03 | 42 |
| GO:00514959 | Breast | Precancer | positive regulation of cytoskeleton organization | 28/1080 | 226/18723 | 1.13e-04 | 2.04e-03 | 28 |
| GO:00106329 | Breast | Precancer | regulation of epithelial cell migration | 33/1080 | 292/18723 | 1.74e-04 | 2.86e-03 | 33 |
| GO:00016678 | Breast | Precancer | ameboidal-type cell migration | 47/1080 | 475/18723 | 2.19e-04 | 3.35e-03 | 47 |
| GO:00434624 | Breast | Precancer | regulation of ATPase activity | 10/1080 | 46/18723 | 2.38e-04 | 3.57e-03 | 10 |
| GO:00070159 | Breast | Precancer | actin filament organization | 44/1080 | 442/18723 | 3.02e-04 | 4.35e-03 | 44 |
| GO:00329569 | Breast | Precancer | regulation of actin cytoskeleton organization | 36/1080 | 358/18723 | 8.56e-04 | 9.88e-03 | 36 |
| GO:00351486 | Breast | Precancer | tube formation | 19/1080 | 148/18723 | 8.79e-04 | 1.01e-02 | 19 |
| GO:00322739 | Breast | Precancer | positive regulation of protein polymerization | 18/1080 | 138/18723 | 9.85e-04 | 1.11e-02 | 18 |
| GO:00313338 | Breast | Precancer | negative regulation of protein-containing complex assembly | 18/1080 | 141/18723 | 1.27e-03 | 1.35e-02 | 18 |
| Page: 1 2 3 4 5 6 7 8 9 10 11 12 13 14 15 16 17 18 19 20 21 22 23 24 25 26 27 28 29 30 31 32 33 34 35 36 37 38 39 40 41 42 43 44 45 46 47 48 49 50 51 52 53 54 55 56 57 58 59 60 61 62 63 64 65 66 67 68 69 70 71 72 73 74 75 76 77 78 79 80 81 82 83 84 85 86 87 88 89 |
| Pathway ID | Tissue | Disease Stage | Description | Gene Ratio | Bg Ratio | pvalue | p.adjust | qvalue | Count |
| hsa051318 | Colorectum | FAP | Shigellosis | 76/1404 | 247/8465 | 1.57e-08 | 5.84e-07 | 3.55e-07 | 76 |
| hsa048106 | Colorectum | FAP | Regulation of actin cytoskeleton | 65/1404 | 229/8465 | 4.07e-06 | 5.91e-05 | 3.59e-05 | 65 |
| hsa050148 | Colorectum | FAP | Amyotrophic lateral sclerosis | 91/1404 | 364/8465 | 1.84e-05 | 2.36e-04 | 1.44e-04 | 91 |
| hsa051328 | Colorectum | FAP | Salmonella infection | 67/1404 | 249/8465 | 2.04e-05 | 2.52e-04 | 1.53e-04 | 67 |
| hsa040156 | Colorectum | FAP | Rap1 signaling pathway | 53/1404 | 210/8465 | 7.93e-04 | 5.14e-03 | 3.13e-03 | 53 |
| hsa051319 | Colorectum | FAP | Shigellosis | 76/1404 | 247/8465 | 1.57e-08 | 5.84e-07 | 3.55e-07 | 76 |
| hsa048107 | Colorectum | FAP | Regulation of actin cytoskeleton | 65/1404 | 229/8465 | 4.07e-06 | 5.91e-05 | 3.59e-05 | 65 |
| hsa050149 | Colorectum | FAP | Amyotrophic lateral sclerosis | 91/1404 | 364/8465 | 1.84e-05 | 2.36e-04 | 1.44e-04 | 91 |
| hsa051329 | Colorectum | FAP | Salmonella infection | 67/1404 | 249/8465 | 2.04e-05 | 2.52e-04 | 1.53e-04 | 67 |
| hsa040157 | Colorectum | FAP | Rap1 signaling pathway | 53/1404 | 210/8465 | 7.93e-04 | 5.14e-03 | 3.13e-03 | 53 |
| hsa0513110 | Colorectum | CRC | Shigellosis | 59/1091 | 247/8465 | 1.19e-06 | 5.41e-05 | 3.66e-05 | 59 |
| hsa048108 | Colorectum | CRC | Regulation of actin cytoskeleton | 52/1091 | 229/8465 | 2.34e-05 | 5.57e-04 | 3.78e-04 | 52 |
| hsa040158 | Colorectum | CRC | Rap1 signaling pathway | 48/1091 | 210/8465 | 4.00e-05 | 8.70e-04 | 5.90e-04 | 48 |
| hsa0513210 | Colorectum | CRC | Salmonella infection | 48/1091 | 249/8465 | 2.43e-03 | 1.69e-02 | 1.15e-02 | 48 |
| hsa0513111 | Colorectum | CRC | Shigellosis | 59/1091 | 247/8465 | 1.19e-06 | 5.41e-05 | 3.66e-05 | 59 |
| hsa048109 | Colorectum | CRC | Regulation of actin cytoskeleton | 52/1091 | 229/8465 | 2.34e-05 | 5.57e-04 | 3.78e-04 | 52 |
| hsa040159 | Colorectum | CRC | Rap1 signaling pathway | 48/1091 | 210/8465 | 4.00e-05 | 8.70e-04 | 5.90e-04 | 48 |
| hsa0513211 | Colorectum | CRC | Salmonella infection | 48/1091 | 249/8465 | 2.43e-03 | 1.69e-02 | 1.15e-02 | 48 |
| hsa0501420 | Endometrium | AEH | Amyotrophic lateral sclerosis | 123/1197 | 364/8465 | 2.17e-22 | 7.82e-21 | 5.72e-21 | 123 |
| hsa0513126 | Endometrium | AEH | Shigellosis | 78/1197 | 247/8465 | 9.23e-13 | 2.00e-11 | 1.46e-11 | 78 |
| Page: 1 2 3 4 5 6 7 8 9 10 11 12 13 |
Top |
Cell-cell communication analysis |
| Identification of potential cell-cell interactions between two cell types and their ligand-receptor pairs for different disease states |
| Ligand | Receptor | LRpair | Pathway | Tissue | Disease Stage |
| Page: 1 |
Top |
Single-cell gene regulatory network inference analysis |
| Find out the significant the regulons (TFs) and the target genes of each regulon across cell types for different disease states |
| TF | Cell Type | Tissue | Disease Stage | Target Gene | RSS | Regulon Activity |
| ∗The dot plots of a searched regulon are shown for all cell subpopulations in each disease state of each tissue based on the regulon specific score inferred using pySCENIC and by calculating the average expression. |
| Page: 1 |
Top |
Somatic mutation of malignant transformation related genes |
| Annotation of somatic variants for genes involved in malignant transformation |
| Hugo Symbol | Variant Class | Variant Classification | dbSNP RS | HGVSc | HGVSp | HGVSp Short | SWISSPROT | BIOTYPE | SIFT | PolyPhen | Tumor Sample Barcode | Tissue | Histology | Sex | Age | Stage | Therapy Types | Drugs | Outcome |
| PFN1 | SNV | Missense_Mutation | novel | c.25N>C | p.Asp9His | p.D9H | P07737 | protein_coding | tolerated(0.08) | possibly_damaging(0.771) | TCGA-DG-A2KK-01 | Cervix | cervical & endocervical cancer | Female | <65 | III/IV | Chemotherapy | cisplatin | SD |
| PFN1 | SNV | Missense_Mutation | c.349N>C | p.Glu117Gln | p.E117Q | P07737 | protein_coding | deleterious(0.01) | possibly_damaging(0.517) | TCGA-HM-A4S6-01 | Cervix | cervical & endocervical cancer | Female | <65 | III/IV | Chemotherapy | cisplatin | CR | |
| PFN1 | SNV | Missense_Mutation | c.349G>A | p.Glu117Lys | p.E117K | P07737 | protein_coding | tolerated(0.15) | benign(0.26) | TCGA-ZJ-AAXU-01 | Cervix | cervical & endocervical cancer | Female | <65 | I/II | Unknown | Unknown | SD | |
| PFN1 | SNV | Missense_Mutation | c.401A>T | p.His134Leu | p.H134L | P07737 | protein_coding | tolerated(0.12) | benign(0.019) | TCGA-CK-4951-01 | Colorectum | colon adenocarcinoma | Female | >=65 | I/II | Unknown | Unknown | PD | |
| PFN1 | SNV | Missense_Mutation | novel | c.197N>G | p.Leu66Arg | p.L66R | P07737 | protein_coding | deleterious(0) | probably_damaging(0.992) | TCGA-A5-A1OF-01 | Endometrium | uterine corpus endometrioid carcinoma | Female | <65 | I/II | Unknown | Unknown | SD |
| PFN1 | SNV | Missense_Mutation | novel | c.355N>A | p.Val119Ile | p.V119I | P07737 | protein_coding | tolerated(0.13) | benign(0.001) | TCGA-AP-A059-01 | Endometrium | uterine corpus endometrioid carcinoma | Female | >=65 | I/II | Unknown | Unknown | SD |
| PFN1 | SNV | Missense_Mutation | novel | c.382N>G | p.Cys128Gly | p.C128G | P07737 | protein_coding | deleterious(0) | benign(0.184) | TCGA-AX-A1CE-01 | Endometrium | uterine corpus endometrioid carcinoma | Female | <65 | I/II | Unspecific | Paclitaxel | SD |
| PFN1 | SNV | Missense_Mutation | c.313N>G | p.Lys105Glu | p.K105E | P07737 | protein_coding | deleterious(0.04) | benign(0.068) | TCGA-D1-A174-01 | Endometrium | uterine corpus endometrioid carcinoma | Female | <65 | I/II | Unknown | Unknown | SD | |
| PFN1 | SNV | Missense_Mutation | novel | c.380N>G | p.Lys127Arg | p.K127R | P07737 | protein_coding | deleterious(0.01) | benign(0.011) | TCGA-E6-A1LX-01 | Endometrium | uterine corpus endometrioid carcinoma | Female | <65 | I/II | Unknown | Unknown | SD |
| PFN1 | SNV | Missense_Mutation | novel | c.172N>C | p.Ser58Arg | p.S58R | P07737 | protein_coding | tolerated(0.27) | benign(0.224) | TCGA-EY-A1GI-01 | Endometrium | uterine corpus endometrioid carcinoma | Female | <65 | I/II | Unknown | Unknown | SD |
| Page: 1 2 |
Top |
Related drugs of malignant transformation related genes |
| Identification of chemicals and drugs interact with genes involved in malignant transfromation |
| (DGIdb 4.0) |
| Entrez ID | Symbol | Category | Interaction Types | Drug Claim Name | Drug Name | PMIDs |
| Page: 1 |

Copyright 2023-Present -The University of Texas Health Science Center at Houston |