
|
|||||
|
 | |
| |
| |
| |
| |
| |
|
Gene: CLTC |
Gene summary for CLTC |
| Gene information | Species | Human | Gene symbol | CLTC | Gene ID | 1213 |
| Gene name | clathrin heavy chain | |
| Gene Alias | CHC | |
| Cytomap | 17q23.1 | |
| Gene Type | protein-coding | GO ID | GO:0000041 | UniProtAcc | A0A087WVQ6 |
Top |
Malignant transformation analysis |
| Identification of the aberrant gene expression in precancerous and cancerous lesions by comparing the gene expression of stem-like cells in diseased tissues with normal stem cells |
| Entrez ID | Symbol | Replicates | Species | Organ | Tissue | Adj P-value | Log2FC | Malignancy |
| 1213 | CLTC | GSM4909281 | Human | Breast | IDC | 2.61e-10 | 4.26e-01 | 0.21 |
| 1213 | CLTC | GSM4909290 | Human | Breast | IDC | 1.63e-09 | 5.45e-01 | 0.2096 |
| 1213 | CLTC | GSM4909291 | Human | Breast | IDC | 2.69e-21 | 7.72e-01 | 0.1753 |
| 1213 | CLTC | GSM4909293 | Human | Breast | IDC | 2.10e-07 | 2.55e-01 | 0.1581 |
| 1213 | CLTC | GSM4909296 | Human | Breast | IDC | 7.74e-03 | -9.82e-02 | 0.1524 |
| 1213 | CLTC | GSM4909297 | Human | Breast | IDC | 2.29e-02 | -4.29e-02 | 0.1517 |
| 1213 | CLTC | GSM4909298 | Human | Breast | IDC | 9.26e-08 | 3.23e-01 | 0.1551 |
| 1213 | CLTC | GSM4909304 | Human | Breast | IDC | 3.99e-06 | 3.41e-01 | 0.1636 |
| 1213 | CLTC | GSM4909311 | Human | Breast | IDC | 8.84e-11 | -1.89e-01 | 0.1534 |
| 1213 | CLTC | GSM4909319 | Human | Breast | IDC | 1.53e-14 | -1.67e-01 | 0.1563 |
| 1213 | CLTC | GSM4909320 | Human | Breast | IDC | 3.90e-03 | -9.05e-02 | 0.1575 |
| 1213 | CLTC | GSM4909321 | Human | Breast | IDC | 1.63e-04 | -5.69e-02 | 0.1559 |
| 1213 | CLTC | brca2 | Human | Breast | Precancer | 7.21e-05 | 2.31e-01 | -0.024 |
| 1213 | CLTC | M1 | Human | Breast | IDC | 1.68e-08 | 5.47e-01 | 0.1577 |
| 1213 | CLTC | M2 | Human | Breast | IDC | 4.85e-14 | 7.60e-01 | 0.21 |
| 1213 | CLTC | NCCBC14 | Human | Breast | DCIS | 3.73e-13 | 5.48e-01 | 0.2021 |
| 1213 | CLTC | NCCBC2 | Human | Breast | DCIS | 6.13e-34 | 1.41e+00 | 0.1554 |
| 1213 | CLTC | NCCBC5 | Human | Breast | DCIS | 3.50e-03 | 2.83e-02 | 0.2046 |
| 1213 | CLTC | P1 | Human | Breast | IDC | 4.89e-21 | 5.65e-01 | 0.1527 |
| 1213 | CLTC | P2 | Human | Breast | IDC | 4.53e-12 | 6.98e-01 | 0.21 |
| Page: 1 2 3 4 5 6 7 8 9 10 11 |
| Tissue | Expression Dynamics | Abbreviation |
| Breast |  | IDC: Invasive ductal carcinoma |
| DCIS: Ductal carcinoma in situ | ||
| Precancer(BRCA1-mut): Precancerous lesion from BRCA1 mutation carriers | ||
| Colorectum (GSE201348) |  | FAP: Familial adenomatous polyposis |
| CRC: Colorectal cancer | ||
| Colorectum (HTA11) |  | AD: Adenomas |
| SER: Sessile serrated lesions | ||
| MSI-H: Microsatellite-high colorectal cancer | ||
| MSS: Microsatellite stable colorectal cancer | ||
| Esophagus | 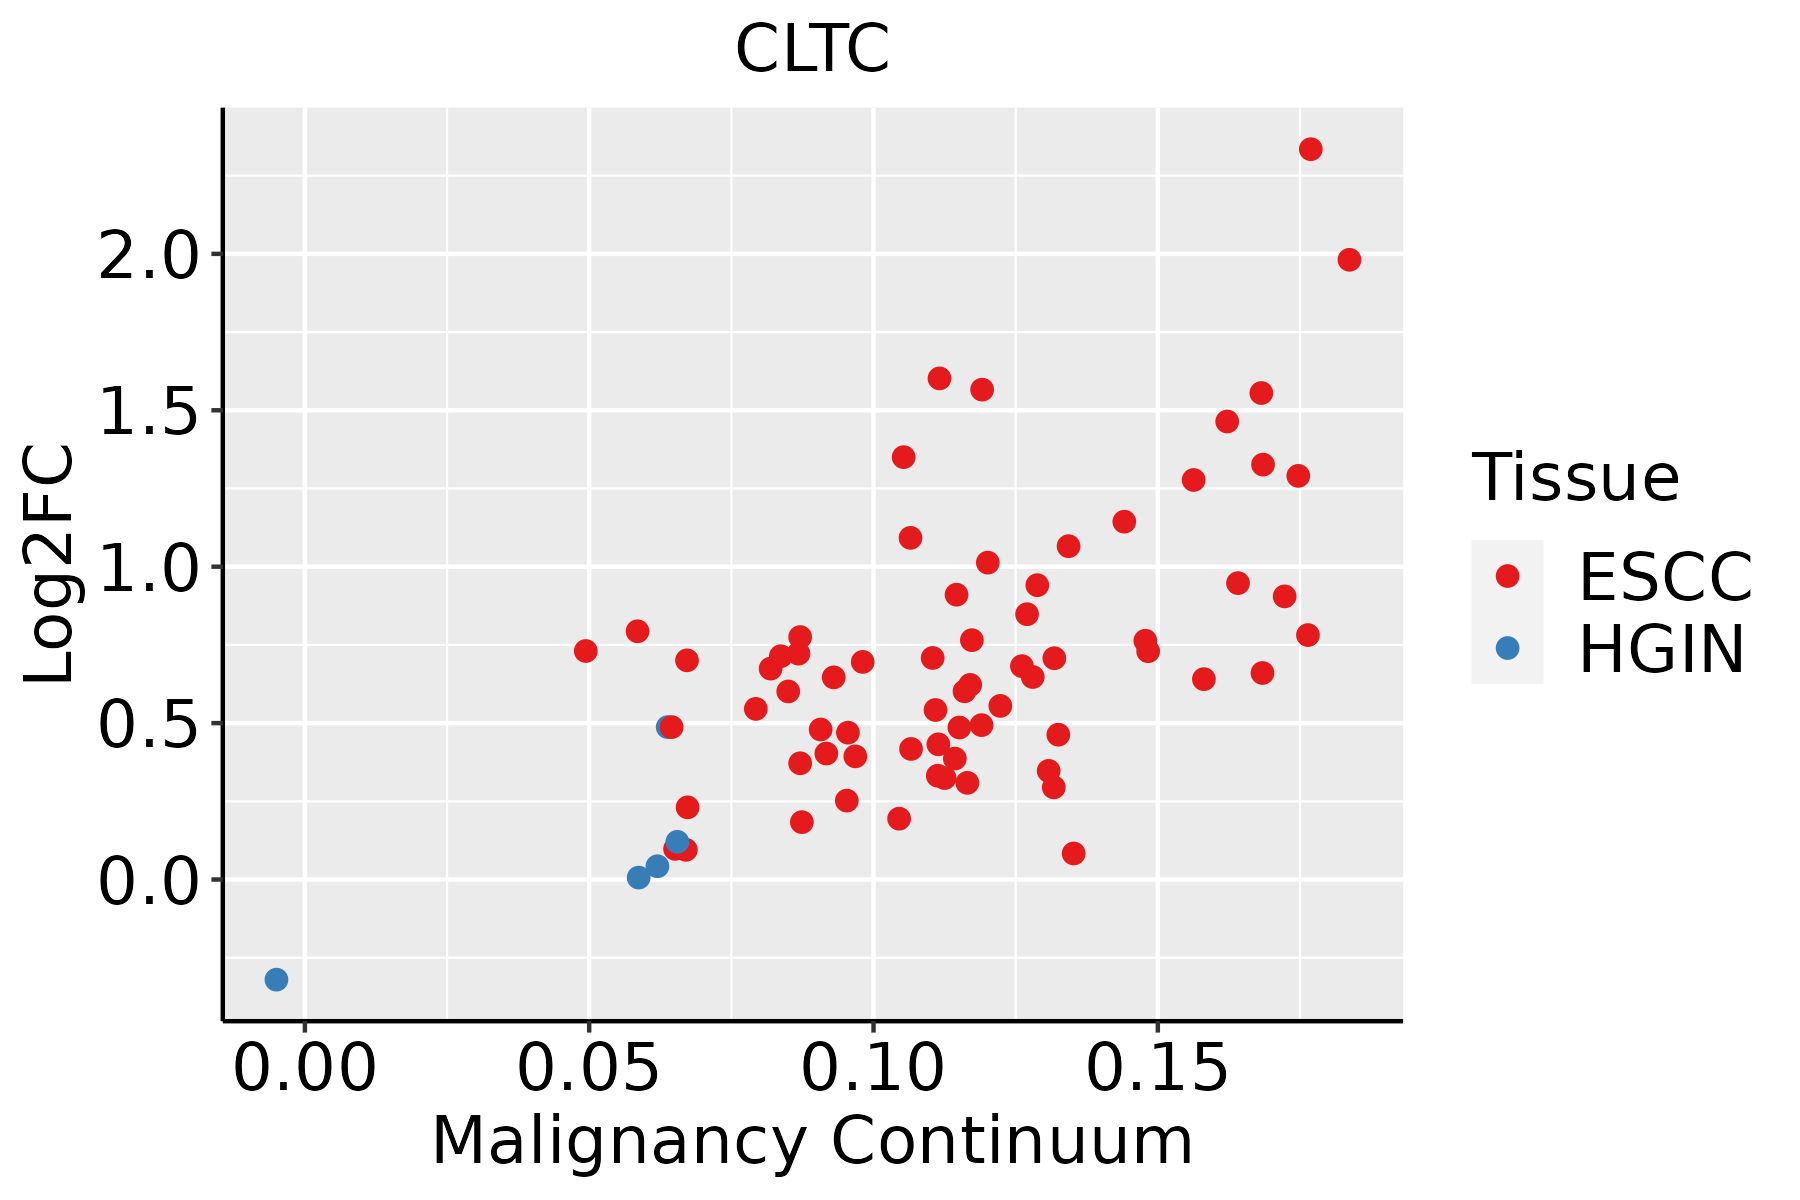 | ESCC: Esophageal squamous cell carcinoma |
| HGIN: High-grade intraepithelial neoplasias | ||
| LGIN: Low-grade intraepithelial neoplasias | ||
| Liver | 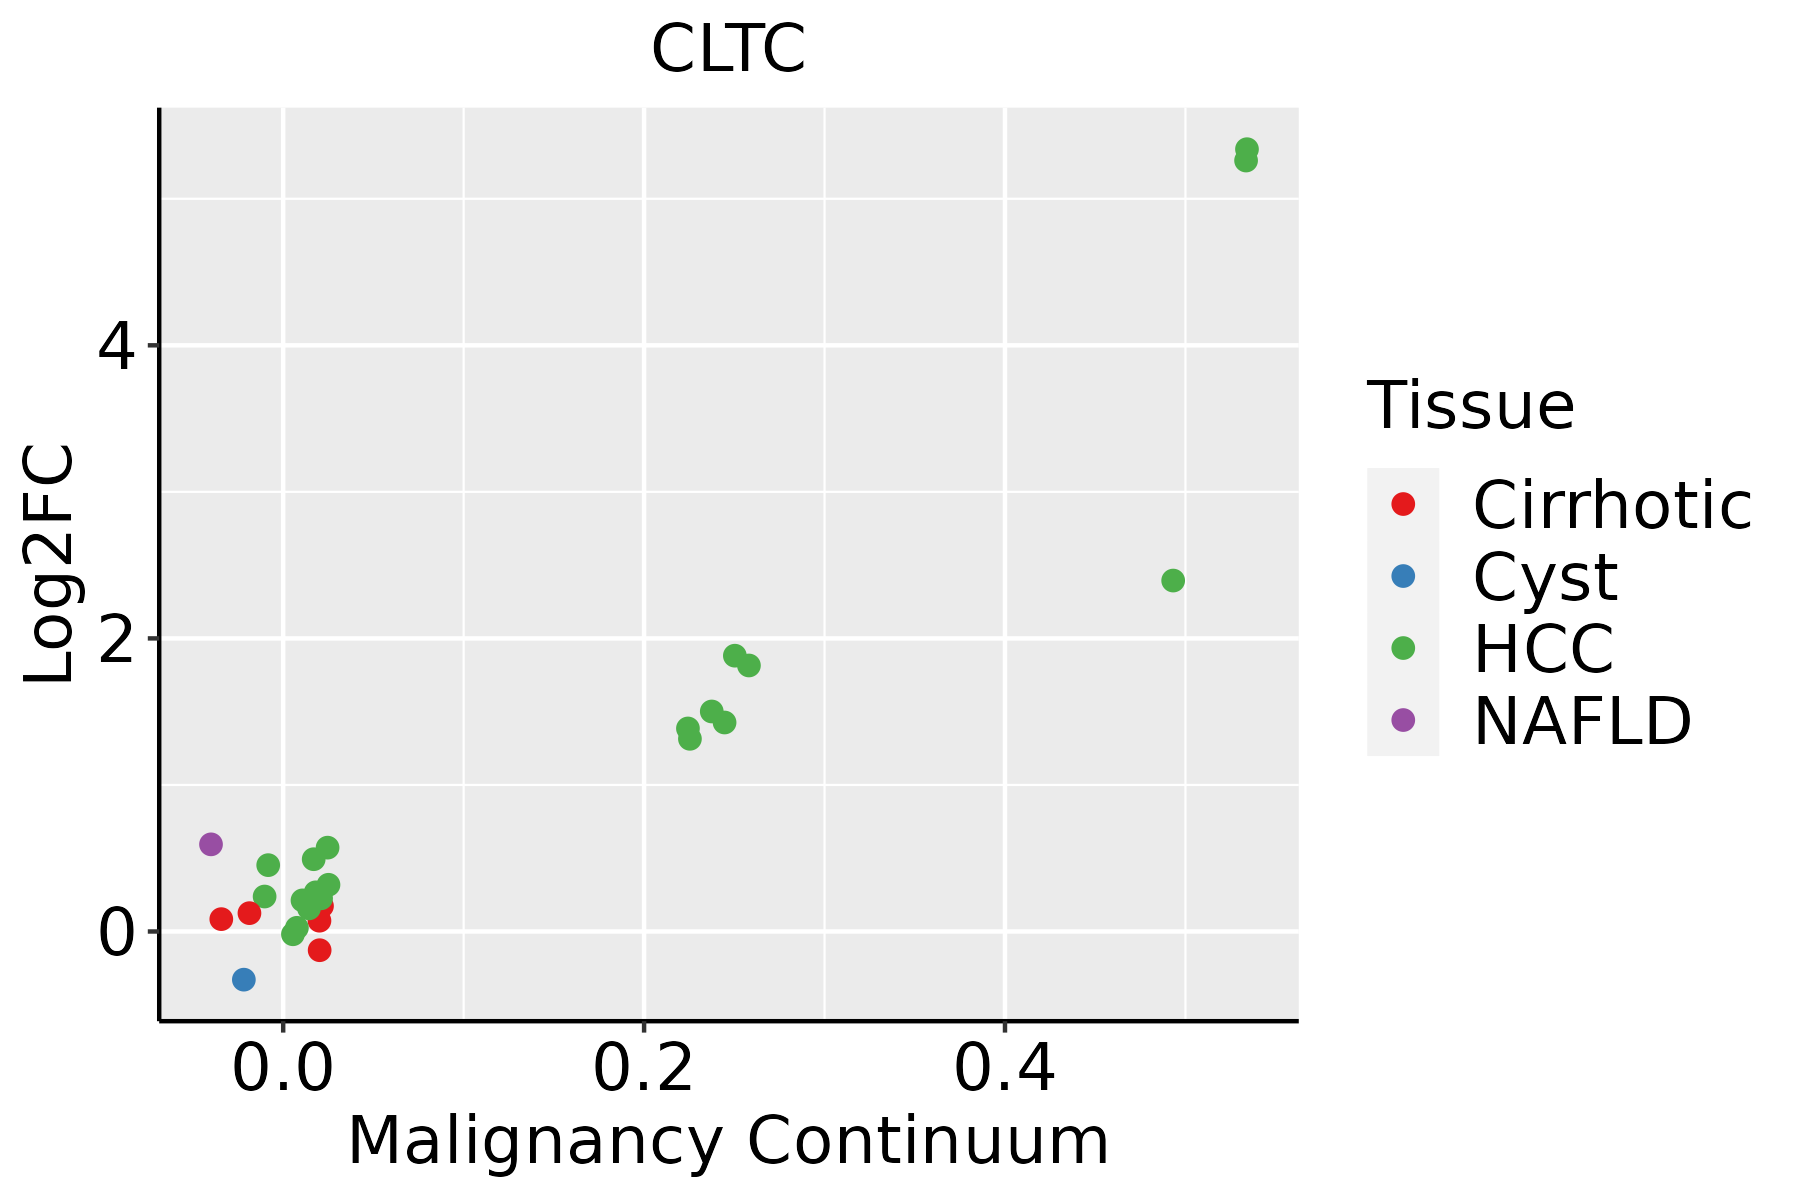 | HCC: Hepatocellular carcinoma |
| NAFLD: Non-alcoholic fatty liver disease | ||
| Oral Cavity |  | EOLP: Erosive Oral lichen planus |
| LP: leukoplakia | ||
| NEOLP: Non-erosive oral lichen planus | ||
| OSCC: Oral squamous cell carcinoma | ||
| Prostate |  | BPH: Benign Prostatic Hyperplasia |
| Skin | 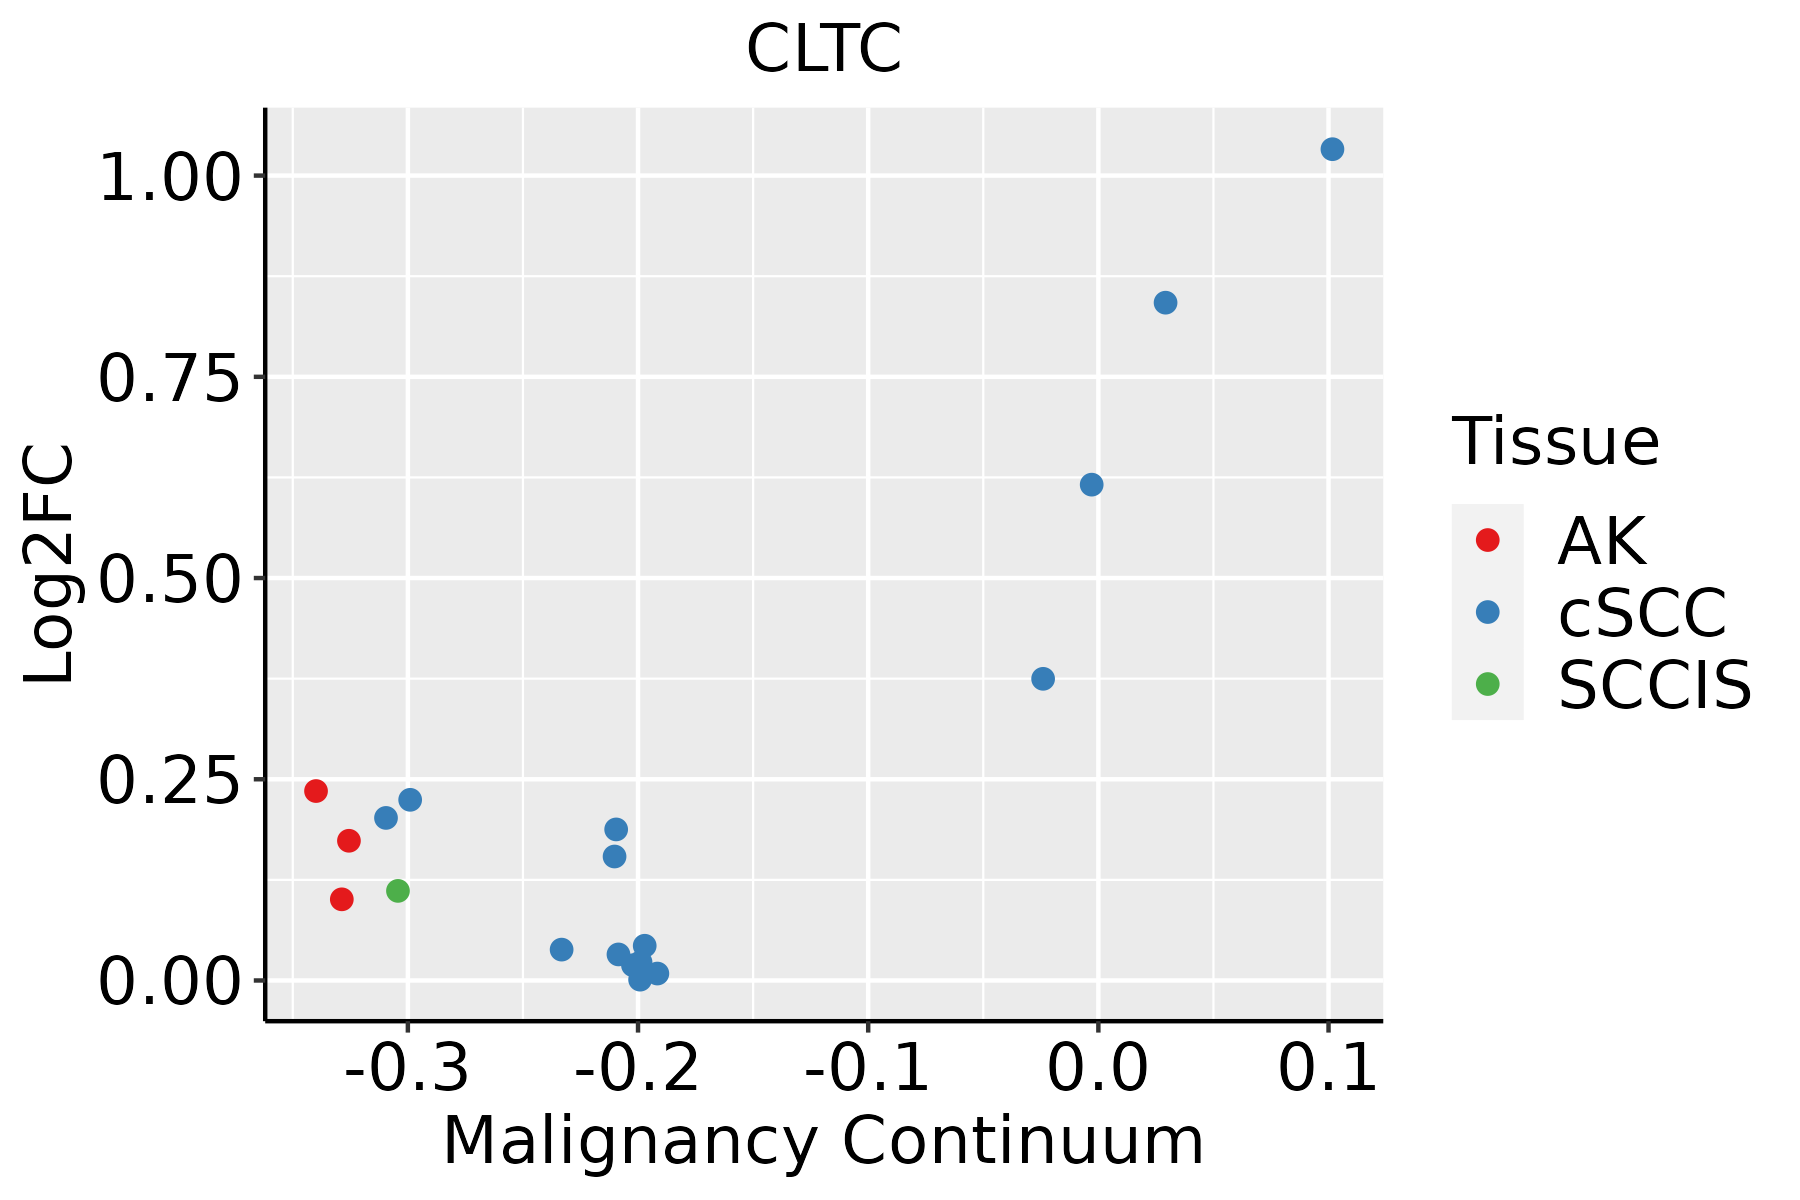 | AK: Actinic keratosis |
| cSCC: Cutaneous squamous cell carcinoma | ||
| SCCIS:squamous cell carcinoma in situ | ||
| Thyroid |  | ATC: Anaplastic thyroid cancer |
| HT: Hashimoto's thyroiditis | ||
| PTC: Papillary thyroid cancer |
| ∗log2FC in expression of this searched gene in stem-like cells from each diseased tissue sample relative to stem-like cells in normal samples in each tissue plotted against the malignancy continuum. Samples are colored based on if they are from different disease stage. |
Top |
Malignant transformation related pathway analysis |
| Find out the enriched GO biological processes and KEGG pathways involved in transition from healthy to precancer to cancer |
| Tissue | Disease Stage | Enriched GO biological Processes |
| Colorectum | AD |  |
| Colorectum | SER |  |
| Colorectum | MSS |  |
| Colorectum | MSI-H |  |
| Colorectum | FAP |  |
| ∗Top 15 enriched GO BP terms are showed in the bar plot of each disease state in each tissue. Each row represents a significant GO biological process which is colored according to the -log10(p.adjust). |
| Page: 1 2 3 4 5 6 7 8 9 |
| GO ID | Tissue | Disease Stage | Description | Gene Ratio | Bg Ratio | pvalue | p.adjust | Count |
| GO:00016496 | Breast | Precancer | osteoblast differentiation | 27/1080 | 229/18723 | 3.35e-04 | 4.73e-03 | 27 |
| GO:00068986 | Breast | Precancer | receptor-mediated endocytosis | 27/1080 | 244/18723 | 9.01e-04 | 1.03e-02 | 27 |
| GO:00316235 | Breast | Precancer | receptor internalization | 15/1080 | 113/18723 | 2.11e-03 | 2.00e-02 | 15 |
| GO:00482685 | Breast | Precancer | clathrin coat assembly | 5/1080 | 18/18723 | 2.88e-03 | 2.49e-02 | 5 |
| GO:19043757 | Breast | Precancer | regulation of protein localization to cell periphery | 15/1080 | 125/18723 | 5.58e-03 | 4.07e-02 | 15 |
| GO:00068263 | Breast | Precancer | iron ion transport | 9/1080 | 58/18723 | 5.67e-03 | 4.08e-02 | 9 |
| GO:19054757 | Breast | Precancer | regulation of protein localization to membrane | 19/1080 | 175/18723 | 5.98e-03 | 4.22e-02 | 19 |
| GO:19030767 | Breast | Precancer | regulation of protein localization to plasma membrane | 13/1080 | 104/18723 | 6.79e-03 | 4.65e-02 | 13 |
| GO:00000412 | Breast | Precancer | transition metal ion transport | 13/1080 | 105/18723 | 7.35e-03 | 4.89e-02 | 13 |
| GO:00015036 | Breast | Precancer | ossification | 36/1080 | 408/18723 | 7.53e-03 | 4.98e-02 | 36 |
| GO:000164912 | Breast | IDC | osteoblast differentiation | 35/1434 | 229/18723 | 6.64e-05 | 1.35e-03 | 35 |
| GO:190547513 | Breast | IDC | regulation of protein localization to membrane | 28/1434 | 175/18723 | 1.56e-04 | 2.71e-03 | 28 |
| GO:000689813 | Breast | IDC | receptor-mediated endocytosis | 35/1434 | 244/18723 | 2.38e-04 | 3.75e-03 | 35 |
| GO:000150311 | Breast | IDC | ossification | 50/1434 | 408/18723 | 6.51e-04 | 8.04e-03 | 50 |
| GO:003162311 | Breast | IDC | receptor internalization | 19/1434 | 113/18723 | 9.17e-04 | 1.05e-02 | 19 |
| GO:190307613 | Breast | IDC | regulation of protein localization to plasma membrane | 17/1434 | 104/18723 | 2.28e-03 | 2.09e-02 | 17 |
| GO:190437513 | Breast | IDC | regulation of protein localization to cell periphery | 19/1434 | 125/18723 | 3.06e-03 | 2.60e-02 | 19 |
| GO:00431126 | Breast | IDC | receptor metabolic process | 23/1434 | 166/18723 | 4.04e-03 | 3.25e-02 | 23 |
| GO:000682611 | Breast | IDC | iron ion transport | 11/1434 | 58/18723 | 4.10e-03 | 3.25e-02 | 11 |
| GO:00726599 | Breast | IDC | protein localization to plasma membrane | 34/1434 | 284/18723 | 6.33e-03 | 4.47e-02 | 34 |
| Page: 1 2 3 4 5 6 7 8 9 10 11 12 13 14 15 16 17 18 19 20 21 22 23 24 25 26 |
| Pathway ID | Tissue | Disease Stage | Description | Gene Ratio | Bg Ratio | pvalue | p.adjust | qvalue | Count |
| hsa0501615 | Liver | Cirrhotic | Huntington disease | 172/2530 | 306/8465 | 1.65e-22 | 1.10e-20 | 6.77e-21 | 172 |
| hsa0414413 | Liver | Cirrhotic | Endocytosis | 119/2530 | 251/8465 | 2.33e-09 | 4.56e-08 | 2.81e-08 | 119 |
| hsa0414211 | Liver | Cirrhotic | Lysosome | 68/2530 | 132/8465 | 1.34e-07 | 1.97e-06 | 1.21e-06 | 68 |
| hsa0510015 | Liver | Cirrhotic | Bacterial invasion of epithelial cells | 40/2530 | 77/8465 | 3.92e-05 | 2.84e-04 | 1.75e-04 | 40 |
| hsa0501622 | Liver | HCC | Huntington disease | 219/4020 | 306/8465 | 3.06e-18 | 3.42e-16 | 1.90e-16 | 219 |
| hsa0414422 | Liver | HCC | Endocytosis | 178/4020 | 251/8465 | 2.03e-14 | 5.22e-13 | 2.91e-13 | 178 |
| hsa041422 | Liver | HCC | Lysosome | 100/4020 | 132/8465 | 2.32e-11 | 4.31e-10 | 2.40e-10 | 100 |
| hsa0510022 | Liver | HCC | Bacterial invasion of epithelial cells | 51/4020 | 77/8465 | 6.67e-04 | 2.72e-03 | 1.52e-03 | 51 |
| hsa0501632 | Liver | HCC | Huntington disease | 219/4020 | 306/8465 | 3.06e-18 | 3.42e-16 | 1.90e-16 | 219 |
| hsa0414432 | Liver | HCC | Endocytosis | 178/4020 | 251/8465 | 2.03e-14 | 5.22e-13 | 2.91e-13 | 178 |
| hsa041423 | Liver | HCC | Lysosome | 100/4020 | 132/8465 | 2.32e-11 | 4.31e-10 | 2.40e-10 | 100 |
| hsa0510032 | Liver | HCC | Bacterial invasion of epithelial cells | 51/4020 | 77/8465 | 6.67e-04 | 2.72e-03 | 1.52e-03 | 51 |
| hsa0414427 | Oral cavity | OSCC | Endocytosis | 174/3704 | 251/8465 | 9.42e-17 | 4.51e-15 | 2.29e-15 | 174 |
| hsa0501628 | Oral cavity | OSCC | Huntington disease | 204/3704 | 306/8465 | 1.70e-16 | 7.13e-15 | 3.63e-15 | 204 |
| hsa041425 | Oral cavity | OSCC | Lysosome | 87/3704 | 132/8465 | 1.97e-07 | 1.35e-06 | 6.86e-07 | 87 |
| hsa0510030 | Oral cavity | OSCC | Bacterial invasion of epithelial cells | 48/3704 | 77/8465 | 7.51e-04 | 2.19e-03 | 1.11e-03 | 48 |
| hsa04144112 | Oral cavity | OSCC | Endocytosis | 174/3704 | 251/8465 | 9.42e-17 | 4.51e-15 | 2.29e-15 | 174 |
| hsa05016112 | Oral cavity | OSCC | Huntington disease | 204/3704 | 306/8465 | 1.70e-16 | 7.13e-15 | 3.63e-15 | 204 |
| hsa0414212 | Oral cavity | OSCC | Lysosome | 87/3704 | 132/8465 | 1.97e-07 | 1.35e-06 | 6.86e-07 | 87 |
| hsa05100113 | Oral cavity | OSCC | Bacterial invasion of epithelial cells | 48/3704 | 77/8465 | 7.51e-04 | 2.19e-03 | 1.11e-03 | 48 |
| Page: 1 2 3 4 5 6 7 |
Top |
Cell-cell communication analysis |
| Identification of potential cell-cell interactions between two cell types and their ligand-receptor pairs for different disease states |
| Ligand | Receptor | LRpair | Pathway | Tissue | Disease Stage |
| Page: 1 |
Top |
Single-cell gene regulatory network inference analysis |
| Find out the significant the regulons (TFs) and the target genes of each regulon across cell types for different disease states |
| TF | Cell Type | Tissue | Disease Stage | Target Gene | RSS | Regulon Activity |
| ∗The dot plots of a searched regulon are shown for all cell subpopulations in each disease state of each tissue based on the regulon specific score inferred using pySCENIC and by calculating the average expression. |
| Page: 1 |
Top |
Somatic mutation of malignant transformation related genes |
| Annotation of somatic variants for genes involved in malignant transformation |
| Hugo Symbol | Variant Class | Variant Classification | dbSNP RS | HGVSc | HGVSp | HGVSp Short | SWISSPROT | BIOTYPE | SIFT | PolyPhen | Tumor Sample Barcode | Tissue | Histology | Sex | Age | Stage | Therapy Types | Drugs | Outcome |
| CLTC | SNV | Missense_Mutation | novel | c.4405N>A | p.Glu1469Lys | p.E1469K | protein_coding | deleterious(0.02) | possibly_damaging(0.72) | TCGA-3C-AALI-01 | Breast | breast invasive carcinoma | Female | <65 | I/II | Unspecific | Poly E | Complete Response | |
| CLTC | SNV | Missense_Mutation | novel | c.1978N>T | p.Gly660Cys | p.G660C | protein_coding | deleterious(0) | benign(0.307) | TCGA-A2-A25A-01 | Breast | breast invasive carcinoma | Female | <65 | I/II | Unspecific | Cytoxan | SD | |
| CLTC | SNV | Missense_Mutation | c.4126N>C | p.Asp1376His | p.D1376H | protein_coding | deleterious(0) | probably_damaging(1) | TCGA-AC-A23H-01 | Breast | breast invasive carcinoma | Female | >=65 | I/II | Unknown | Unknown | PD | ||
| CLTC | SNV | Missense_Mutation | c.3052N>C | p.Asp1018His | p.D1018H | protein_coding | tolerated(0.3) | possibly_damaging(0.771) | TCGA-AN-A0XW-01 | Breast | breast invasive carcinoma | Female | <65 | III/IV | Unknown | Unknown | SD | ||
| CLTC | SNV | Missense_Mutation | c.3622N>A | p.Arg1208Ser | p.R1208S | protein_coding | deleterious(0) | probably_damaging(0.999) | TCGA-AR-A1AO-01 | Breast | breast invasive carcinoma | Female | <65 | I/II | Chemotherapy | doxorubicin | SD | ||
| CLTC | SNV | Missense_Mutation | novel | c.1195N>A | p.Pro399Thr | p.P399T | protein_coding | tolerated(0.06) | benign(0.023) | TCGA-BH-A0BZ-01 | Breast | breast invasive carcinoma | Female | <65 | III/IV | Chemotherapy | doxorubicin | CR | |
| CLTC | SNV | Missense_Mutation | c.22C>T | p.Arg8Cys | p.R8C | protein_coding | deleterious(0.01) | probably_damaging(0.944) | TCGA-C8-A274-01 | Breast | breast invasive carcinoma | Female | <65 | I/II | Hormone Therapy | tamoxiphen | SD | ||
| CLTC | SNV | Missense_Mutation | novel | c.4462N>G | p.Ile1488Val | p.I1488V | protein_coding | tolerated(0.49) | benign(0.045) | TCGA-E9-A5UP-01 | Breast | breast invasive carcinoma | Female | <65 | I/II | Hormone Therapy | tamoxiphen | SD | |
| CLTC | SNV | Missense_Mutation | c.658N>C | p.Phe220Leu | p.F220L | protein_coding | tolerated(0.13) | probably_damaging(0.995) | TCGA-GM-A2DN-01 | Breast | breast invasive carcinoma | Female | <65 | I/II | Chemotherapy | taxol | CR | ||
| CLTC | insertion | In_Frame_Ins | novel | c.2282_2283insTGCTCAACTGTGTGAAAAGGCTGGCCTACT | p.Glu761delinsAspAlaGlnLeuCysGluLysAlaGlyLeuLeu | p.E761delinsDAQLCEKAGLL | protein_coding | TCGA-AO-A0J9-01 | Breast | breast invasive carcinoma | Female | <65 | III/IV | Chemotherapy | cyclophosphamide | PD |
| Page: 1 2 3 4 5 6 7 8 9 10 11 12 13 14 15 16 |
Top |
Related drugs of malignant transformation related genes |
| Identification of chemicals and drugs interact with genes involved in malignant transfromation |
| (DGIdb 4.0) |
| Entrez ID | Symbol | Category | Interaction Types | Drug Claim Name | Drug Name | PMIDs |
| Page: 1 |

Copyright 2023-Present -The University of Texas Health Science Center at Houston |