
|
|||||
|
 | |
| |
| |
| |
| |
| |
|
Gene: ATP5D |
Gene summary for ATP5D |
| Gene information | Species | Human | Gene symbol | ATP5D | Gene ID | 513 |
| Gene name | ATP synthase F1 subunit delta | |
| Gene Alias | ATP5D | |
| Cytomap | 19p13.3 | |
| Gene Type | protein-coding | GO ID | GO:0006091 | UniProtAcc | P30049 |
Top |
Malignant transformation analysis |
| Identification of the aberrant gene expression in precancerous and cancerous lesions by comparing the gene expression of stem-like cells in diseased tissues with normal stem cells |
| Entrez ID | Symbol | Replicates | Species | Organ | Tissue | Adj P-value | Log2FC | Malignancy |
| 513 | ATP5D | GSM4909281 | Human | Breast | IDC | 4.25e-21 | -4.30e-01 | 0.21 |
| 513 | ATP5D | GSM4909282 | Human | Breast | IDC | 7.78e-22 | -4.30e-01 | -0.0288 |
| 513 | ATP5D | GSM4909285 | Human | Breast | IDC | 7.78e-22 | -4.30e-01 | 0.21 |
| 513 | ATP5D | GSM4909286 | Human | Breast | IDC | 4.25e-21 | -4.30e-01 | 0.1081 |
| 513 | ATP5D | GSM4909287 | Human | Breast | IDC | 5.98e-21 | -4.30e-01 | 0.2057 |
| 513 | ATP5D | GSM4909288 | Human | Breast | IDC | 8.39e-05 | -4.30e-01 | 0.0988 |
| 513 | ATP5D | GSM4909289 | Human | Breast | IDC | 2.83e-03 | -4.30e-01 | 0.1064 |
| 513 | ATP5D | GSM4909290 | Human | Breast | IDC | 5.57e-15 | -4.30e-01 | 0.2096 |
| 513 | ATP5D | GSM4909291 | Human | Breast | IDC | 4.05e-12 | -4.30e-01 | 0.1753 |
| 513 | ATP5D | GSM4909293 | Human | Breast | IDC | 4.25e-21 | -4.30e-01 | 0.1581 |
| 513 | ATP5D | GSM4909294 | Human | Breast | IDC | 1.82e-21 | -4.30e-01 | 0.2022 |
| 513 | ATP5D | GSM4909295 | Human | Breast | IDC | 1.70e-09 | -4.30e-01 | 0.0898 |
| 513 | ATP5D | GSM4909296 | Human | Breast | IDC | 1.82e-21 | -4.30e-01 | 0.1524 |
| 513 | ATP5D | GSM4909297 | Human | Breast | IDC | 2.52e-23 | -4.30e-01 | 0.1517 |
| 513 | ATP5D | GSM4909298 | Human | Breast | IDC | 7.78e-22 | -4.30e-01 | 0.1551 |
| 513 | ATP5D | GSM4909299 | Human | Breast | IDC | 1.82e-21 | -4.30e-01 | 0.035 |
| 513 | ATP5D | GSM4909300 | Human | Breast | IDC | 2.31e-08 | -4.30e-01 | 0.0334 |
| 513 | ATP5D | GSM4909301 | Human | Breast | IDC | 3.31e-22 | -4.30e-01 | 0.1577 |
| 513 | ATP5D | GSM4909302 | Human | Breast | IDC | 1.20e-20 | -4.30e-01 | 0.1545 |
| 513 | ATP5D | GSM4909303 | Human | Breast | IDC | 1.72e-05 | -4.30e-01 | 0.0438 |
| Page: 1 2 3 4 5 6 7 8 9 10 11 12 |
| Tissue | Expression Dynamics | Abbreviation |
| Breast | 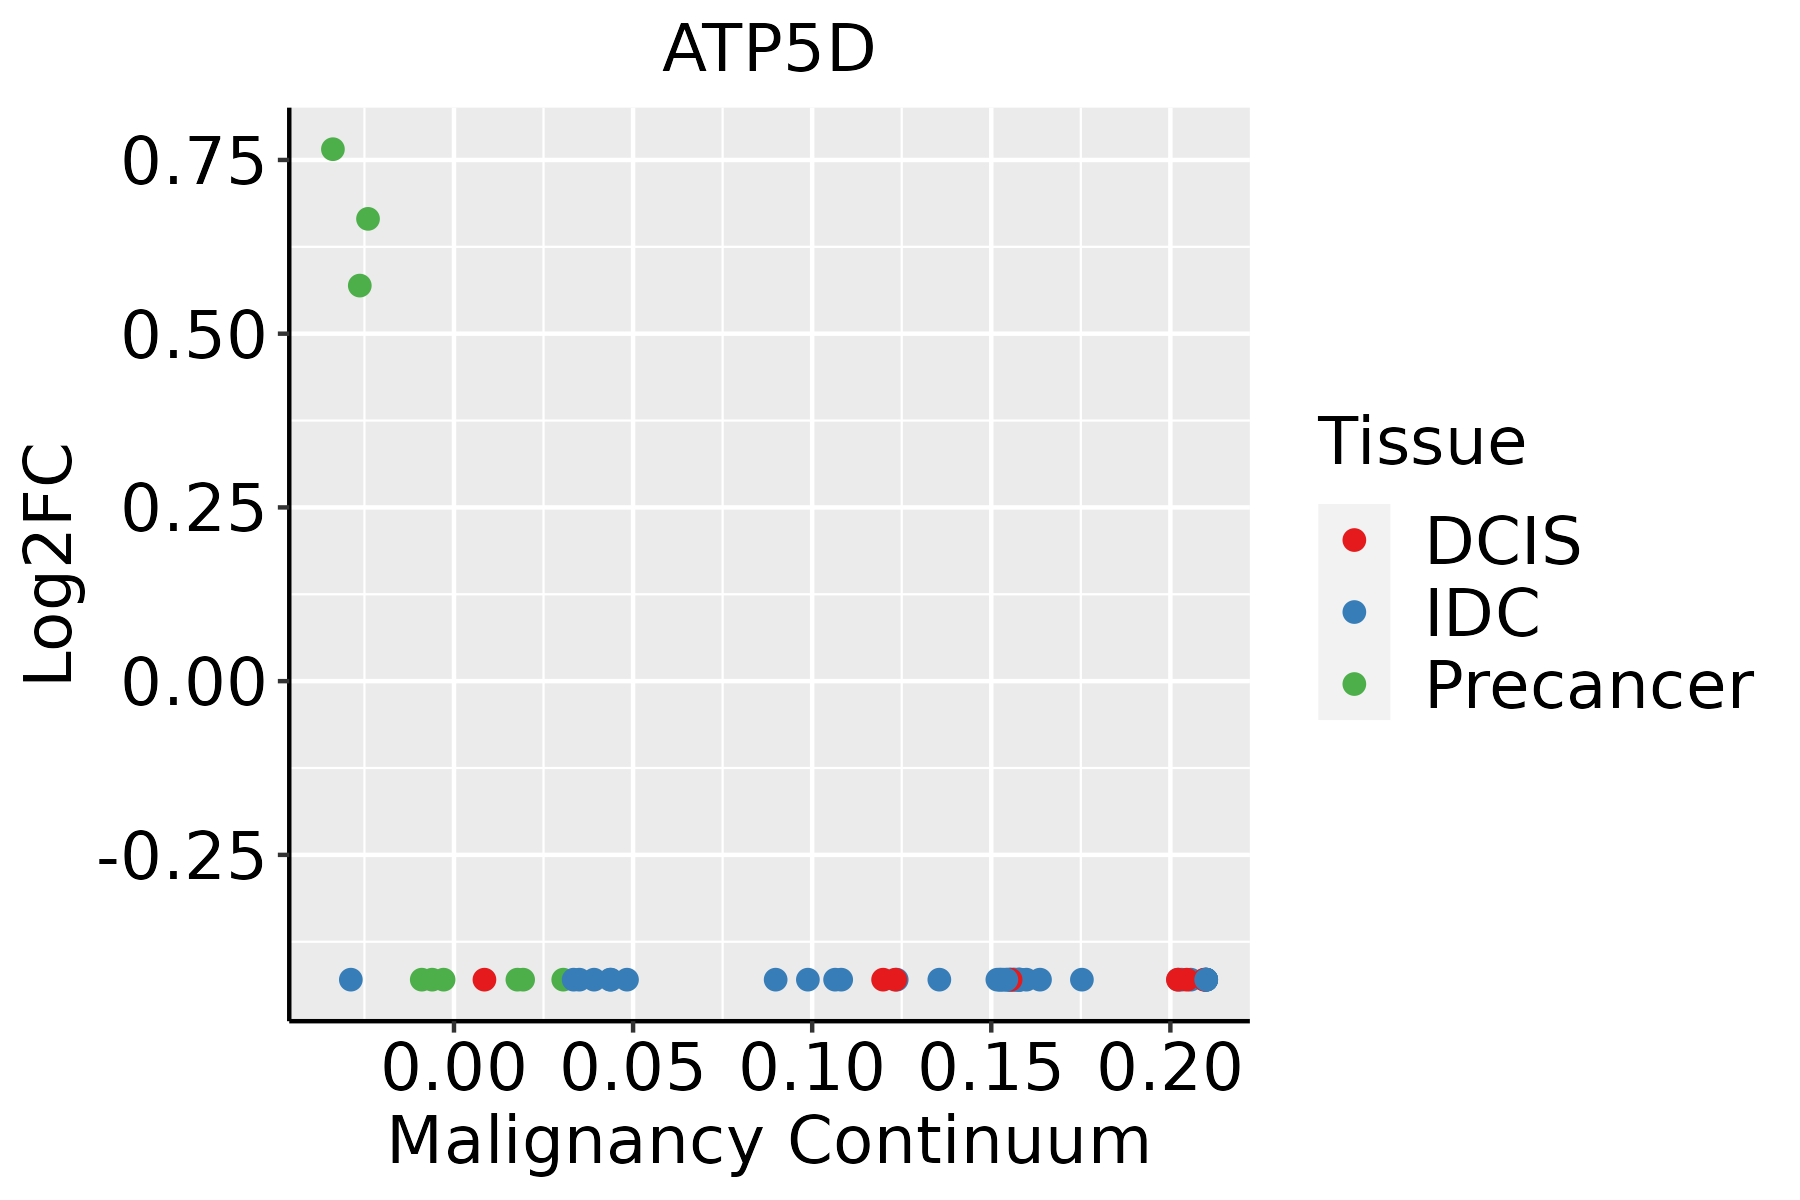 | IDC: Invasive ductal carcinoma |
| DCIS: Ductal carcinoma in situ | ||
| Precancer(BRCA1-mut): Precancerous lesion from BRCA1 mutation carriers | ||
| Colorectum (GSE201348) |  | FAP: Familial adenomatous polyposis |
| CRC: Colorectal cancer | ||
| Colorectum (HTA11) |  | AD: Adenomas |
| SER: Sessile serrated lesions | ||
| MSI-H: Microsatellite-high colorectal cancer | ||
| MSS: Microsatellite stable colorectal cancer | ||
| Esophagus | 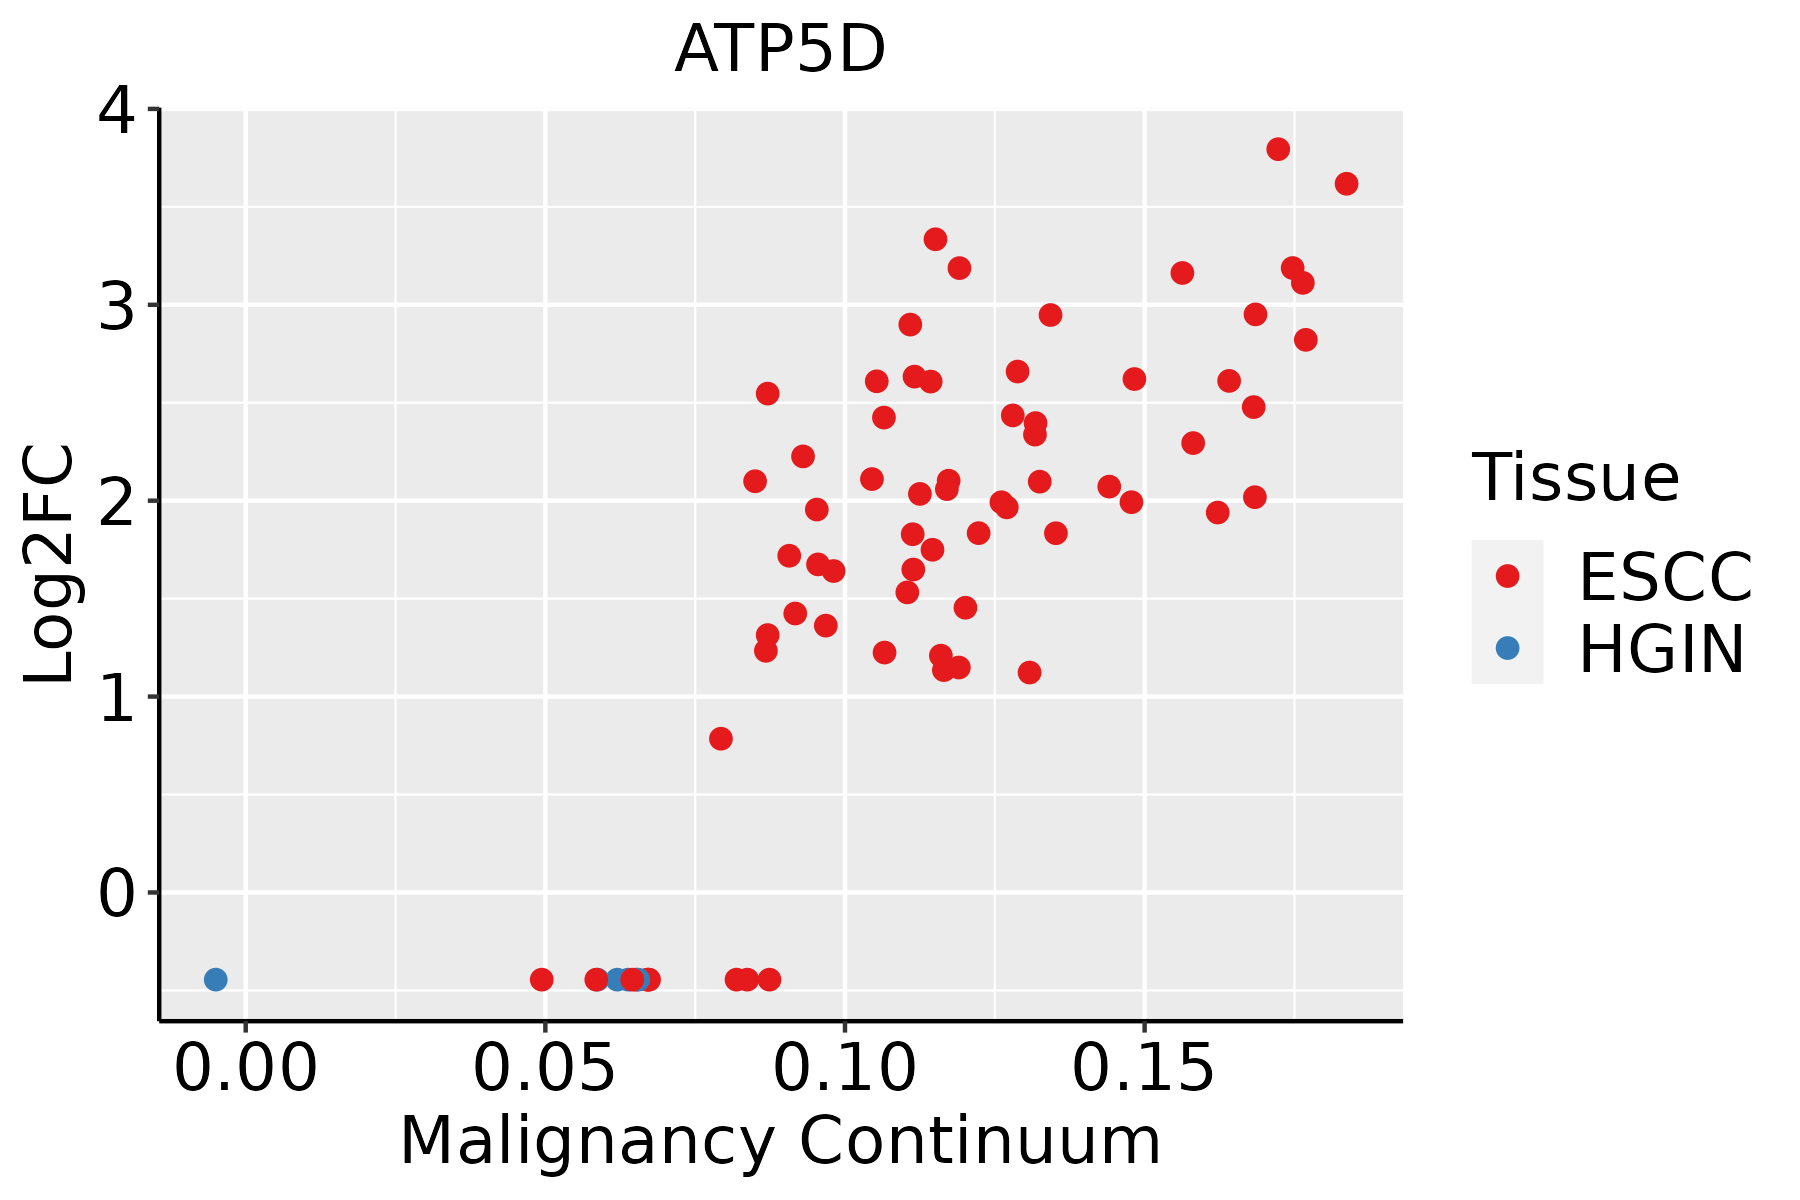 | ESCC: Esophageal squamous cell carcinoma |
| HGIN: High-grade intraepithelial neoplasias | ||
| LGIN: Low-grade intraepithelial neoplasias | ||
| GC | 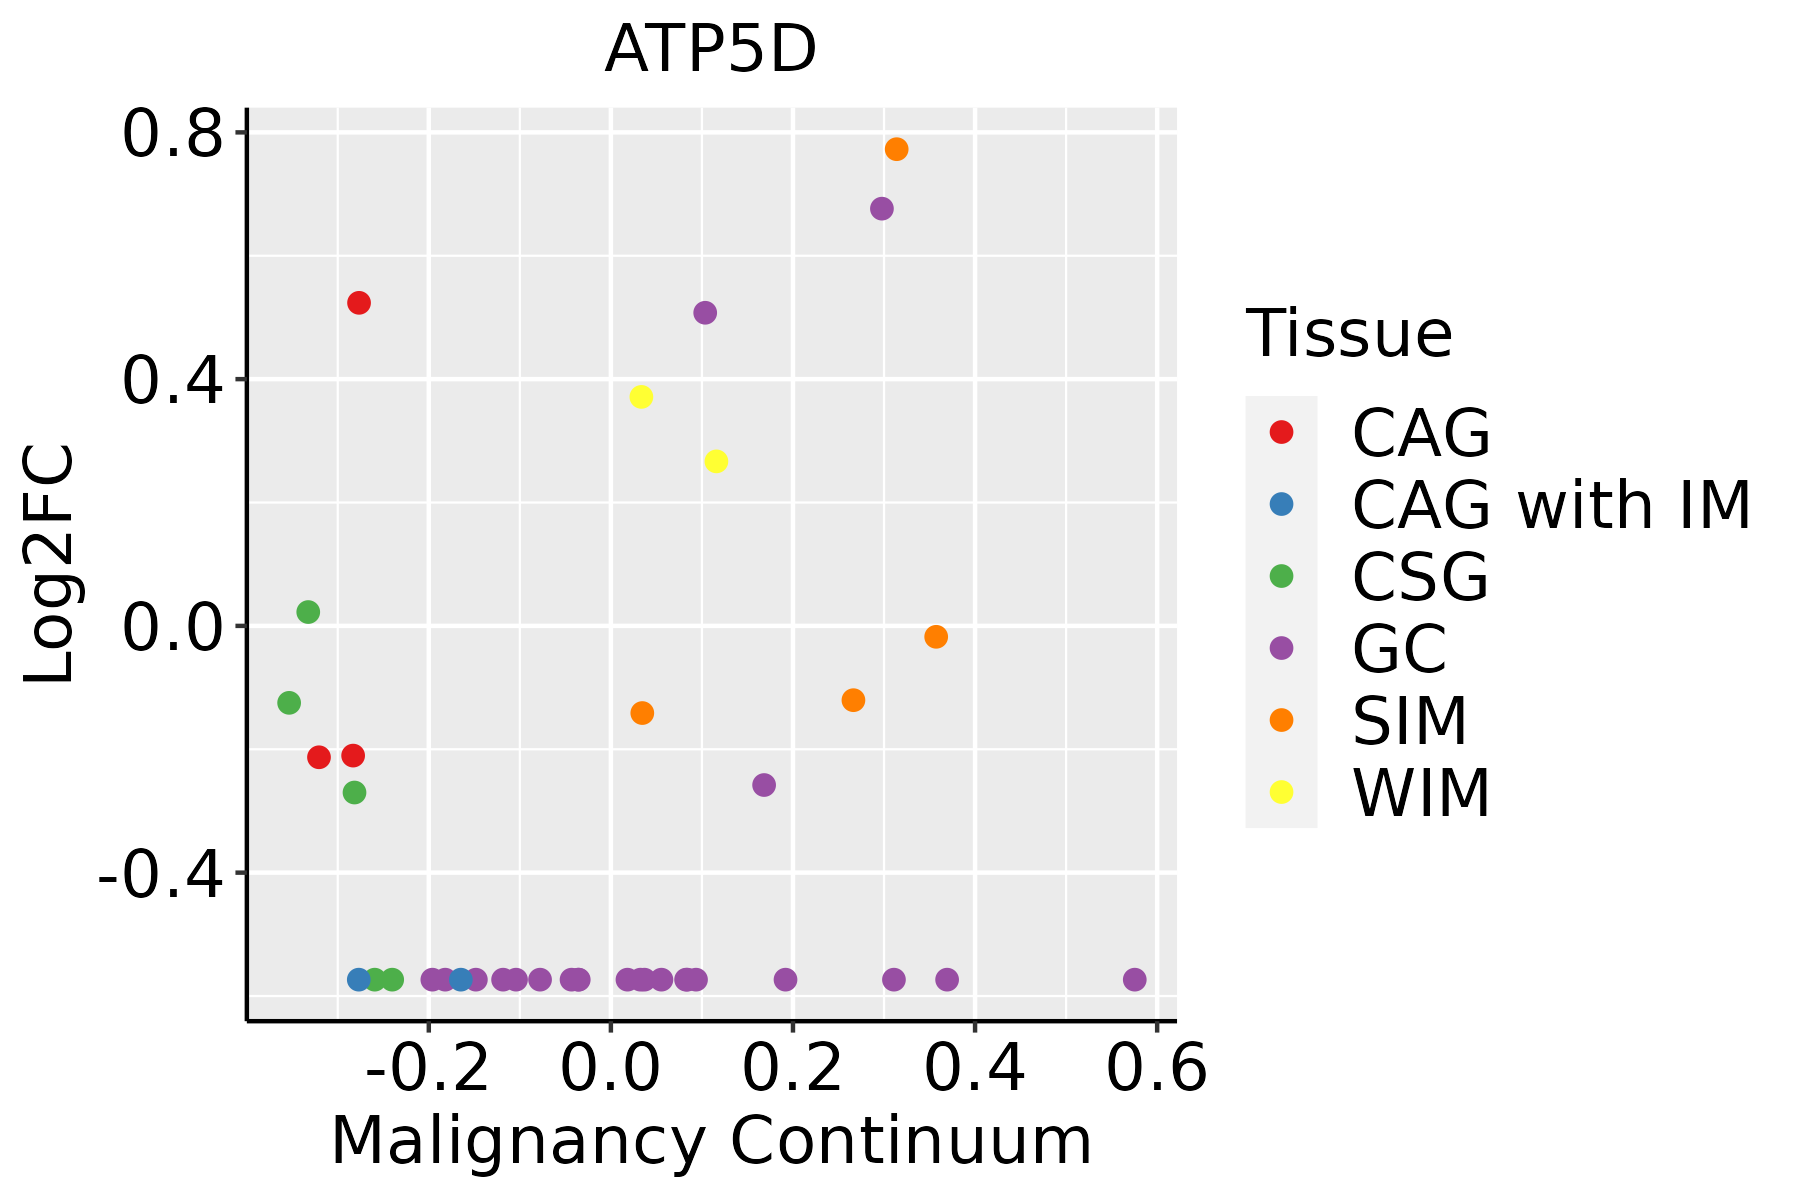 | CAG: Chronic atrophic gastritis |
| CAG with IM: Chronic atrophic gastritis with intestinal metaplasia | ||
| CSG: Chronic superficial gastritis | ||
| GC: Gastric cancer | ||
| SIM: Severe intestinal metaplasia | ||
| WIM: Wild intestinal metaplasia | ||
| Liver | 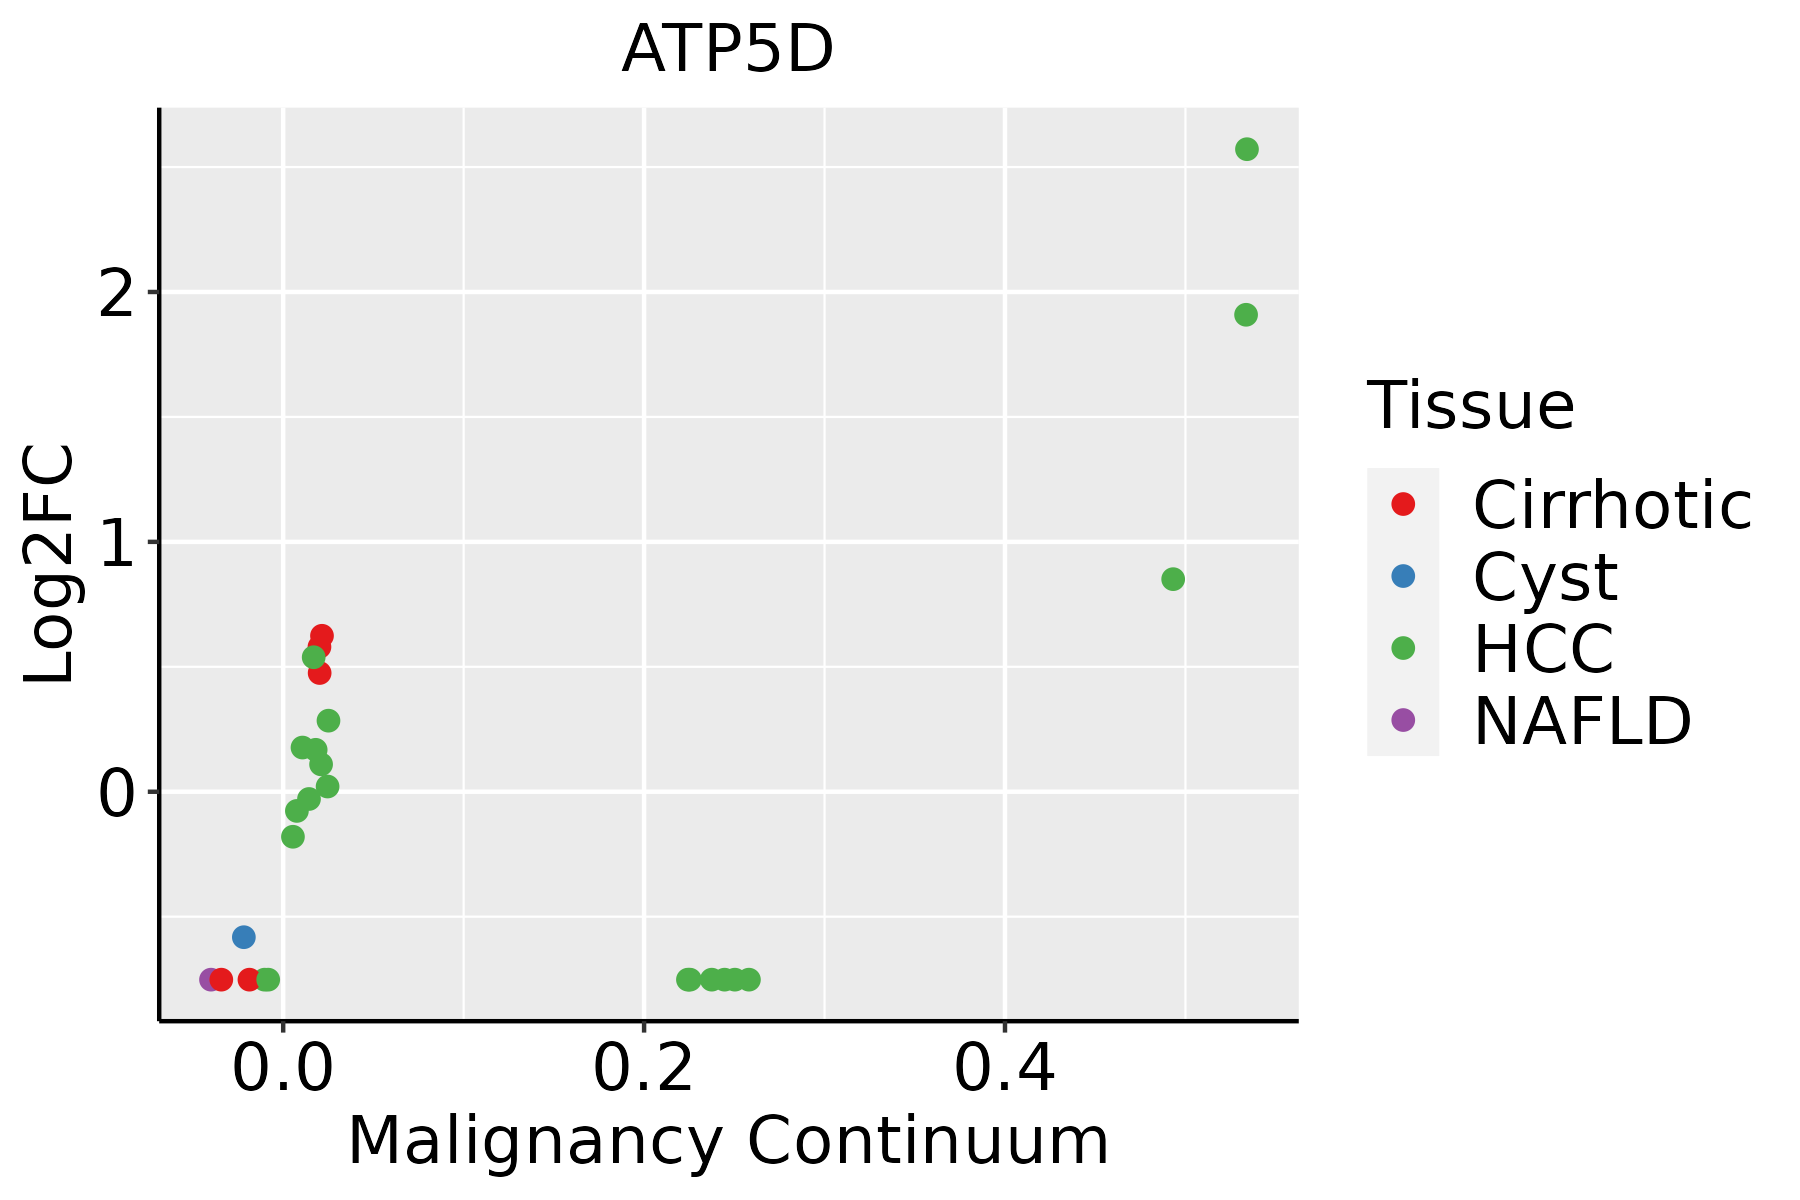 | HCC: Hepatocellular carcinoma |
| NAFLD: Non-alcoholic fatty liver disease | ||
| Oral Cavity |  | EOLP: Erosive Oral lichen planus |
| LP: leukoplakia | ||
| NEOLP: Non-erosive oral lichen planus | ||
| OSCC: Oral squamous cell carcinoma | ||
| Prostate | 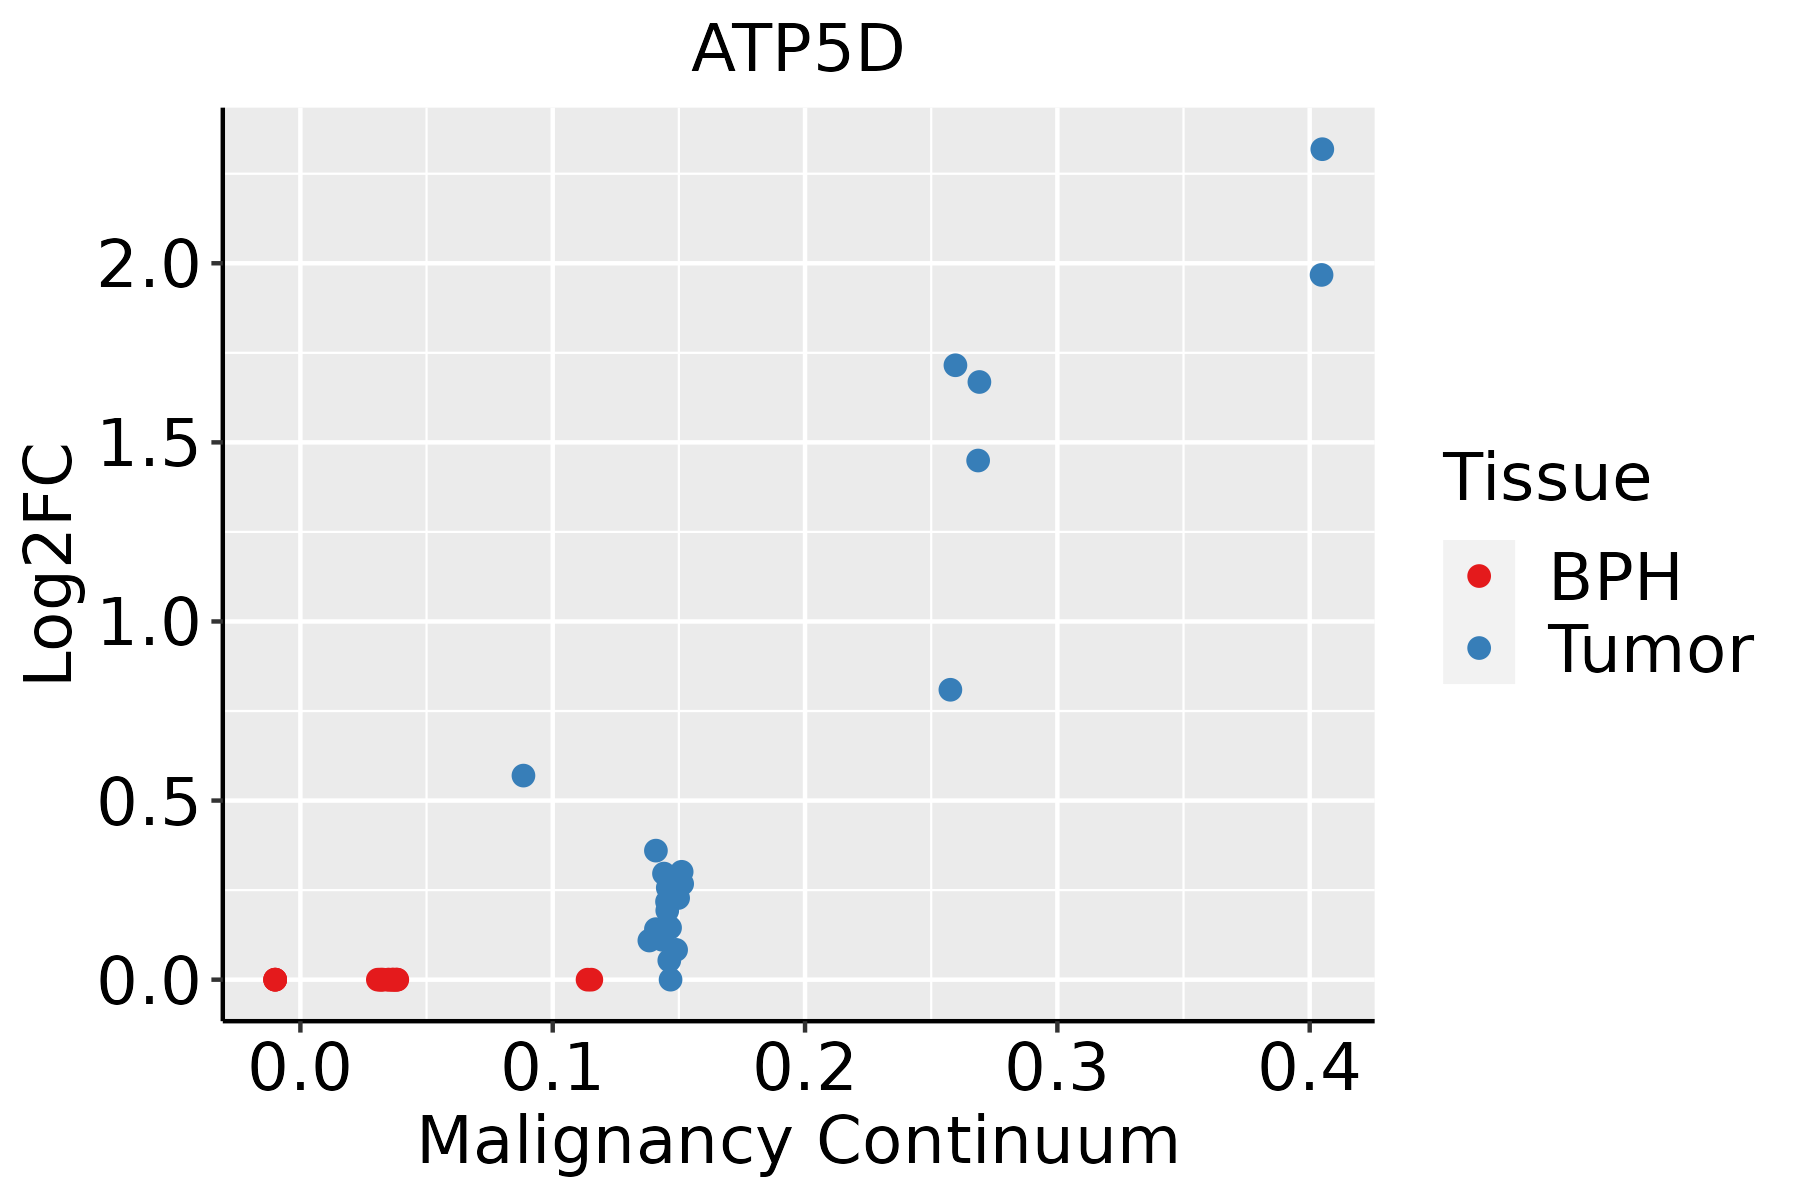 | BPH: Benign Prostatic Hyperplasia |
| Skin |  | AK: Actinic keratosis |
| cSCC: Cutaneous squamous cell carcinoma | ||
| SCCIS:squamous cell carcinoma in situ |
| ∗log2FC in expression of this searched gene in stem-like cells from each diseased tissue sample relative to stem-like cells in normal samples in each tissue plotted against the malignancy continuum. Samples are colored based on if they are from different disease stage. |
Top |
Malignant transformation related pathway analysis |
| Find out the enriched GO biological processes and KEGG pathways involved in transition from healthy to precancer to cancer |
| Tissue | Disease Stage | Enriched GO biological Processes |
| Colorectum | AD |  |
| Colorectum | SER |  |
| Colorectum | MSS |  |
| Colorectum | MSI-H |  |
| Colorectum | FAP |  |
| ∗Top 15 enriched GO BP terms are showed in the bar plot of each disease state in each tissue. Each row represents a significant GO biological process which is colored according to the -log10(p.adjust). |
| Page: 1 2 3 4 5 6 7 8 9 |
| GO ID | Tissue | Disease Stage | Description | Gene Ratio | Bg Ratio | pvalue | p.adjust | Count |
| Page: 1 |
| Pathway ID | Tissue | Disease Stage | Description | Gene Ratio | Bg Ratio | pvalue | p.adjust | qvalue | Count |
| hsa0019024 | Cervix | HSIL_HPV | Oxidative phosphorylation | 25/459 | 134/8465 | 4.23e-08 | 1.55e-06 | 1.25e-06 | 25 |
| hsa0541524 | Cervix | HSIL_HPV | Diabetic cardiomyopathy | 30/459 | 203/8465 | 4.38e-07 | 1.07e-05 | 8.64e-06 | 30 |
| hsa0501624 | Cervix | HSIL_HPV | Huntington disease | 38/459 | 306/8465 | 1.21e-06 | 2.54e-05 | 2.05e-05 | 38 |
| hsa0520825 | Cervix | HSIL_HPV | Chemical carcinogenesis - reactive oxygen species | 30/459 | 223/8465 | 3.28e-06 | 5.65e-05 | 4.57e-05 | 30 |
| hsa0502224 | Cervix | HSIL_HPV | Pathways of neurodegeneration - multiple diseases | 46/459 | 476/8465 | 8.10e-05 | 1.08e-03 | 8.72e-04 | 46 |
| hsa0501024 | Cervix | HSIL_HPV | Alzheimer disease | 38/459 | 384/8465 | 2.13e-04 | 2.31e-03 | 1.86e-03 | 38 |
| hsa0501424 | Cervix | HSIL_HPV | Amyotrophic lateral sclerosis | 35/459 | 364/8465 | 6.43e-04 | 5.23e-03 | 4.23e-03 | 35 |
| hsa0471425 | Cervix | HSIL_HPV | Thermogenesis | 25/459 | 232/8465 | 7.63e-04 | 5.88e-03 | 4.76e-03 | 25 |
| hsa0501235 | Cervix | HSIL_HPV | Parkinson disease | 43/459 | 266/8465 | 6.69e-11 | 6.53e-09 | 5.28e-09 | 43 |
| hsa0502034 | Cervix | HSIL_HPV | Prion disease | 40/459 | 273/8465 | 6.26e-09 | 3.67e-07 | 2.97e-07 | 40 |
| hsa0019034 | Cervix | HSIL_HPV | Oxidative phosphorylation | 25/459 | 134/8465 | 4.23e-08 | 1.55e-06 | 1.25e-06 | 25 |
| hsa0541534 | Cervix | HSIL_HPV | Diabetic cardiomyopathy | 30/459 | 203/8465 | 4.38e-07 | 1.07e-05 | 8.64e-06 | 30 |
| hsa0501634 | Cervix | HSIL_HPV | Huntington disease | 38/459 | 306/8465 | 1.21e-06 | 2.54e-05 | 2.05e-05 | 38 |
| hsa0520835 | Cervix | HSIL_HPV | Chemical carcinogenesis - reactive oxygen species | 30/459 | 223/8465 | 3.28e-06 | 5.65e-05 | 4.57e-05 | 30 |
| hsa0502234 | Cervix | HSIL_HPV | Pathways of neurodegeneration - multiple diseases | 46/459 | 476/8465 | 8.10e-05 | 1.08e-03 | 8.72e-04 | 46 |
| hsa0501034 | Cervix | HSIL_HPV | Alzheimer disease | 38/459 | 384/8465 | 2.13e-04 | 2.31e-03 | 1.86e-03 | 38 |
| hsa0501434 | Cervix | HSIL_HPV | Amyotrophic lateral sclerosis | 35/459 | 364/8465 | 6.43e-04 | 5.23e-03 | 4.23e-03 | 35 |
| hsa0471435 | Cervix | HSIL_HPV | Thermogenesis | 25/459 | 232/8465 | 7.63e-04 | 5.88e-03 | 4.76e-03 | 25 |
| hsa05012 | Colorectum | AD | Parkinson disease | 147/2092 | 266/8465 | 2.53e-27 | 8.48e-25 | 5.41e-25 | 147 |
| hsa05208 | Colorectum | AD | Chemical carcinogenesis - reactive oxygen species | 126/2092 | 223/8465 | 1.01e-24 | 1.68e-22 | 1.07e-22 | 126 |
| Page: 1 2 3 4 5 6 7 8 9 10 11 12 13 14 15 16 17 18 |
Top |
Cell-cell communication analysis |
| Identification of potential cell-cell interactions between two cell types and their ligand-receptor pairs for different disease states |
| Ligand | Receptor | LRpair | Pathway | Tissue | Disease Stage |
| Page: 1 |
Top |
Single-cell gene regulatory network inference analysis |
| Find out the significant the regulons (TFs) and the target genes of each regulon across cell types for different disease states |
| TF | Cell Type | Tissue | Disease Stage | Target Gene | RSS | Regulon Activity |
| ∗The dot plots of a searched regulon are shown for all cell subpopulations in each disease state of each tissue based on the regulon specific score inferred using pySCENIC and by calculating the average expression. |
| Page: 1 |
Top |
Somatic mutation of malignant transformation related genes |
| Annotation of somatic variants for genes involved in malignant transformation |
| Hugo Symbol | Variant Class | Variant Classification | dbSNP RS | HGVSc | HGVSp | HGVSp Short | SWISSPROT | BIOTYPE | SIFT | PolyPhen | Tumor Sample Barcode | Tissue | Histology | Sex | Age | Stage | Therapy Types | Drugs | Outcome |
| ATP5D | SNV | Missense_Mutation | c.217N>T | p.His73Tyr | p.H73Y | P30049 | protein_coding | deleterious(0) | probably_damaging(0.998) | TCGA-EX-A1H6-01 | Cervix | cervical & endocervical cancer | Female | <65 | I/II | Unknown | Unknown | SD | |
| ATP5D | SNV | Missense_Mutation | rs781350269 | c.416C>T | p.Ala139Val | p.A139V | P30049 | protein_coding | deleterious(0.01) | benign(0.284) | TCGA-AA-A022-01 | Colorectum | colon adenocarcinoma | Female | >=65 | I/II | Unknown | Unknown | SD |
| ATP5D | SNV | Missense_Mutation | c.217C>T | p.His73Tyr | p.H73Y | P30049 | protein_coding | deleterious(0) | probably_damaging(0.998) | TCGA-AH-6644-01 | Colorectum | rectum adenocarcinoma | Male | >=65 | III/IV | Unknown | Unknown | SD | |
| ATP5D | SNV | Missense_Mutation | rs753537314 | c.349N>A | p.Glu117Lys | p.E117K | P30049 | protein_coding | deleterious(0) | probably_damaging(1) | TCGA-B5-A0JY-01 | Endometrium | uterine corpus endometrioid carcinoma | Female | <65 | III/IV | Chemotherapy | doxorubicin | SD |
| ATP5D | SNV | Missense_Mutation | novel | c.196N>A | p.Ala66Thr | p.A66T | P30049 | protein_coding | tolerated(0.17) | benign(0.02) | TCGA-DF-A2KU-01 | Endometrium | uterine corpus endometrioid carcinoma | Female | Unknown | I/II | Unknown | Unknown | SD |
| Page: 1 |
Top |
Related drugs of malignant transformation related genes |
| Identification of chemicals and drugs interact with genes involved in malignant transfromation |
| (DGIdb 4.0) |
| Entrez ID | Symbol | Category | Interaction Types | Drug Claim Name | Drug Name | PMIDs |
| Page: 1 |

Copyright 2023-Present -The University of Texas Health Science Center at Houston |