| Tissue | Expression Dynamics | Abbreviation |
| Breast | 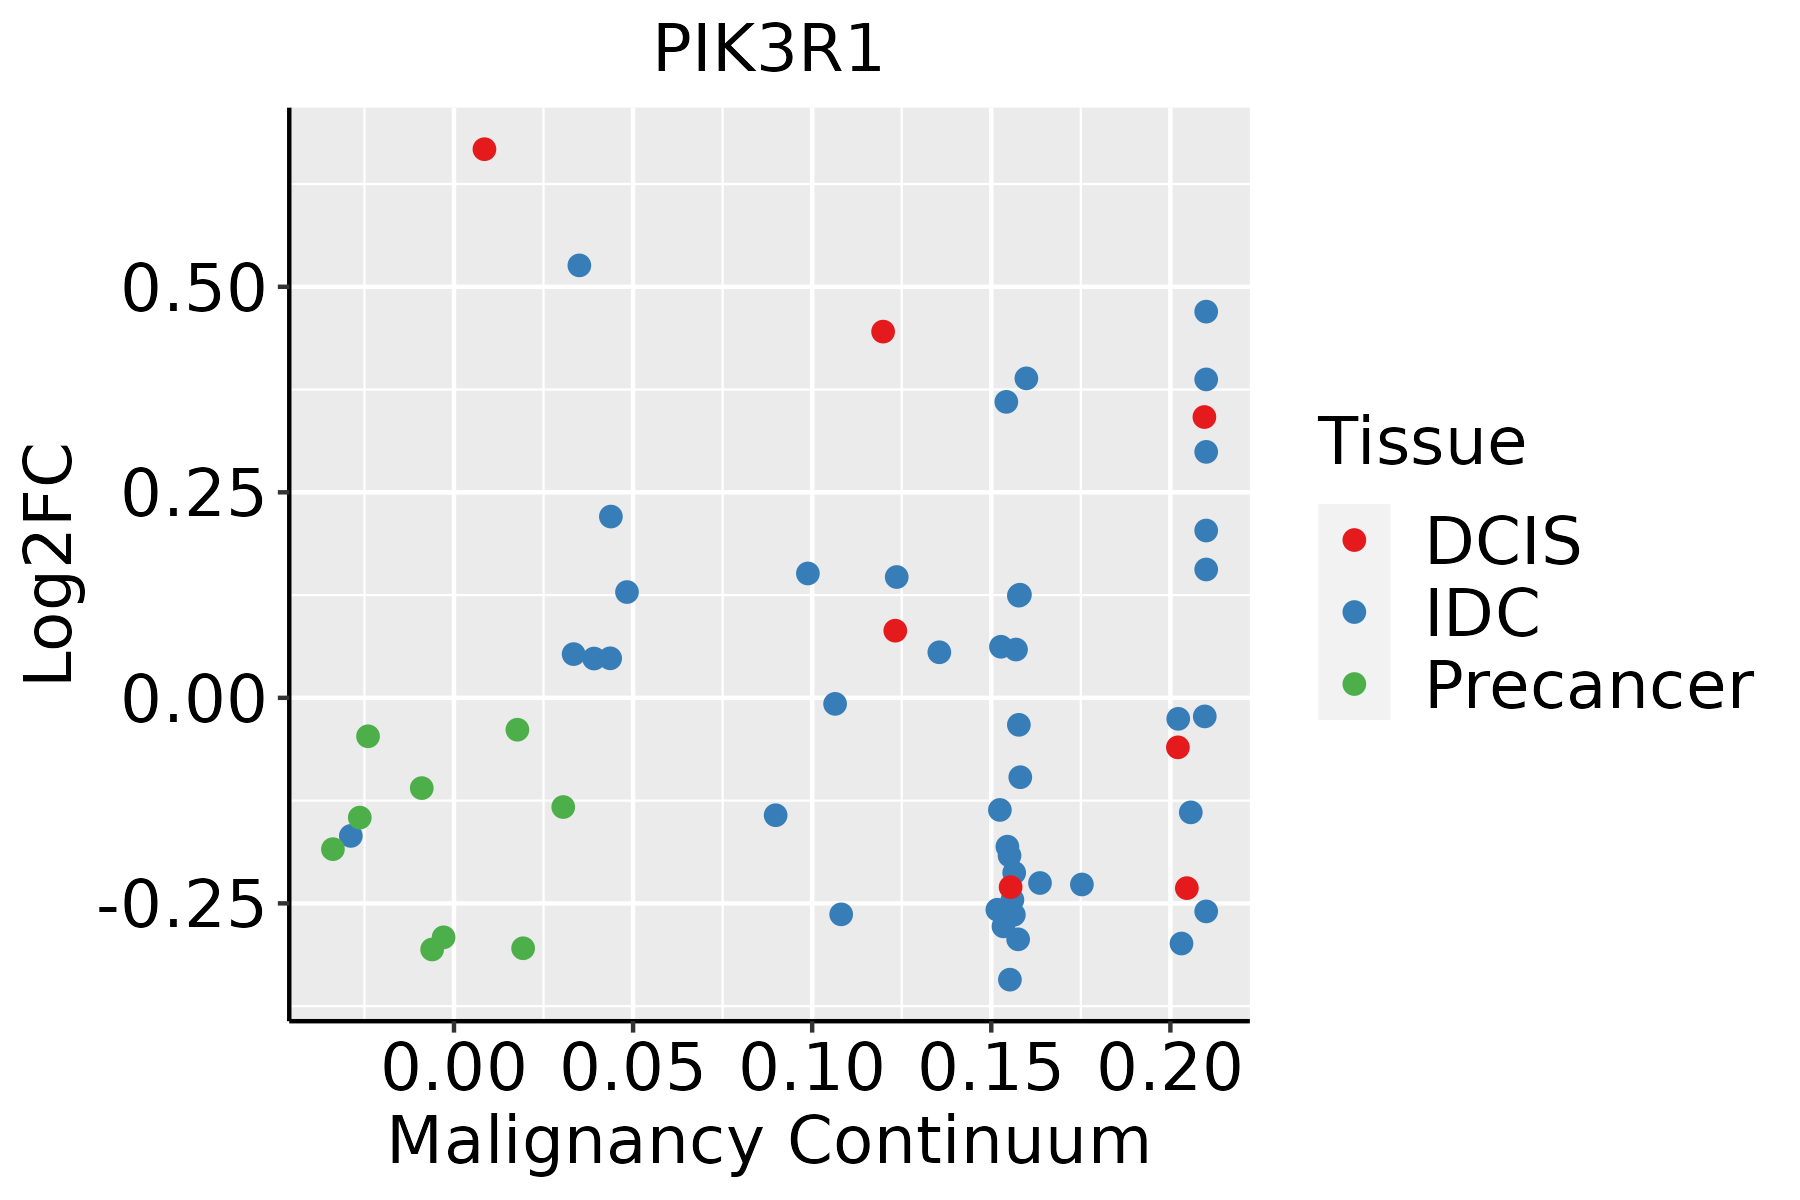 | IDC: Invasive ductal carcinoma |
| DCIS: Ductal carcinoma in situ |
| Precancer(BRCA1-mut): Precancerous lesion from BRCA1 mutation carriers |
| Cervix |  | CC: Cervix cancer |
| HSIL_HPV: HPV-infected high-grade squamous intraepithelial lesions |
| N_HPV: HPV-infected normal cervix |
| Colorectum (GSE201348) |  | FAP: Familial adenomatous polyposis |
| CRC: Colorectal cancer |
| Colorectum (HTA11) |  | AD: Adenomas |
| SER: Sessile serrated lesions |
| MSI-H: Microsatellite-high colorectal cancer |
| MSS: Microsatellite stable colorectal cancer |
| Endometrium | 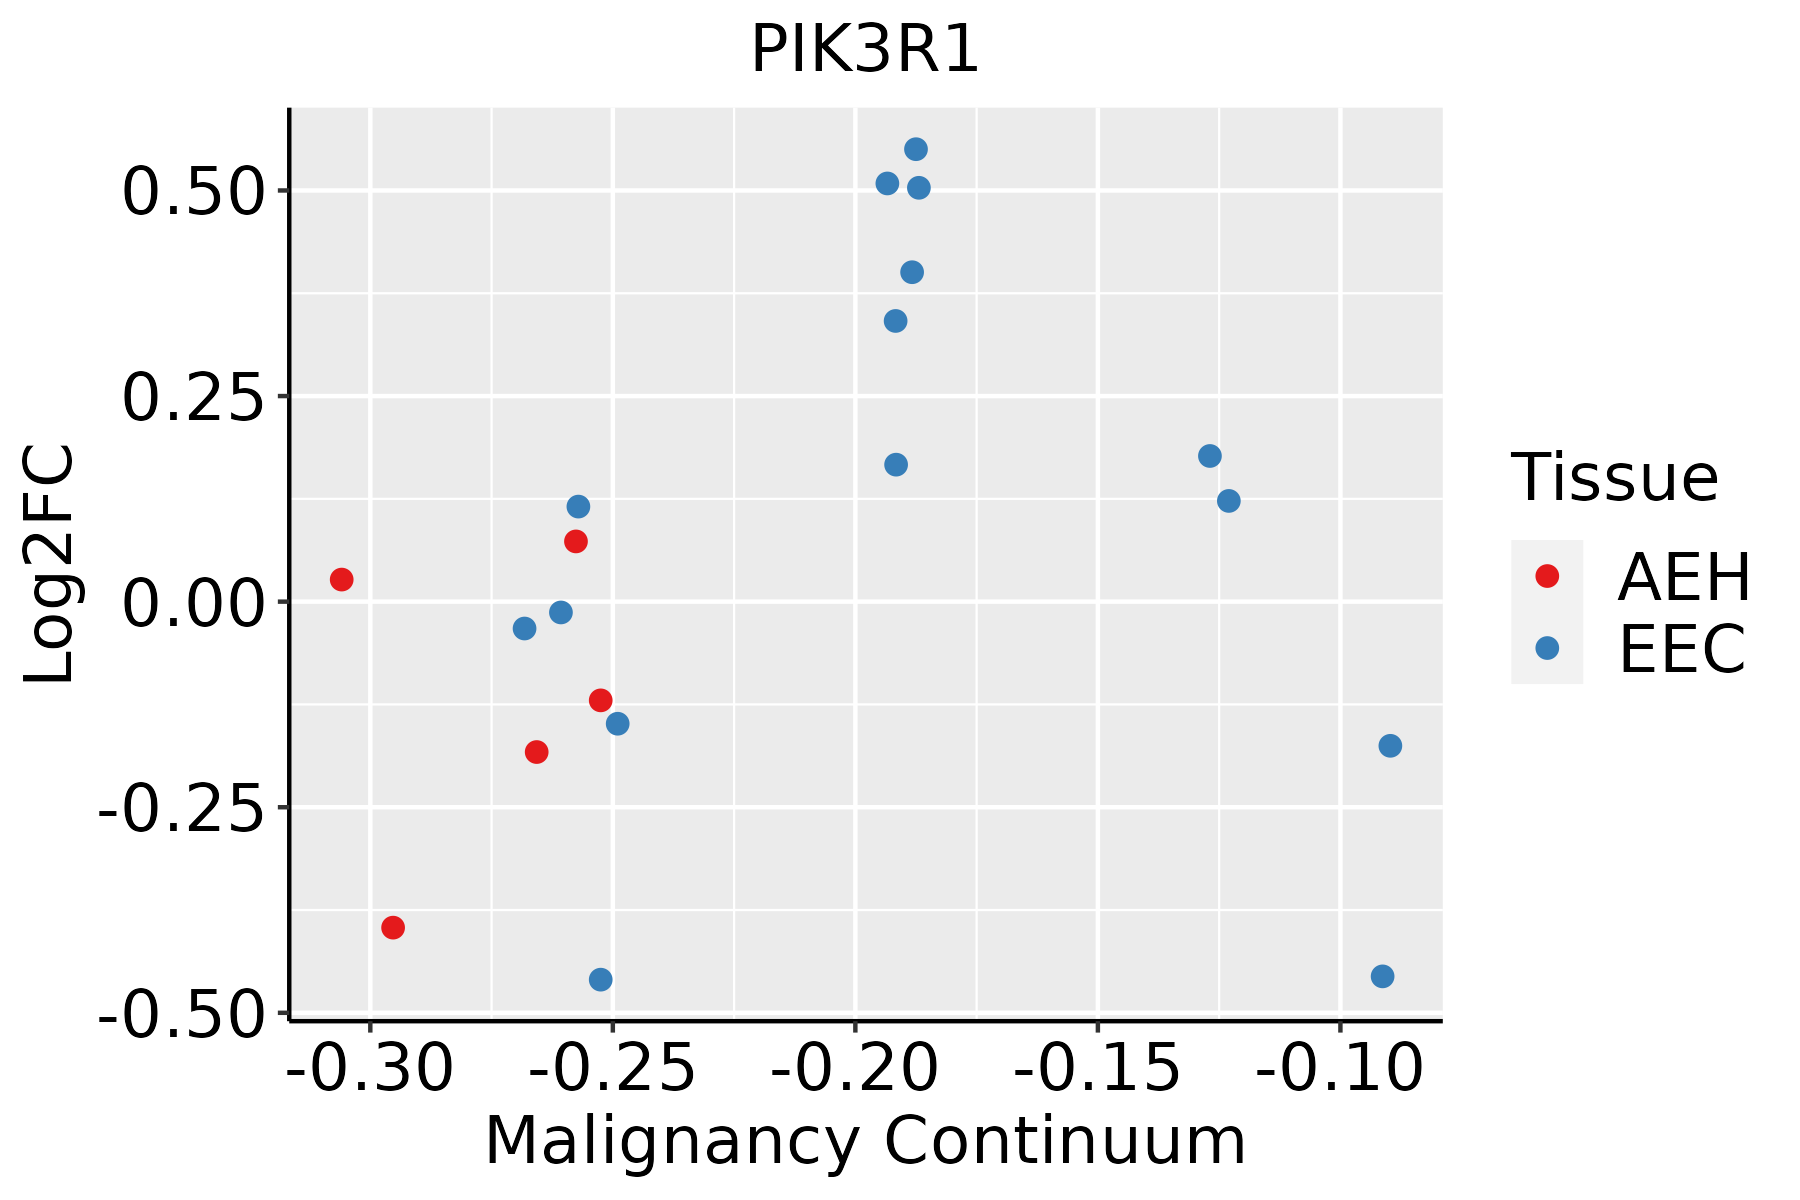 | AEH: Atypical endometrial hyperplasia |
| EEC: Endometrioid Cancer |
| Esophagus |  | ESCC: Esophageal squamous cell carcinoma |
| HGIN: High-grade intraepithelial neoplasias |
| LGIN: Low-grade intraepithelial neoplasias |
| Liver | 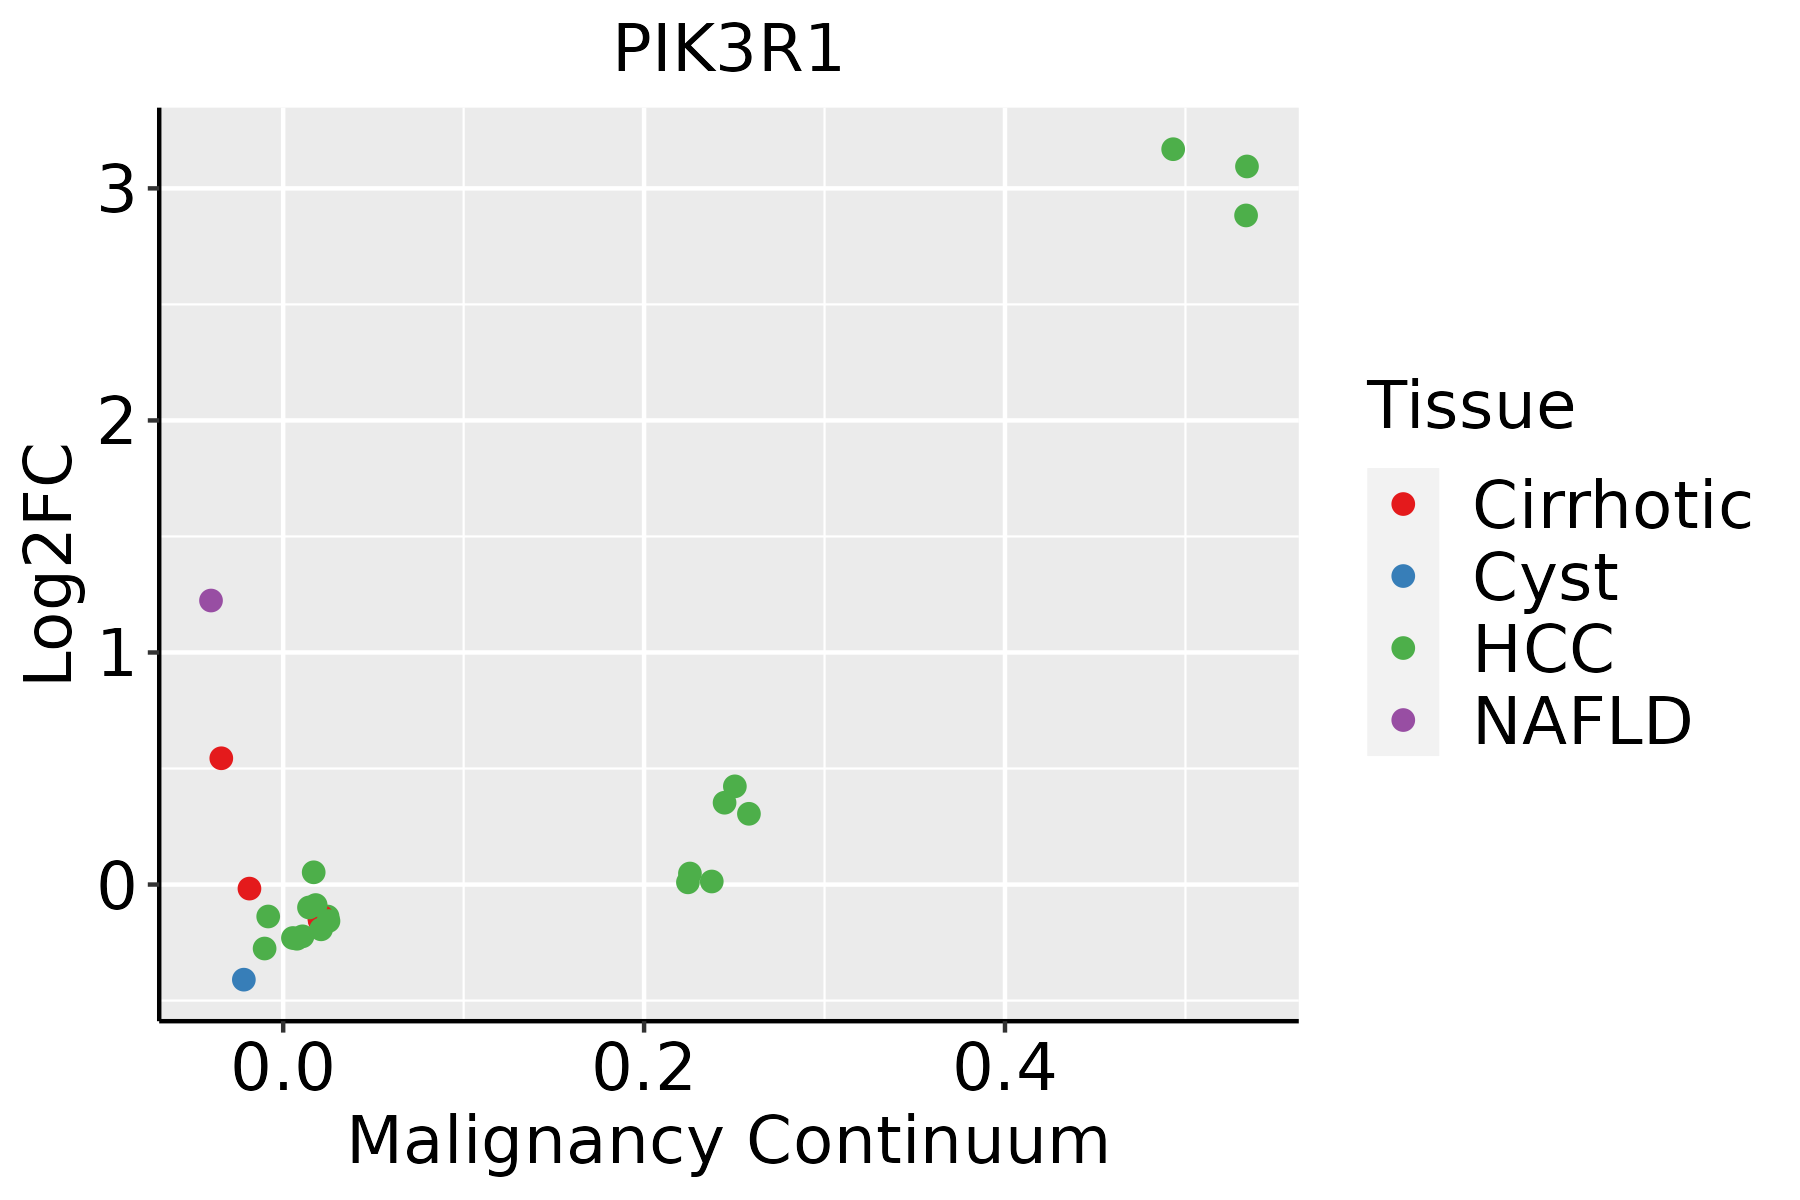 | HCC: Hepatocellular carcinoma |
| NAFLD: Non-alcoholic fatty liver disease |
| Prostate | 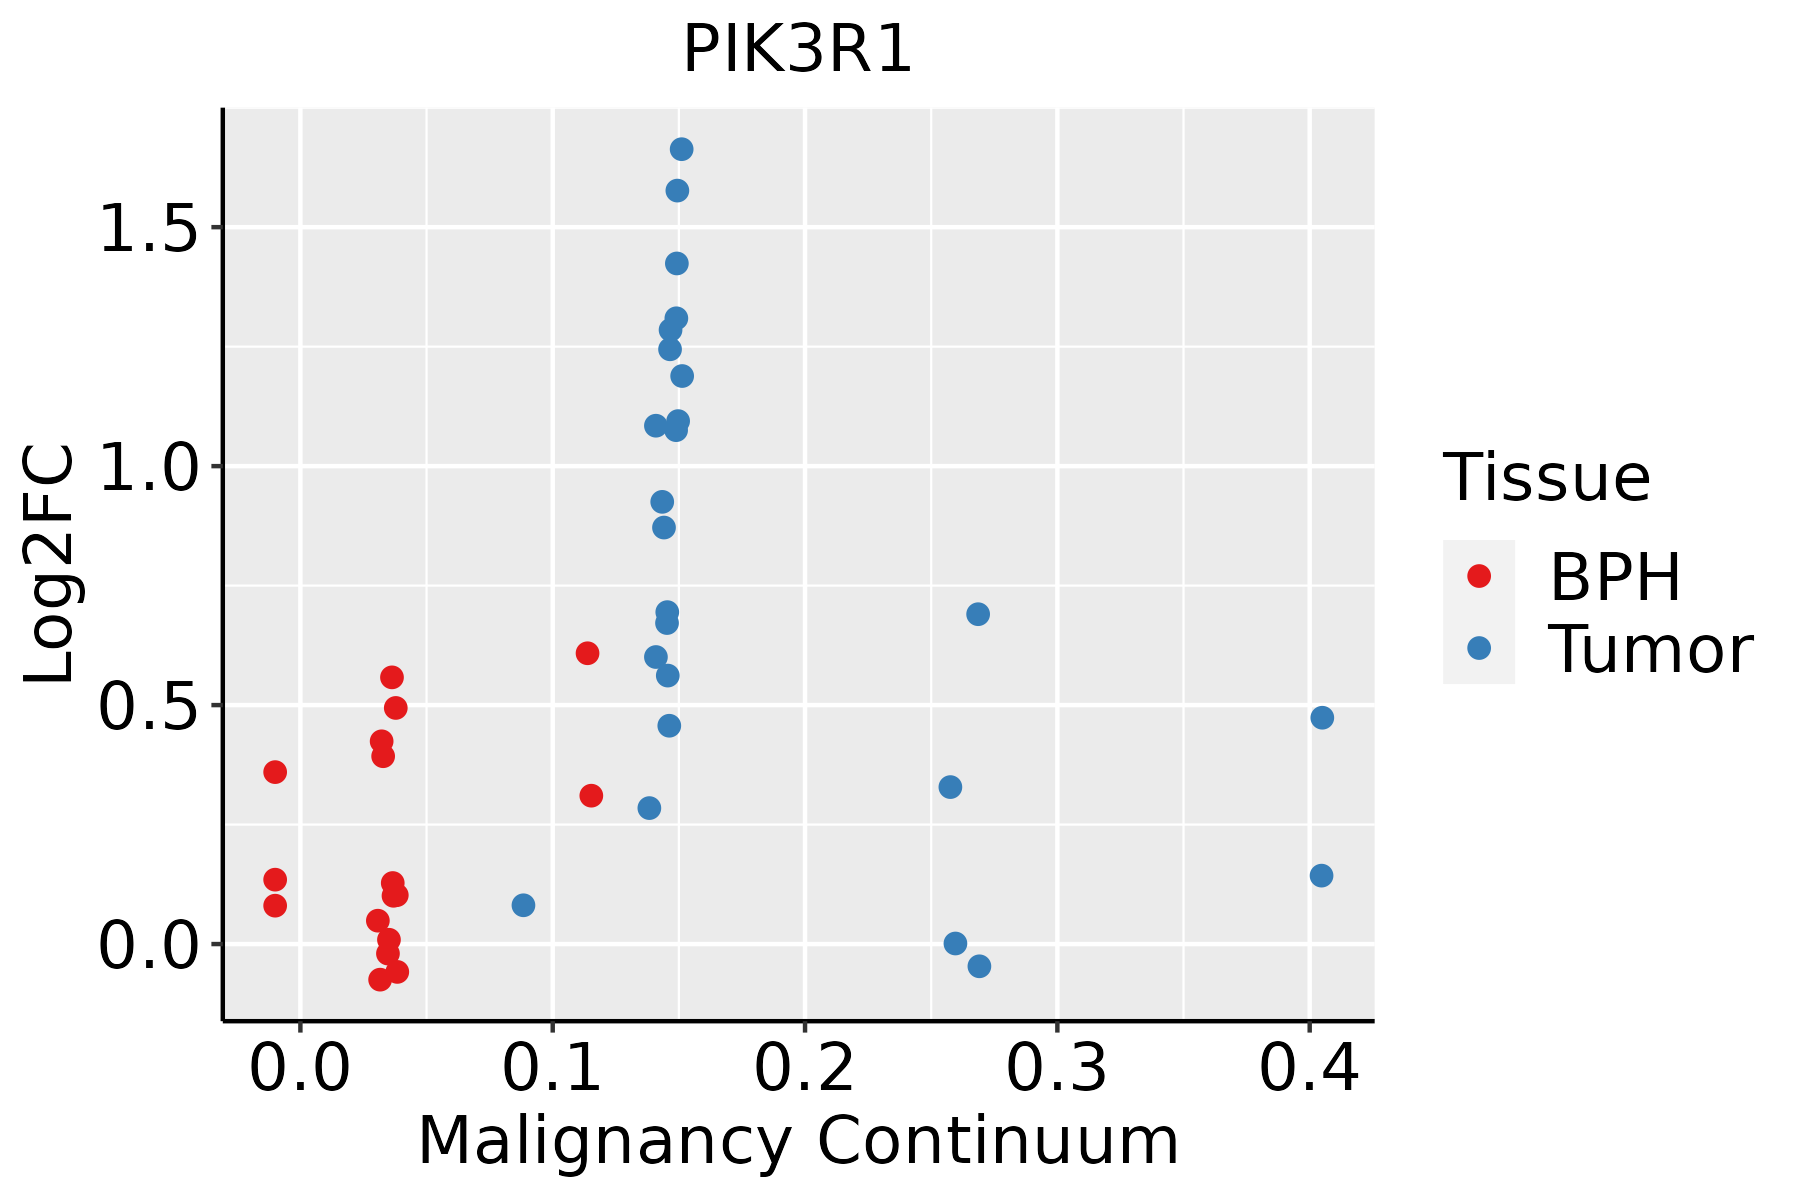 | BPH: Benign Prostatic Hyperplasia |
| Skin | 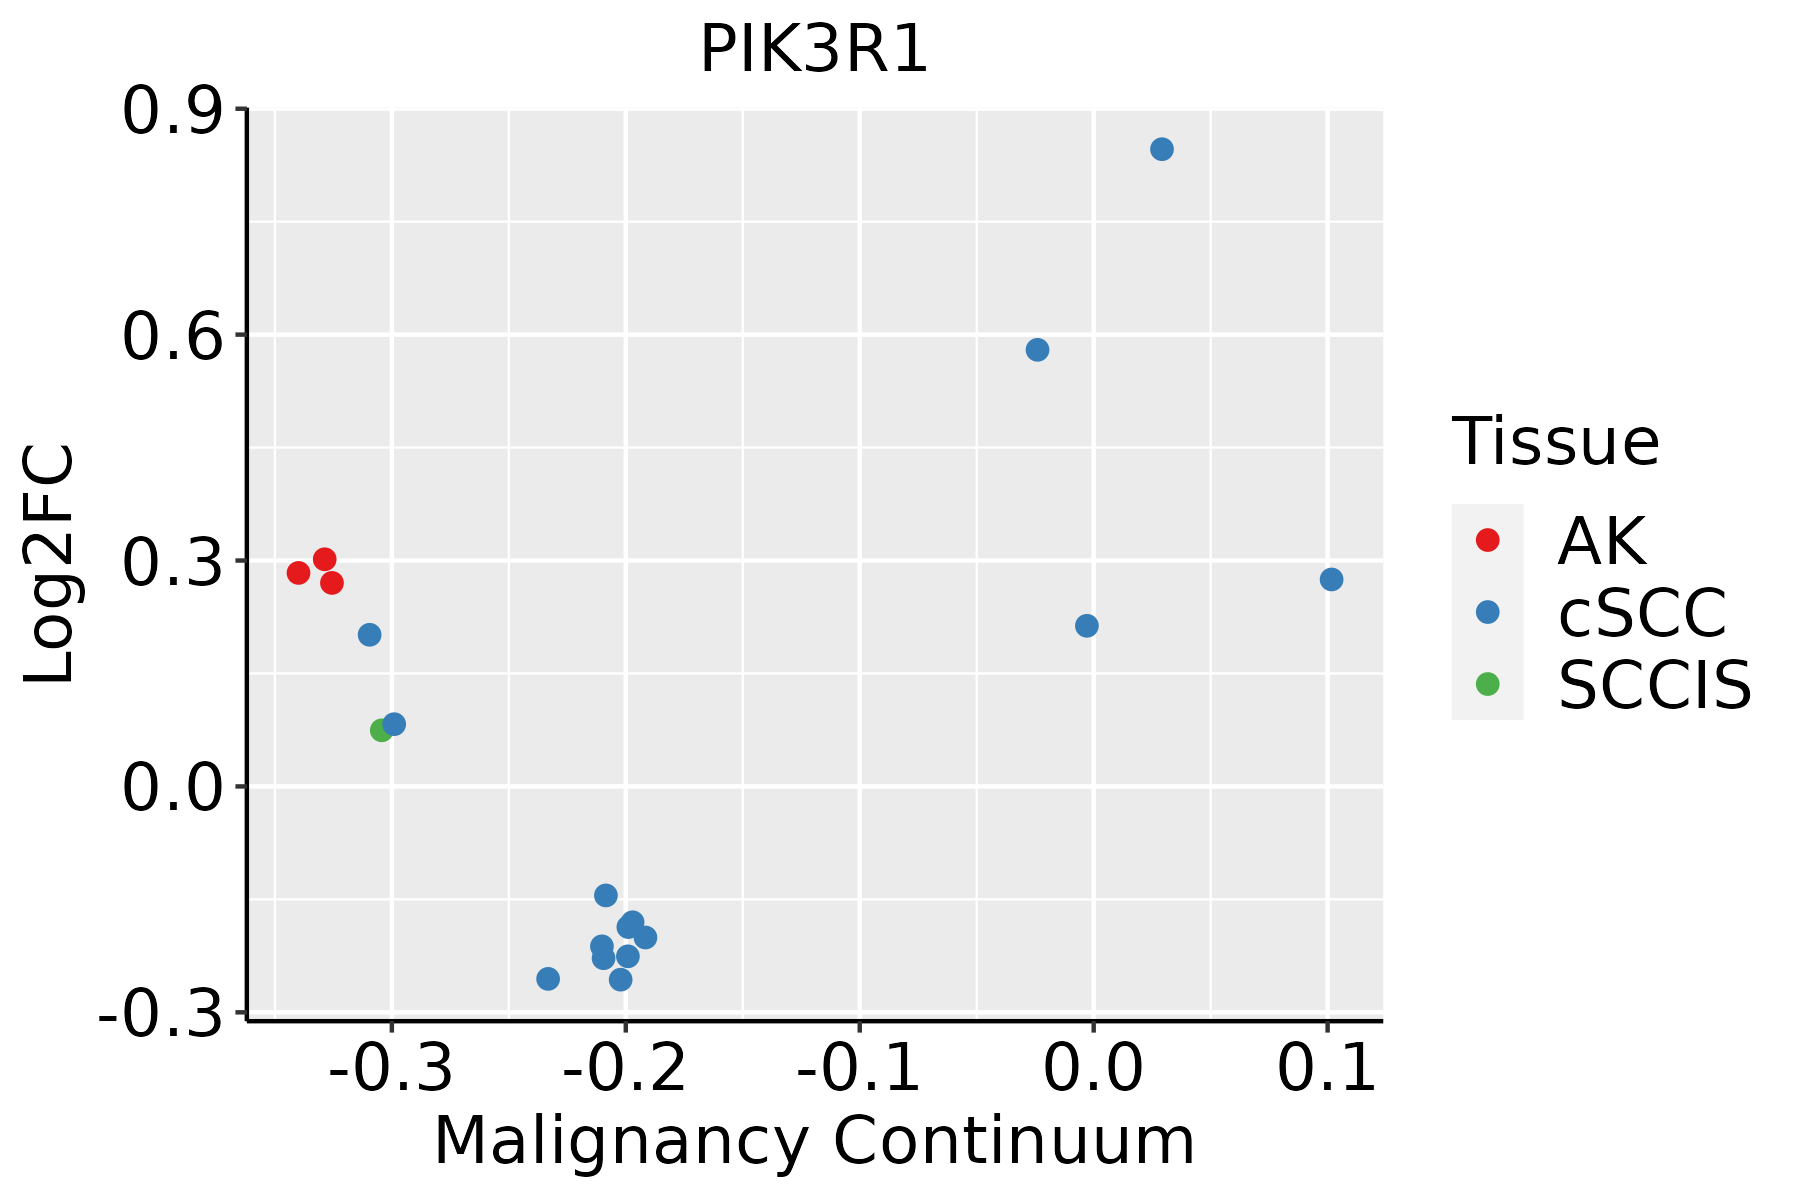 | AK: Actinic keratosis |
| cSCC: Cutaneous squamous cell carcinoma |
| SCCIS:squamous cell carcinoma in situ |
| Thyroid |  | ATC: Anaplastic thyroid cancer |
| HT: Hashimoto's thyroiditis |
| PTC: Papillary thyroid cancer |
| GO ID | Tissue | Disease Stage | Description | Gene Ratio | Bg Ratio | pvalue | p.adjust | Count |
| GO:00971939 | Breast | Precancer | intrinsic apoptotic signaling pathway | 59/1080 | 288/18723 | 8.07e-18 | 3.60e-15 | 59 |
| GO:00083809 | Breast | Precancer | RNA splicing | 65/1080 | 434/18723 | 1.27e-12 | 2.53e-10 | 65 |
| GO:00434849 | Breast | Precancer | regulation of RNA splicing | 34/1080 | 148/18723 | 2.66e-12 | 4.75e-10 | 34 |
| GO:00069869 | Breast | Precancer | response to unfolded protein | 28/1080 | 137/18723 | 3.81e-09 | 3.00e-07 | 28 |
| GO:00359669 | Breast | Precancer | response to topologically incorrect protein | 29/1080 | 159/18723 | 3.00e-08 | 1.89e-06 | 29 |
| GO:00349769 | Breast | Precancer | response to endoplasmic reticulum stress | 38/1080 | 256/18723 | 7.89e-08 | 4.60e-06 | 38 |
| GO:00346209 | Breast | Precancer | cellular response to unfolded protein | 21/1080 | 96/18723 | 9.80e-08 | 5.46e-06 | 21 |
| GO:00359679 | Breast | Precancer | cellular response to topologically incorrect protein | 22/1080 | 116/18723 | 6.84e-07 | 2.80e-05 | 22 |
| GO:00508219 | Breast | Precancer | protein stabilization | 29/1080 | 191/18723 | 1.67e-06 | 6.08e-05 | 29 |
| GO:00316479 | Breast | Precancer | regulation of protein stability | 38/1080 | 298/18723 | 3.73e-06 | 1.19e-04 | 38 |
| GO:00300999 | Breast | Precancer | myeloid cell differentiation | 45/1080 | 381/18723 | 4.00e-06 | 1.25e-04 | 45 |
| GO:00018196 | Breast | Precancer | positive regulation of cytokine production | 52/1080 | 467/18723 | 4.18e-06 | 1.29e-04 | 52 |
| GO:00971919 | Breast | Precancer | extrinsic apoptotic signaling pathway | 30/1080 | 219/18723 | 9.42e-06 | 2.50e-04 | 30 |
| GO:19058979 | Breast | Precancer | regulation of response to endoplasmic reticulum stress | 16/1080 | 82/18723 | 1.53e-05 | 3.75e-04 | 16 |
| GO:00309687 | Breast | Precancer | endoplasmic reticulum unfolded protein response | 15/1080 | 74/18723 | 1.74e-05 | 4.17e-04 | 15 |
| GO:00456379 | Breast | Precancer | regulation of myeloid cell differentiation | 28/1080 | 210/18723 | 3.05e-05 | 6.72e-04 | 28 |
| GO:19037069 | Breast | Precancer | regulation of hemopoiesis | 41/1080 | 367/18723 | 3.95e-05 | 8.52e-04 | 41 |
| GO:19029039 | Breast | Precancer | regulation of supramolecular fiber organization | 42/1080 | 383/18723 | 4.92e-05 | 1.04e-03 | 42 |
| GO:00025737 | Breast | Precancer | myeloid leukocyte differentiation | 27/1080 | 208/18723 | 6.72e-05 | 1.35e-03 | 27 |
| GO:00093148 | Breast | Precancer | response to radiation | 47/1080 | 456/18723 | 8.39e-05 | 1.62e-03 | 47 |
| Pathway ID | Tissue | Disease Stage | Description | Gene Ratio | Bg Ratio | pvalue | p.adjust | qvalue | Count |
| hsa0152115 | Esophagus | ESCC | EGFR tyrosine kinase inhibitor resistance | 55/4205 | 79/8465 | 2.44e-04 | 8.78e-04 | 4.50e-04 | 55 |
| hsa0521418 | Esophagus | ESCC | Glioma | 52/4205 | 75/8465 | 4.20e-04 | 1.45e-03 | 7.43e-04 | 52 |
| hsa0415013 | Esophagus | ESCC | mTOR signaling pathway | 98/4205 | 156/8465 | 5.81e-04 | 1.95e-03 | 9.97e-04 | 98 |
| hsa04919113 | Esophagus | ESCC | Thyroid hormone signaling pathway | 78/4205 | 121/8465 | 6.79e-04 | 2.23e-03 | 1.14e-03 | 78 |
| hsa04666110 | Esophagus | ESCC | Fc gamma R-mediated phagocytosis | 63/4205 | 97/8465 | 1.63e-03 | 4.89e-03 | 2.50e-03 | 63 |
| hsa0492616 | Esophagus | ESCC | Relaxin signaling pathway | 81/4205 | 129/8465 | 1.72e-03 | 5.09e-03 | 2.61e-03 | 81 |
| hsa0401219 | Esophagus | ESCC | ErbB signaling pathway | 56/4205 | 85/8465 | 1.78e-03 | 5.24e-03 | 2.68e-03 | 56 |
| hsa0493113 | Esophagus | ESCC | Insulin resistance | 69/4205 | 108/8465 | 1.92e-03 | 5.54e-03 | 2.84e-03 | 69 |
| hsa0421115 | Esophagus | ESCC | Longevity regulating pathway | 58/4205 | 89/8465 | 2.19e-03 | 6.16e-03 | 3.16e-03 | 58 |
| hsa0523511 | Esophagus | ESCC | PD-L1 expression and PD-1 checkpoint pathway in cancer | 58/4205 | 89/8465 | 2.19e-03 | 6.16e-03 | 3.16e-03 | 58 |
| hsa0152215 | Esophagus | ESCC | Endocrine resistance | 63/4205 | 98/8465 | 2.38e-03 | 6.58e-03 | 3.37e-03 | 63 |
| hsa0522316 | Esophagus | ESCC | Non-small cell lung cancer | 48/4205 | 72/8465 | 2.57e-03 | 7.05e-03 | 3.61e-03 | 48 |
| hsa0514213 | Esophagus | ESCC | Chagas disease | 65/4205 | 102/8465 | 2.81e-03 | 7.59e-03 | 3.89e-03 | 65 |
| hsa0436017 | Esophagus | ESCC | Axon guidance | 108/4205 | 182/8465 | 5.13e-03 | 1.30e-02 | 6.67e-03 | 108 |
| hsa04810112 | Esophagus | ESCC | Regulation of actin cytoskeleton | 133/4205 | 229/8465 | 5.94e-03 | 1.48e-02 | 7.56e-03 | 133 |
| hsa0523114 | Esophagus | ESCC | Choline metabolism in cancer | 61/4205 | 98/8465 | 7.97e-03 | 1.92e-02 | 9.84e-03 | 61 |
| hsa0415114 | Esophagus | ESCC | PI3K-Akt signaling pathway | 197/4205 | 354/8465 | 1.24e-02 | 2.83e-02 | 1.45e-02 | 197 |
| hsa0466013 | Esophagus | ESCC | T cell receptor signaling pathway | 63/4205 | 104/8465 | 1.60e-02 | 3.60e-02 | 1.84e-02 | 63 |
| hsa0517114 | Liver | NAFLD | Coronavirus disease - COVID-19 | 111/1043 | 232/8465 | 1.01e-41 | 3.32e-39 | 2.67e-39 | 111 |
| hsa0481010 | Liver | NAFLD | Regulation of actin cytoskeleton | 50/1043 | 229/8465 | 3.01e-05 | 7.59e-04 | 6.11e-04 | 50 |
| Hugo Symbol | Variant Class | Variant Classification | dbSNP RS | HGVSc | HGVSp | HGVSp Short | SWISSPROT | BIOTYPE | SIFT | PolyPhen | Tumor Sample Barcode | Tissue | Histology | Sex | Age | Stage | Therapy Types | Drugs | Outcome |
| PIK3R1 | SNV | Missense_Mutation | novel | c.1218N>A | p.Asn406Lys | p.N406K | P27986 | protein_coding | tolerated(0.08) | benign(0.414) | TCGA-AO-A0JG-01 | Breast | breast invasive carcinoma | Female | <65 | III/IV | Chemotherapy | doxorubicin | SD |
| PIK3R1 | SNV | Missense_Mutation | novel | c.166N>G | p.Leu56Val | p.L56V | P27986 | protein_coding | deleterious(0.02) | possibly_damaging(0.734) | TCGA-AO-A1KT-01 | Breast | breast invasive carcinoma | Female | >=65 | I/II | Chemotherapy | fluorouracil | SD |
| PIK3R1 | SNV | Missense_Mutation | | c.1390N>A | p.Asp464Asn | p.D464N | P27986 | protein_coding | deleterious(0) | probably_damaging(0.986) | TCGA-AR-A0TQ-01 | Breast | breast invasive carcinoma | Female | <65 | III/IV | Chemotherapy | doxorubicin | SD |
| PIK3R1 | SNV | Missense_Mutation | | c.1529N>T | p.Glu510Val | p.E510V | P27986 | protein_coding | deleterious(0) | possibly_damaging(0.895) | TCGA-AR-A24M-01 | Breast | breast invasive carcinoma | Female | <65 | III/IV | Hormone Therapy | tamoxiphen | SD |
| PIK3R1 | SNV | Missense_Mutation | | c.1676T>C | p.Ile559Thr | p.I559T | P27986 | protein_coding | tolerated(0.19) | possibly_damaging(0.499) | TCGA-BH-A1FD-01 | Breast | breast invasive carcinoma | Female | >=65 | I/II | Unknown | Unknown | PD |
| PIK3R1 | SNV | Missense_Mutation | | c.1319N>G | p.Asp440Gly | p.D440G | P27986 | protein_coding | deleterious(0.02) | benign(0.108) | TCGA-C8-A135-01 | Breast | breast invasive carcinoma | Female | <65 | I/II | Chemotherapy | 5-fluorouracil | CR |
| PIK3R1 | SNV | Missense_Mutation | novel | c.166T>G | p.Leu56Val | p.L56V | P27986 | protein_coding | deleterious(0.02) | possibly_damaging(0.734) | TCGA-D8-A1JK-01 | Breast | breast invasive carcinoma | Female | >=65 | I/II | Unknown | Unknown | SD |
| PIK3R1 | SNV | Missense_Mutation | | c.1930G>T | p.Gly644Cys | p.G644C | P27986 | protein_coding | deleterious(0) | probably_damaging(1) | TCGA-D8-A1XK-01 | Breast | breast invasive carcinoma | Female | <65 | I/II | Chemotherapy | doxorubicine+cyclophosphamide | SD |
| PIK3R1 | SNV | Missense_Mutation | | c.2007T>A | p.His669Gln | p.H669Q | P27986 | protein_coding | deleterious(0) | probably_damaging(0.992) | TCGA-D8-A1XK-01 | Breast | breast invasive carcinoma | Female | <65 | I/II | Chemotherapy | doxorubicine+cyclophosphamide | SD |
| PIK3R1 | SNV | Missense_Mutation | | c.1930N>A | p.Gly644Ser | p.G644S | P27986 | protein_coding | deleterious(0) | probably_damaging(1) | TCGA-D8-A1XQ-01 | Breast | breast invasive carcinoma | Female | >=65 | I/II | Unknown | Unknown | SD |
| Entrez ID | Symbol | Category | Interaction Types | Drug Claim Name | Drug Name | PMIDs |
| 5295 | PIK3R1 | CLINICALLY ACTIONABLE, ENZYME, KINASE, DRUGGABLE GENOME, PHOSPHATIDYLINOSITOL 3 KINASE | | ZSTK474 | | |
| 5295 | PIK3R1 | CLINICALLY ACTIONABLE, ENZYME, KINASE, DRUGGABLE GENOME, PHOSPHATIDYLINOSITOL 3 KINASE | inhibitor | CHEMBL3545324 | RG-7666 | |
| 5295 | PIK3R1 | CLINICALLY ACTIONABLE, ENZYME, KINASE, DRUGGABLE GENOME, PHOSPHATIDYLINOSITOL 3 KINASE | inhibitor | CHEMBL1079593 | VS-5584 | |
| 5295 | PIK3R1 | CLINICALLY ACTIONABLE, ENZYME, KINASE, DRUGGABLE GENOME, PHOSPHATIDYLINOSITOL 3 KINASE | inhibitor | CHEMBL592445 | GEDATOLISIB | |
| 5295 | PIK3R1 | CLINICALLY ACTIONABLE, ENZYME, KINASE, DRUGGABLE GENOME, PHOSPHATIDYLINOSITOL 3 KINASE | inhibitor | CHEMBL2326966 | SF-1126 | |
| 5295 | PIK3R1 | CLINICALLY ACTIONABLE, ENZYME, KINASE, DRUGGABLE GENOME, PHOSPHATIDYLINOSITOL 3 KINASE | inhibitor | DACTOLISIB | DACTOLISIB | |
| 5295 | PIK3R1 | CLINICALLY ACTIONABLE, ENZYME, KINASE, DRUGGABLE GENOME, PHOSPHATIDYLINOSITOL 3 KINASE | inhibitor | CHEMBL3545088 | PUQUITINIB | |
| 5295 | PIK3R1 | CLINICALLY ACTIONABLE, ENZYME, KINASE, DRUGGABLE GENOME, PHOSPHATIDYLINOSITOL 3 KINASE | inhibitor | BUPARLISIB HYDROCHLORIDE | | |
| 5295 | PIK3R1 | CLINICALLY ACTIONABLE, ENZYME, KINASE, DRUGGABLE GENOME, PHOSPHATIDYLINOSITOL 3 KINASE | inhibitor | CHEMBL521851 | PICTILISIB | |
| 5295 | PIK3R1 | CLINICALLY ACTIONABLE, ENZYME, KINASE, DRUGGABLE GENOME, PHOSPHATIDYLINOSITOL 3 KINASE | inhibitor | PWT33597 | | |


