| Tissue | Expression Dynamics | Abbreviation |
| Cervix |  | CC: Cervix cancer |
| HSIL_HPV: HPV-infected high-grade squamous intraepithelial lesions |
| N_HPV: HPV-infected normal cervix |
| Colorectum (GSE201348) |  | FAP: Familial adenomatous polyposis |
| CRC: Colorectal cancer |
| Colorectum (HTA11) |  | AD: Adenomas |
| SER: Sessile serrated lesions |
| MSI-H: Microsatellite-high colorectal cancer |
| MSS: Microsatellite stable colorectal cancer |
| Endometrium | 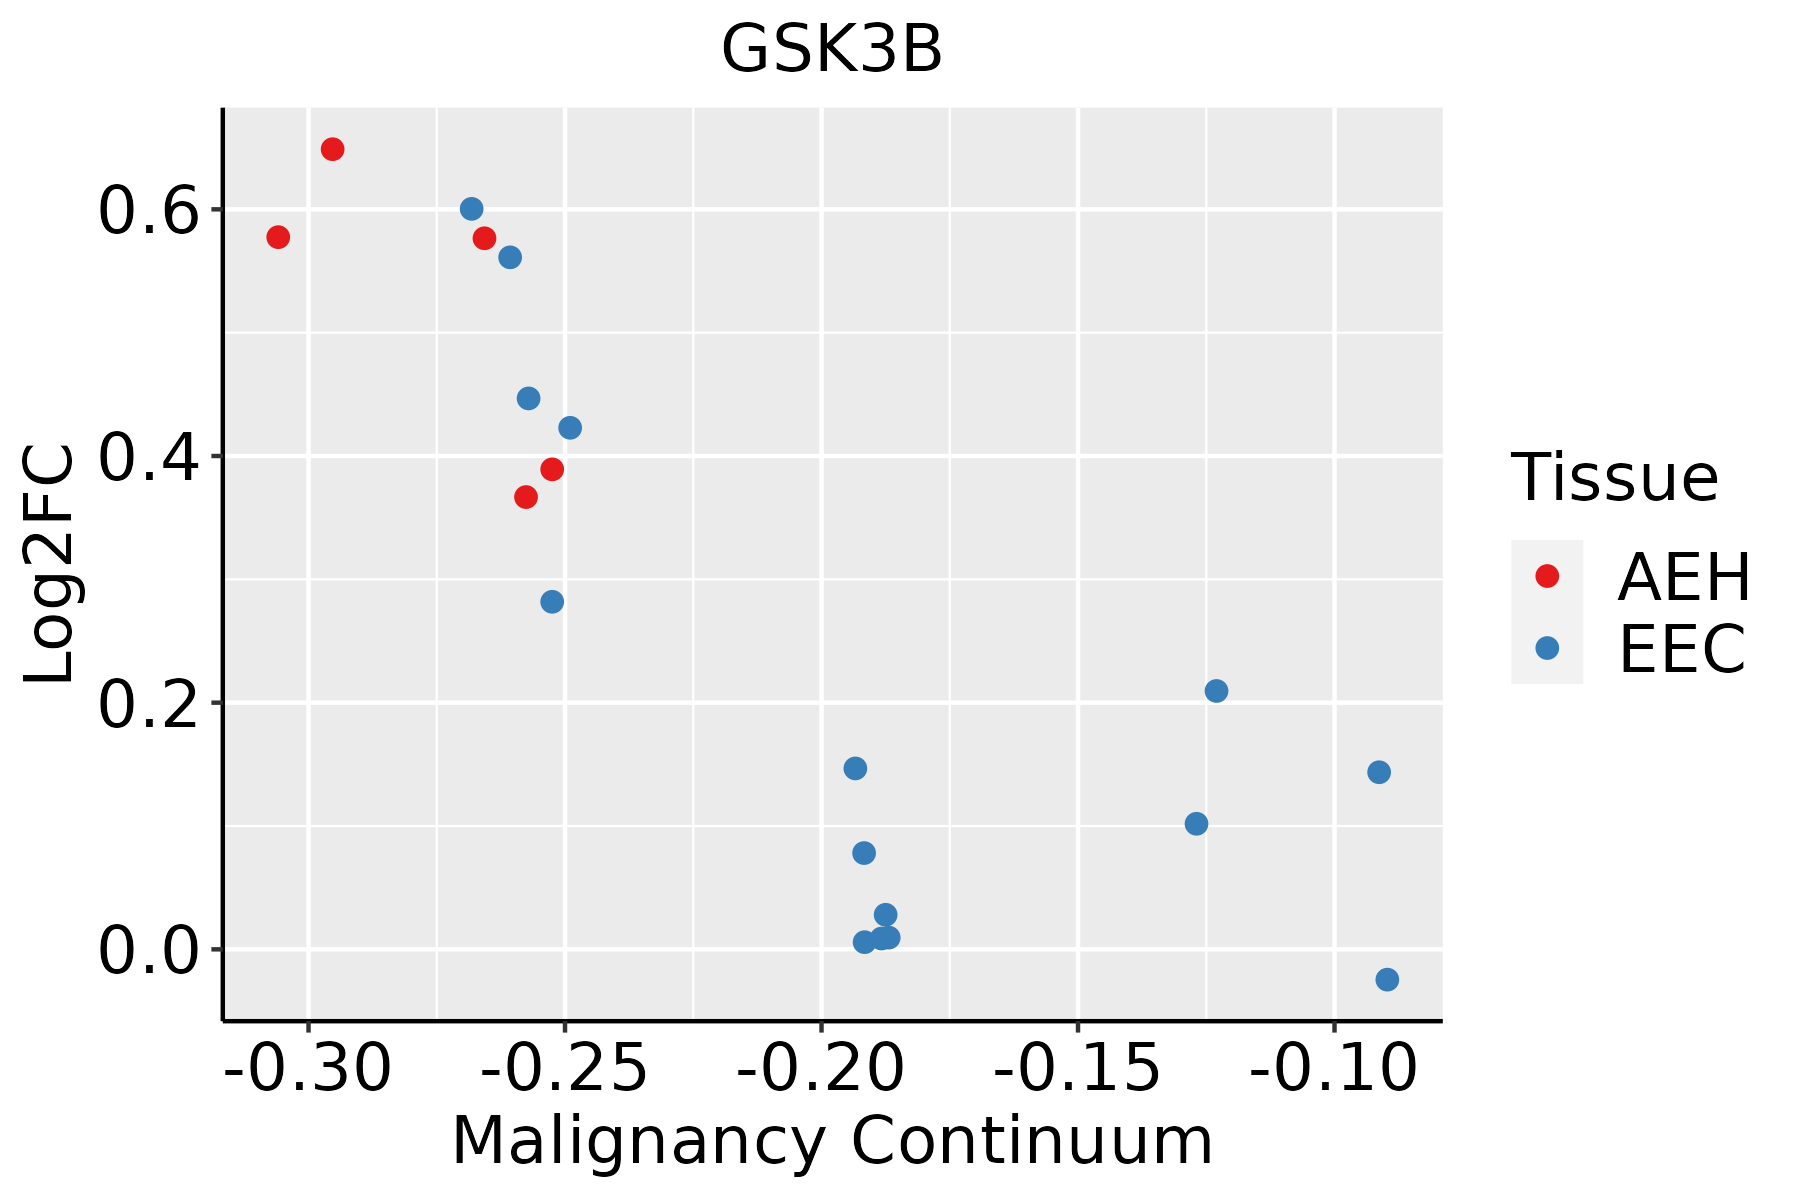 | AEH: Atypical endometrial hyperplasia |
| EEC: Endometrioid Cancer |
| Esophagus | 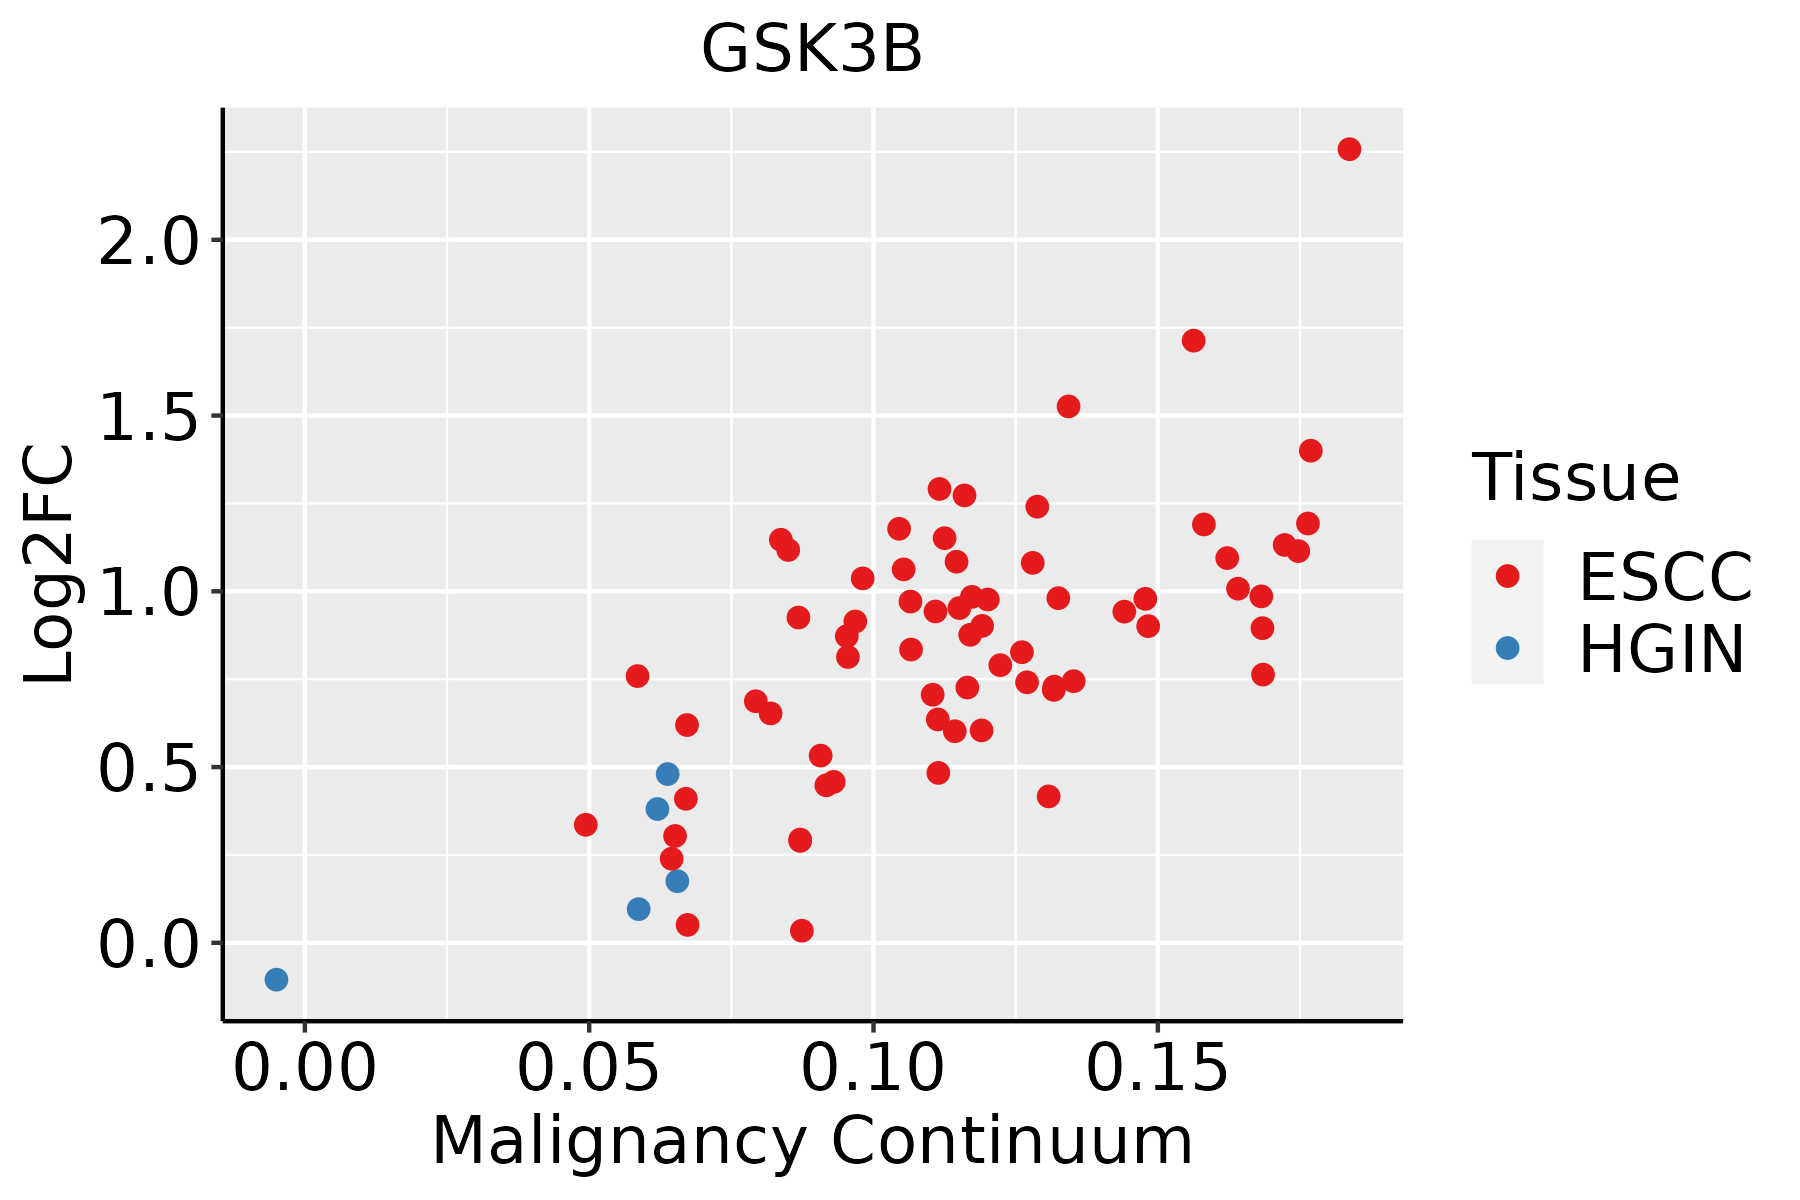 | ESCC: Esophageal squamous cell carcinoma |
| HGIN: High-grade intraepithelial neoplasias |
| LGIN: Low-grade intraepithelial neoplasias |
| Liver | 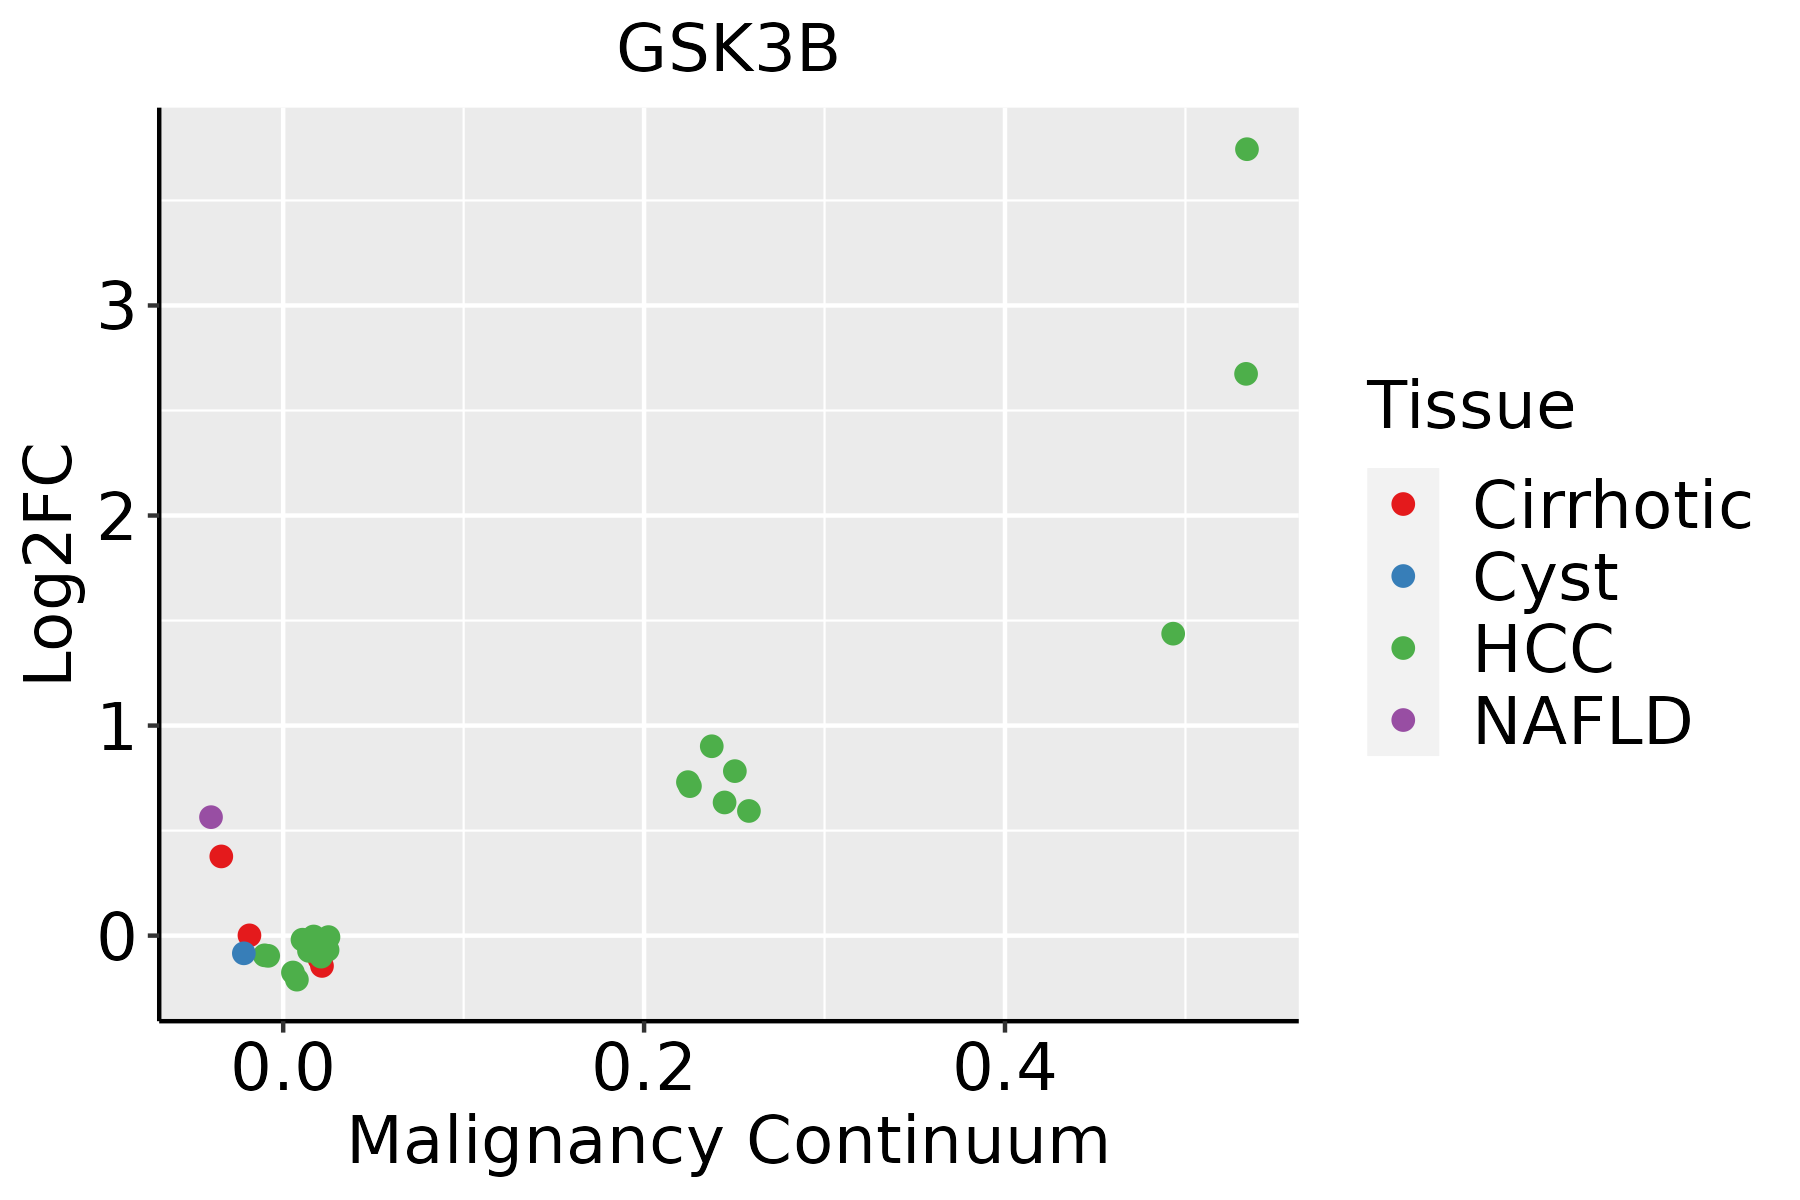 | HCC: Hepatocellular carcinoma |
| NAFLD: Non-alcoholic fatty liver disease |
| Lung |  | AAH: Atypical adenomatous hyperplasia |
| AIS: Adenocarcinoma in situ |
| IAC: Invasive lung adenocarcinoma |
| MIA: Minimally invasive adenocarcinoma |
| Oral Cavity |  | EOLP: Erosive Oral lichen planus |
| LP: leukoplakia |
| NEOLP: Non-erosive oral lichen planus |
| OSCC: Oral squamous cell carcinoma |
| Prostate |  | BPH: Benign Prostatic Hyperplasia |
| Skin |  | AK: Actinic keratosis |
| cSCC: Cutaneous squamous cell carcinoma |
| SCCIS:squamous cell carcinoma in situ |
| Thyroid | 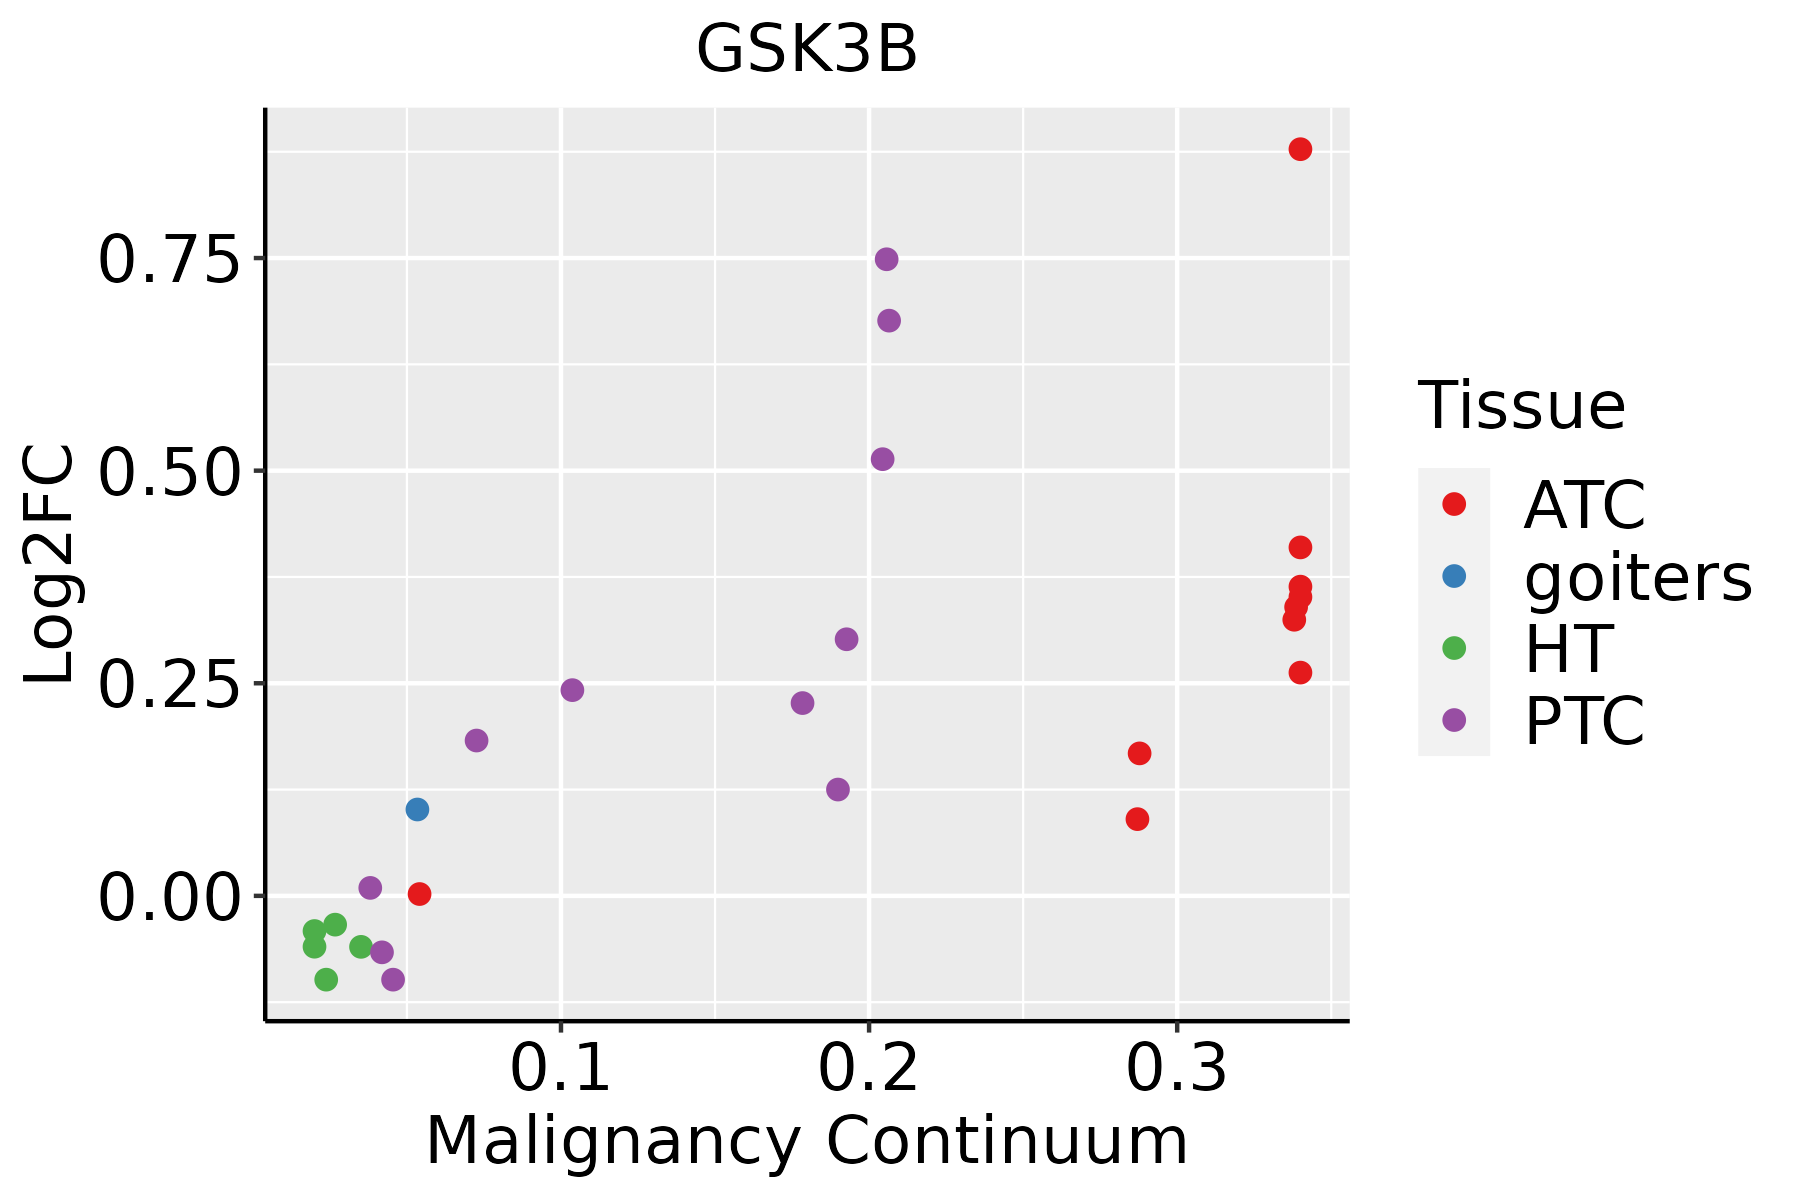 | ATC: Anaplastic thyroid cancer |
| HT: Hashimoto's thyroiditis |
| PTC: Papillary thyroid cancer |
| GO ID | Tissue | Disease Stage | Description | Gene Ratio | Bg Ratio | pvalue | p.adjust | Count |
| GO:001603210 | Cervix | CC | viral process | 109/2311 | 415/18723 | 5.40e-15 | 6.46e-12 | 109 |
| GO:004217610 | Cervix | CC | regulation of protein catabolic process | 104/2311 | 391/18723 | 9.39e-15 | 9.36e-12 | 104 |
| GO:200123310 | Cervix | CC | regulation of apoptotic signaling pathway | 96/2311 | 356/18723 | 4.08e-14 | 3.05e-11 | 96 |
| GO:001081010 | Cervix | CC | regulation of cell-substrate adhesion | 69/2311 | 221/18723 | 8.57e-14 | 5.69e-11 | 69 |
| GO:00315898 | Cervix | CC | cell-substrate adhesion | 96/2311 | 363/18723 | 1.48e-13 | 8.85e-11 | 96 |
| GO:004586210 | Cervix | CC | positive regulation of proteolysis | 95/2311 | 372/18723 | 1.84e-12 | 6.86e-10 | 95 |
| GO:190336210 | Cervix | CC | regulation of cellular protein catabolic process | 72/2311 | 255/18723 | 5.98e-12 | 2.10e-09 | 72 |
| GO:00071639 | Cervix | CC | establishment or maintenance of cell polarity | 63/2311 | 218/18723 | 4.25e-11 | 8.76e-09 | 63 |
| GO:004573210 | Cervix | CC | positive regulation of protein catabolic process | 65/2311 | 231/18723 | 7.44e-11 | 1.39e-08 | 65 |
| GO:001049810 | Cervix | CC | proteasomal protein catabolic process | 111/2311 | 490/18723 | 8.98e-11 | 1.58e-08 | 111 |
| GO:004578510 | Cervix | CC | positive regulation of cell adhesion | 101/2311 | 437/18723 | 1.96e-10 | 3.08e-08 | 101 |
| GO:190382910 | Cervix | CC | positive regulation of cellular protein localization | 72/2311 | 276/18723 | 3.20e-10 | 4.46e-08 | 72 |
| GO:000989610 | Cervix | CC | positive regulation of catabolic process | 109/2311 | 492/18723 | 5.26e-10 | 6.99e-08 | 109 |
| GO:190305010 | Cervix | CC | regulation of proteolysis involved in cellular protein catabolic process | 60/2311 | 221/18723 | 1.82e-09 | 1.98e-07 | 60 |
| GO:004325410 | Cervix | CC | regulation of protein-containing complex assembly | 96/2311 | 428/18723 | 2.91e-09 | 3.05e-07 | 96 |
| GO:00160557 | Cervix | CC | Wnt signaling pathway | 98/2311 | 444/18723 | 4.82e-09 | 4.65e-07 | 98 |
| GO:01987387 | Cervix | CC | cell-cell signaling by wnt | 98/2311 | 446/18723 | 6.16e-09 | 5.58e-07 | 98 |
| GO:00060919 | Cervix | CC | generation of precursor metabolites and energy | 105/2311 | 490/18723 | 7.40e-09 | 6.61e-07 | 105 |
| GO:00019528 | Cervix | CC | regulation of cell-matrix adhesion | 40/2311 | 128/18723 | 1.32e-08 | 1.04e-06 | 40 |
| GO:00071608 | Cervix | CC | cell-matrix adhesion | 60/2311 | 233/18723 | 1.58e-08 | 1.23e-06 | 60 |
| Pathway ID | Tissue | Disease Stage | Description | Gene Ratio | Bg Ratio | pvalue | p.adjust | qvalue | Count |
| hsa0493263 | Oral cavity | NEOLP | Non-alcoholic fatty liver disease | 51/1112 | 155/8465 | 1.26e-10 | 3.84e-09 | 2.41e-09 | 51 |
| hsa0502262 | Oral cavity | NEOLP | Pathways of neurodegeneration - multiple diseases | 112/1112 | 476/8465 | 1.33e-10 | 3.84e-09 | 2.41e-09 | 112 |
| hsa0502062 | Oral cavity | NEOLP | Prion disease | 73/1112 | 273/8465 | 7.94e-10 | 2.10e-08 | 1.32e-08 | 73 |
| hsa0516762 | Oral cavity | NEOLP | Kaposi sarcoma-associated herpesvirus infection | 56/1112 | 194/8465 | 4.05e-09 | 9.20e-08 | 5.78e-08 | 56 |
| hsa0513163 | Oral cavity | NEOLP | Shigellosis | 62/1112 | 247/8465 | 1.93e-07 | 2.79e-06 | 1.75e-06 | 62 |
| hsa0415141 | Oral cavity | NEOLP | PI3K-Akt signaling pathway | 79/1112 | 354/8465 | 8.42e-07 | 9.92e-06 | 6.24e-06 | 79 |
| hsa0516061 | Oral cavity | NEOLP | Hepatitis C | 43/1112 | 157/8465 | 1.26e-06 | 1.34e-05 | 8.43e-06 | 43 |
| hsa0516361 | Oral cavity | NEOLP | Human cytomegalovirus infection | 55/1112 | 225/8465 | 2.32e-06 | 2.30e-05 | 1.45e-05 | 55 |
| hsa0521542 | Oral cavity | NEOLP | Prostate cancer | 28/1112 | 97/8465 | 3.15e-05 | 2.57e-04 | 1.62e-04 | 28 |
| hsa051626 | Oral cavity | NEOLP | Measles | 35/1112 | 139/8465 | 8.30e-05 | 6.14e-04 | 3.86e-04 | 35 |
| hsa0472261 | Oral cavity | NEOLP | Neurotrophin signaling pathway | 31/1112 | 119/8465 | 1.06e-04 | 7.67e-04 | 4.82e-04 | 31 |
| hsa0411061 | Oral cavity | NEOLP | Cell cycle | 37/1112 | 157/8465 | 2.29e-04 | 1.58e-03 | 9.95e-04 | 37 |
| hsa0541763 | Oral cavity | NEOLP | Lipid and atherosclerosis | 47/1112 | 215/8465 | 2.39e-04 | 1.61e-03 | 1.01e-03 | 47 |
| hsa0513561 | Oral cavity | NEOLP | Yersinia infection | 33/1112 | 137/8465 | 3.20e-04 | 2.00e-03 | 1.26e-03 | 33 |
| hsa0466041 | Oral cavity | NEOLP | T cell receptor signaling pathway | 26/1112 | 104/8465 | 7.37e-04 | 3.72e-03 | 2.34e-03 | 26 |
| hsa0439025 | Oral cavity | NEOLP | Hippo signaling pathway | 35/1112 | 157/8465 | 9.91e-04 | 4.85e-03 | 3.05e-03 | 35 |
| hsa0472821 | Oral cavity | NEOLP | Dopaminergic synapse | 30/1112 | 132/8465 | 1.61e-03 | 7.30e-03 | 4.59e-03 | 30 |
| hsa0491942 | Oral cavity | NEOLP | Thyroid hormone signaling pathway | 28/1112 | 121/8465 | 1.70e-03 | 7.62e-03 | 4.80e-03 | 28 |
| hsa0152142 | Oral cavity | NEOLP | EGFR tyrosine kinase inhibitor resistance | 20/1112 | 79/8465 | 2.47e-03 | 1.03e-02 | 6.49e-03 | 20 |
| hsa0436041 | Oral cavity | NEOLP | Axon guidance | 37/1112 | 182/8465 | 4.02e-03 | 1.64e-02 | 1.03e-02 | 37 |
| Hugo Symbol | Variant Class | Variant Classification | dbSNP RS | HGVSc | HGVSp | HGVSp Short | SWISSPROT | BIOTYPE | SIFT | PolyPhen | Tumor Sample Barcode | Tissue | Histology | Sex | Age | Stage | Therapy Types | Drugs | Outcome |
| GSK3B | SNV | Missense_Mutation | | c.46N>T | p.Pro16Ser | p.P16S | P49841 | protein_coding | tolerated_low_confidence(0.36) | benign(0.003) | TCGA-AN-A0FX-01 | Breast | breast invasive carcinoma | Female | <65 | I/II | Unknown | Unknown | SD |
| GSK3B | SNV | Missense_Mutation | novel | c.857C>G | p.Pro286Arg | p.P286R | P49841 | protein_coding | deleterious(0.03) | benign(0.162) | TCGA-C8-A8HR-01 | Breast | breast invasive carcinoma | Female | <65 | III/IV | Chemotherapy | 5-fluorouracil | CR |
| GSK3B | insertion | Nonsense_Mutation | novel | c.1146_1147insGAAACCGGGAGGCGGAGGTTGCATTGAGCCGAGATTGCGCC | p.Asn383GlufsTer9 | p.N383Efs*9 | P49841 | protein_coding | | | TCGA-A8-A07R-01 | Breast | breast invasive carcinoma | Female | >=65 | III/IV | Ancillary | zoledronic | SD |
| GSK3B | insertion | In_Frame_Ins | novel | c.44_45insATCACAAGGAGAACTCTGTTTTGA | p.Lys15_Pro16insSerGlnGlyGluLeuCysPheGlu | p.K15_P16insSQGELCFE | P49841 | protein_coding | | | TCGA-AN-A0FX-01 | Breast | breast invasive carcinoma | Female | <65 | I/II | Unknown | Unknown | SD |
| GSK3B | deletion | Frame_Shift_Del | novel | c.850delN | p.Met284Ter | p.M284* | P49841 | protein_coding | | | TCGA-EW-A2FV-01 | Breast | breast invasive carcinoma | Female | <65 | III/IV | Chemotherapy | docetaxel | SD |
| GSK3B | SNV | Missense_Mutation | novel | c.259G>A | p.Val87Ile | p.V87I | P49841 | protein_coding | deleterious(0) | probably_damaging(0.927) | TCGA-2W-A8YY-01 | Cervix | cervical & endocervical cancer | Female | <65 | I/II | Chemotherapy | cisplatin | CR |
| GSK3B | SNV | Missense_Mutation | novel | c.683N>A | p.Ile228Asn | p.I228N | P49841 | protein_coding | deleterious(0) | probably_damaging(0.999) | TCGA-VS-A8EL-01 | Cervix | cervical & endocervical cancer | Female | <65 | I/II | Chemotherapy | cisplatin | CR |
| GSK3B | SNV | Missense_Mutation | rs72548709 | c.995N>A | p.Arg332His | p.R332H | P49841 | protein_coding | tolerated(0.07) | benign(0.003) | TCGA-AA-3663-01 | Colorectum | colon adenocarcinoma | Male | <65 | I/II | Unknown | Unknown | SD |
| GSK3B | SNV | Missense_Mutation | | c.713N>C | p.Ile238Thr | p.I238T | P49841 | protein_coding | deleterious(0) | probably_damaging(0.986) | TCGA-AA-3715-01 | Colorectum | colon adenocarcinoma | Male | >=65 | I/II | Unknown | Unknown | PD |
| GSK3B | SNV | Missense_Mutation | | c.901T>C | p.Trp301Arg | p.W301R | P49841 | protein_coding | deleterious(0) | probably_damaging(0.996) | TCGA-AA-A010-01 | Colorectum | colon adenocarcinoma | Female | <65 | I/II | Chemotherapy | folinic | CR |
| Entrez ID | Symbol | Category | Interaction Types | Drug Claim Name | Drug Name | PMIDs |
| 2932 | GSK3B | DRUGGABLE GENOME, KINASE, SERINE THREONINE KINASE, ENZYME, CLINICALLY ACTIONABLE, TRANSCRIPTION FACTOR | | PMID26161698-Compound-18 | | |
| 2932 | GSK3B | DRUGGABLE GENOME, KINASE, SERINE THREONINE KINASE, ENZYME, CLINICALLY ACTIONABLE, TRANSCRIPTION FACTOR | | Neu-120 | | |
| 2932 | GSK3B | DRUGGABLE GENOME, KINASE, SERINE THREONINE KINASE, ENZYME, CLINICALLY ACTIONABLE, TRANSCRIPTION FACTOR | | SOTRASTAURIN | SOTRASTAURIN | |
| 2932 | GSK3B | DRUGGABLE GENOME, KINASE, SERINE THREONINE KINASE, ENZYME, CLINICALLY ACTIONABLE, TRANSCRIPTION FACTOR | | CYC-116 | CYC-116 | |
| 2932 | GSK3B | DRUGGABLE GENOME, KINASE, SERINE THREONINE KINASE, ENZYME, CLINICALLY ACTIONABLE, TRANSCRIPTION FACTOR | | tideglusib | TIDEGLUSIB | |
| 2932 | GSK3B | DRUGGABLE GENOME, KINASE, SERINE THREONINE KINASE, ENZYME, CLINICALLY ACTIONABLE, TRANSCRIPTION FACTOR | inhibitor | 404859135 | | |
| 2932 | GSK3B | DRUGGABLE GENOME, KINASE, SERINE THREONINE KINASE, ENZYME, CLINICALLY ACTIONABLE, TRANSCRIPTION FACTOR | | ALSTERPAULLONE | ALSTERPAULLONE | |
| 2932 | GSK3B | DRUGGABLE GENOME, KINASE, SERINE THREONINE KINASE, ENZYME, CLINICALLY ACTIONABLE, TRANSCRIPTION FACTOR | inhibitor | CHEMBL1200826 | LITHIUM CARBONATE | |
| 2932 | GSK3B | DRUGGABLE GENOME, KINASE, SERINE THREONINE KINASE, ENZYME, CLINICALLY ACTIONABLE, TRANSCRIPTION FACTOR | | AMO-02 | | |
| 2932 | GSK3B | DRUGGABLE GENOME, KINASE, SERINE THREONINE KINASE, ENZYME, CLINICALLY ACTIONABLE, TRANSCRIPTION FACTOR | | BETULINIC ACID | BETULINIC ACID | 19716700 |


