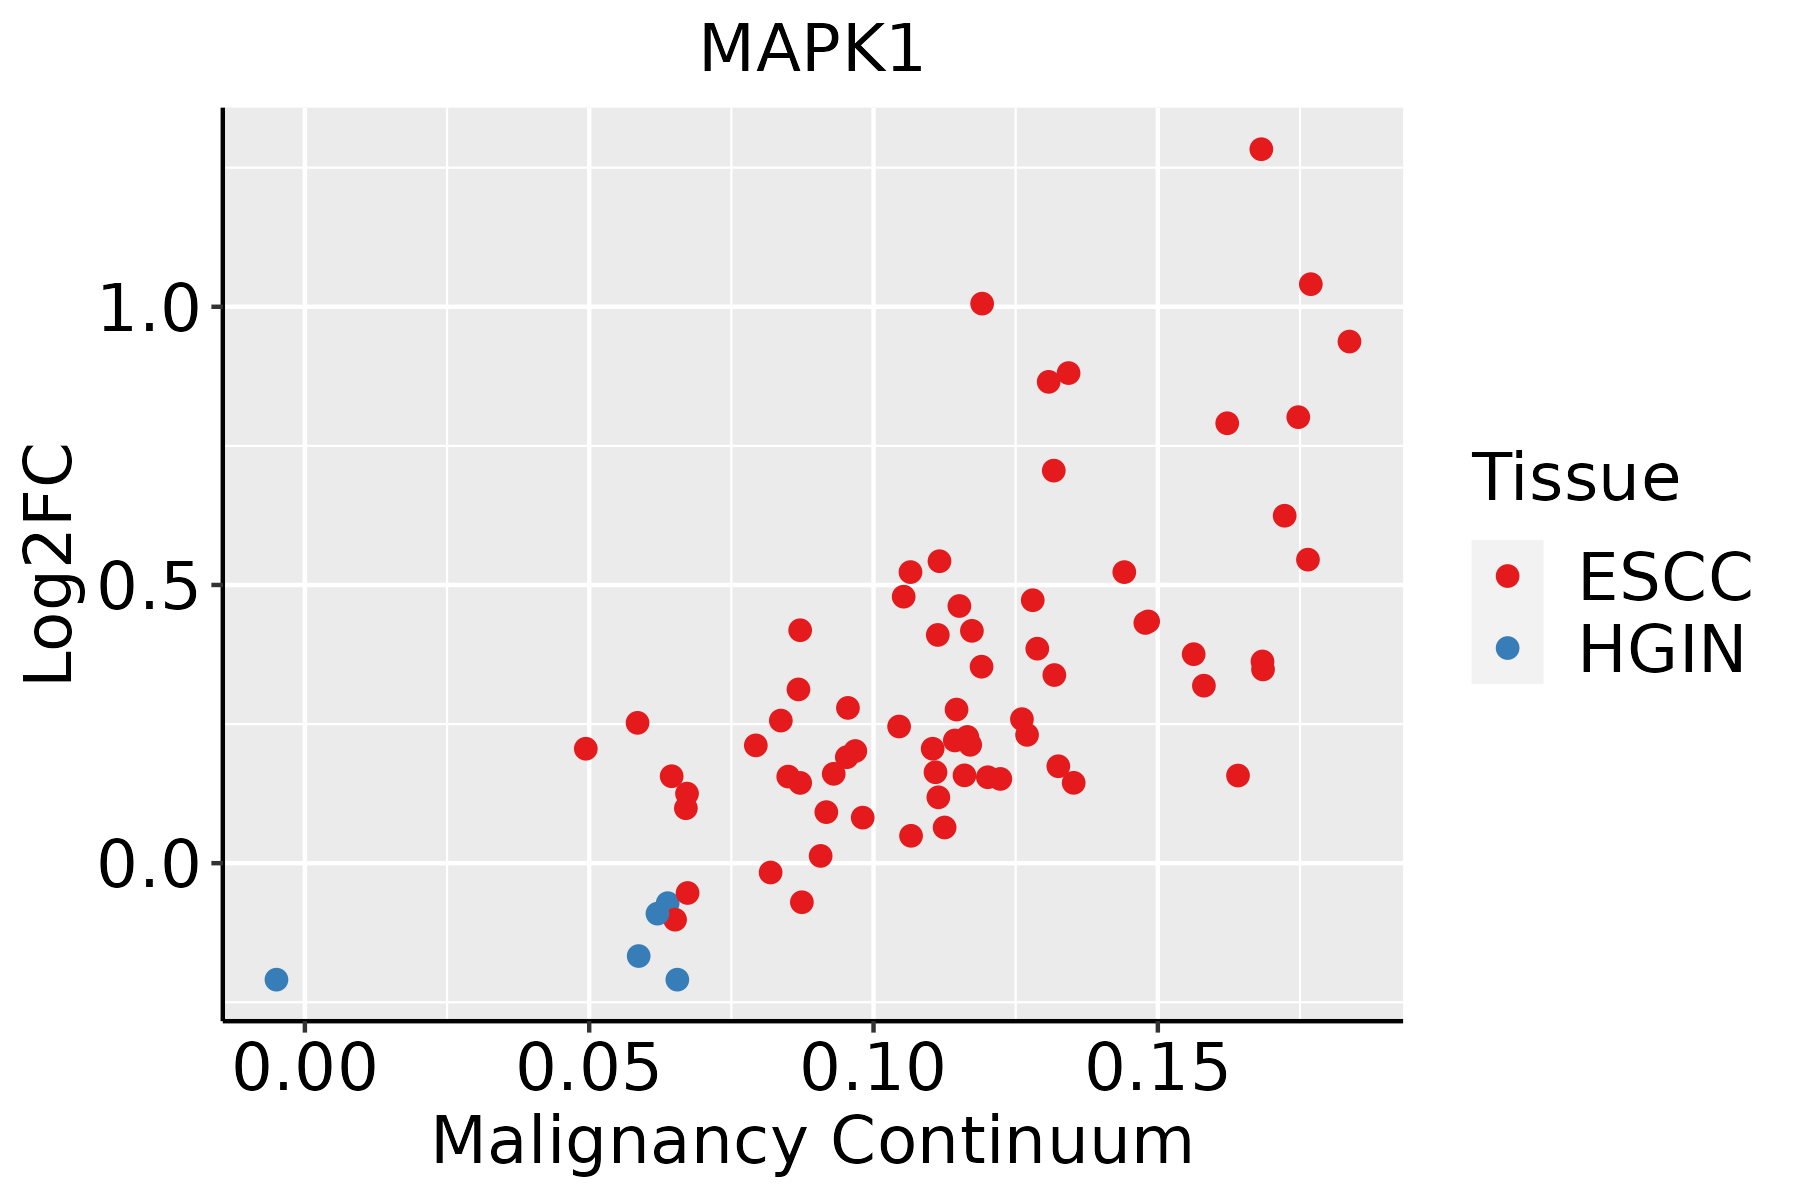
| Tissue | Expression Dynamics | Abbreviation |
| Esophagus |  | ESCC: Esophageal squamous cell carcinoma |
| HGIN: High-grade intraepithelial neoplasias |
| LGIN: Low-grade intraepithelial neoplasias |
| Liver |  | HCC: Hepatocellular carcinoma |
| NAFLD: Non-alcoholic fatty liver disease |
| Oral Cavity |  | EOLP: Erosive Oral lichen planus |
| LP: leukoplakia |
| NEOLP: Non-erosive oral lichen planus |
| OSCC: Oral squamous cell carcinoma |
| Prostate |  | BPH: Benign Prostatic Hyperplasia |
| Skin |  | AK: Actinic keratosis |
| cSCC: Cutaneous squamous cell carcinoma |
| SCCIS:squamous cell carcinoma in situ |
| Thyroid |  | ATC: Anaplastic thyroid cancer |
| HT: Hashimoto's thyroiditis |
| PTC: Papillary thyroid cancer |
| GO ID | Tissue | Disease Stage | Description | Gene Ratio | Bg Ratio | pvalue | p.adjust | Count |
| GO:004206010 | Cervix | CC | wound healing | 109/2311 | 422/18723 | 1.84e-14 | 1.57e-11 | 109 |
| GO:00725949 | Cervix | CC | establishment of protein localization to organelle | 99/2311 | 422/18723 | 1.23e-10 | 2.11e-08 | 99 |
| GO:002240710 | Cervix | CC | regulation of cell-cell adhesion | 103/2311 | 448/18723 | 1.78e-10 | 2.87e-08 | 103 |
| GO:190382910 | Cervix | CC | positive regulation of cellular protein localization | 72/2311 | 276/18723 | 3.20e-10 | 4.46e-08 | 72 |
| GO:00160557 | Cervix | CC | Wnt signaling pathway | 98/2311 | 444/18723 | 4.82e-09 | 4.65e-07 | 98 |
| GO:01987387 | Cervix | CC | cell-cell signaling by wnt | 98/2311 | 446/18723 | 6.16e-09 | 5.58e-07 | 98 |
| GO:19907788 | Cervix | CC | protein localization to cell periphery | 78/2311 | 333/18723 | 1.22e-08 | 9.73e-07 | 78 |
| GO:005122210 | Cervix | CC | positive regulation of protein transport | 72/2311 | 303/18723 | 2.36e-08 | 1.70e-06 | 72 |
| GO:00026837 | Cervix | CC | negative regulation of immune system process | 94/2311 | 434/18723 | 2.63e-08 | 1.87e-06 | 94 |
| GO:00301117 | Cervix | CC | regulation of Wnt signaling pathway | 76/2311 | 328/18723 | 3.05e-08 | 2.08e-06 | 76 |
| GO:00069139 | Cervix | CC | nucleocytoplasmic transport | 71/2311 | 301/18723 | 4.04e-08 | 2.54e-06 | 71 |
| GO:00511699 | Cervix | CC | nuclear transport | 71/2311 | 301/18723 | 4.04e-08 | 2.54e-06 | 71 |
| GO:190495110 | Cervix | CC | positive regulation of establishment of protein localization | 73/2311 | 319/18723 | 9.69e-08 | 5.25e-06 | 73 |
| GO:00345048 | Cervix | CC | protein localization to nucleus | 68/2311 | 290/18723 | 9.91e-08 | 5.25e-06 | 68 |
| GO:006219710 | Cervix | CC | cellular response to chemical stress | 76/2311 | 337/18723 | 1.01e-07 | 5.25e-06 | 76 |
| GO:003133010 | Cervix | CC | negative regulation of cellular catabolic process | 63/2311 | 262/18723 | 1.10e-07 | 5.68e-06 | 63 |
| GO:003009910 | Cervix | CC | myeloid cell differentiation | 83/2311 | 381/18723 | 1.31e-07 | 6.42e-06 | 83 |
| GO:00027644 | Cervix | CC | immune response-regulating signaling pathway | 97/2311 | 468/18723 | 1.49e-07 | 7.07e-06 | 97 |
| GO:190370610 | Cervix | CC | regulation of hemopoiesis | 80/2311 | 367/18723 | 2.14e-07 | 9.55e-06 | 80 |
| GO:000226210 | Cervix | CC | myeloid cell homeostasis | 43/2311 | 157/18723 | 2.66e-07 | 1.12e-05 | 43 |
| TF | Cell Type | Tissue | Disease Stage | Target Gene | RSS | Regulon Activity |
| MAPK1 | CD8TEXINT | Colorectum | AD | ITGA1,YPEL1,UBASH3B, etc. | 2.57e-01 |  |
| MAPK1 | CD8TEREX | Colorectum | AD | ITGA1,YPEL1,UBASH3B, etc. | 2.43e-01 |  |
| MAPK1 | MAIT | Colorectum | ADJ | ITGA1,YPEL1,UBASH3B, etc. | 1.38e-01 |  |
| MAPK1 | CD8TEREX | Colorectum | ADJ | ITGA1,YPEL1,UBASH3B, etc. | 1.84e-01 |  |
| MAPK1 | CD8TEXINT | Colorectum | ADJ | ITGA1,YPEL1,UBASH3B, etc. | 1.00e-01 |  |
| MAPK1 | CD8TEREX | Colorectum | CRC | ITGA1,YPEL1,UBASH3B, etc. | 6.38e-02 |  |
| MAPK1 | TREG | Colorectum | CRC | ITGA1,YPEL1,UBASH3B, etc. | 1.20e-01 |  |
| MAPK1 | TH17 | Colorectum | FAP | ITGA1,YPEL1,UBASH3B, etc. | 8.39e-02 |  |
| MAPK1 | CD8TEREX | Colorectum | FAP | ITGA1,YPEL1,UBASH3B, etc. | 2.37e-01 |  |
| MAPK1 | MAIT | Colorectum | FAP | ITGA1,YPEL1,UBASH3B, etc. | 1.13e-01 |  |
| Hugo Symbol | Variant Class | Variant Classification | dbSNP RS | HGVSc | HGVSp | HGVSp Short | SWISSPROT | BIOTYPE | SIFT | PolyPhen | Tumor Sample Barcode | Tissue | Histology | Sex | Age | Stage | Therapy Types | Drugs | Outcome |
| MAPK1 | SNV | Missense_Mutation | | c.241G>A | p.Glu81Lys | p.E81K | P28482 | protein_coding | deleterious(0) | probably_damaging(0.995) | TCGA-BH-A0B5-01 | Breast | breast invasive carcinoma | Female | <65 | III/IV | Chemotherapy | adriamycin | CR |
| MAPK1 | SNV | Missense_Mutation | rs747124623 | c.994G>A | p.Asp332Asn | p.D332N | P28482 | protein_coding | deleterious(0.03) | benign(0.001) | TCGA-E2-A14N-01 | Breast | breast invasive carcinoma | Female | <65 | I/II | Chemotherapy | cyclophosphamide | SD |
| MAPK1 | insertion | Frame_Shift_Ins | novel | c.1024_1025insTTGTGAGCCAAGGTAGAAGCAGTTGCTGGGGAGATGC | p.Lys342IlefsTer20 | p.K342Ifs*20 | P28482 | protein_coding | | | TCGA-AN-A03Y-01 | Breast | breast invasive carcinoma | Female | >=65 | I/II | Unknown | Unknown | SD |
| MAPK1 | SNV | Missense_Mutation | | c.964N>A | p.Glu322Lys | p.E322K | P28482 | protein_coding | deleterious(0) | probably_damaging(0.995) | TCGA-C5-A1BI-01 | Cervix | cervical & endocervical cancer | Female | <65 | III/IV | Chemotherapy | cisplatin | SD |
| MAPK1 | SNV | Missense_Mutation | | c.964G>A | p.Glu322Lys | p.E322K | P28482 | protein_coding | deleterious(0) | probably_damaging(0.995) | TCGA-C5-A1MH-01 | Cervix | cervical & endocervical cancer | Female | >=65 | III/IV | Chemotherapy | cisplatin | PD |
| MAPK1 | SNV | Missense_Mutation | | c.961G>A | p.Asp321Asn | p.D321N | P28482 | protein_coding | deleterious(0) | probably_damaging(0.981) | TCGA-DG-A2KL-01 | Cervix | cervical & endocervical cancer | Female | <65 | I/II | Chemotherapy | cisplatin | SD |
| MAPK1 | SNV | Missense_Mutation | | c.964N>A | p.Glu322Lys | p.E322K | P28482 | protein_coding | deleterious(0) | probably_damaging(0.995) | TCGA-DS-A0VN-01 | Cervix | cervical & endocervical cancer | Female | <65 | I/II | Chemotherapy | cisplatin | SD |
| MAPK1 | SNV | Missense_Mutation | | c.964N>A | p.Glu322Lys | p.E322K | P28482 | protein_coding | deleterious(0) | probably_damaging(0.995) | TCGA-EA-A1QS-01 | Cervix | cervical & endocervical cancer | Female | <65 | I/II | Unknown | Unknown | SD |
| MAPK1 | SNV | Missense_Mutation | | c.404G>A | p.Arg135Lys | p.R135K | P28482 | protein_coding | deleterious(0) | probably_damaging(0.992) | TCGA-EA-A3HT-01 | Cervix | cervical & endocervical cancer | Female | >=65 | I/II | Unknown | Unknown | SD |
| MAPK1 | SNV | Missense_Mutation | | c.964G>A | p.Glu322Lys | p.E322K | P28482 | protein_coding | deleterious(0) | probably_damaging(0.995) | TCGA-EA-A5ZD-01 | Cervix | cervical & endocervical cancer | Female | <65 | I/II | Unknown | Unknown | SD |
| Entrez ID | Symbol | Category | Interaction Types | Drug Claim Name | Drug Name | PMIDs |
| 5594 | MAPK1 | SERINE THREONINE KINASE, ENZYME, CLINICALLY ACTIONABLE, KINASE, DRUGGABLE GENOME, DRUG RESISTANCE, TRANSCRIPTION FACTOR | | PROGESTERONE | PROGESTERONE | |
| 5594 | MAPK1 | SERINE THREONINE KINASE, ENZYME, CLINICALLY ACTIONABLE, KINASE, DRUGGABLE GENOME, DRUG RESISTANCE, TRANSCRIPTION FACTOR | | SPINASAPONIN A METHYL ESTER | SPINASAPONIN A METHYL ESTER | 20951582 |
| 5594 | MAPK1 | SERINE THREONINE KINASE, ENZYME, CLINICALLY ACTIONABLE, KINASE, DRUGGABLE GENOME, DRUG RESISTANCE, TRANSCRIPTION FACTOR | | DIHYDROGAMBOGIC ACID | DIHYDROGAMBOGIC ACID | |
| 5594 | MAPK1 | SERINE THREONINE KINASE, ENZYME, CLINICALLY ACTIONABLE, KINASE, DRUGGABLE GENOME, DRUG RESISTANCE, TRANSCRIPTION FACTOR | | TREQUINSIN HYDROCHLORIDE | TREQUINSIN HYDROCHLORIDE | |
| 5594 | MAPK1 | SERINE THREONINE KINASE, ENZYME, CLINICALLY ACTIONABLE, KINASE, DRUGGABLE GENOME, DRUG RESISTANCE, TRANSCRIPTION FACTOR | | BENZOTHIAZOL-2-YLAMINE | CHEMBL329785 | 22982122 |
| 5594 | MAPK1 | SERINE THREONINE KINASE, ENZYME, CLINICALLY ACTIONABLE, KINASE, DRUGGABLE GENOME, DRUG RESISTANCE, TRANSCRIPTION FACTOR | | PHENETHYLISOTHIOCYANATE | PHENETHYLISOTHIOCYANATE | 22607231 |
| 5594 | MAPK1 | SERINE THREONINE KINASE, ENZYME, CLINICALLY ACTIONABLE, KINASE, DRUGGABLE GENOME, DRUG RESISTANCE, TRANSCRIPTION FACTOR | | GENTIAN VIOLET | GENTIAN VIOLET | |
| 5594 | MAPK1 | SERINE THREONINE KINASE, ENZYME, CLINICALLY ACTIONABLE, KINASE, DRUGGABLE GENOME, DRUG RESISTANCE, TRANSCRIPTION FACTOR | | MITOXANTRONE DIHYDROCHLORIDE | MITOXANTRONE HYDROCHLORIDE | |
| 5594 | MAPK1 | SERINE THREONINE KINASE, ENZYME, CLINICALLY ACTIONABLE, KINASE, DRUGGABLE GENOME, DRUG RESISTANCE, TRANSCRIPTION FACTOR | | DAUNORUBICIN HYDROCHLORIDE | DAUNORUBICIN HYDROCHLORIDE | |
| 5594 | MAPK1 | SERINE THREONINE KINASE, ENZYME, CLINICALLY ACTIONABLE, KINASE, DRUGGABLE GENOME, DRUG RESISTANCE, TRANSCRIPTION FACTOR | | ZM-449829 | CHEMBL154580 | |


 Identification of the aberrant gene expression in precancerous and cancerous lesions by comparing the gene expression of stem-like cells in diseased tissues with normal stem cells
 Find out the enriched GO biological processes and KEGG pathways involved in transition from healthy to precancer to cancer


 Identification of potential cell-cell interactions between two cell types and their ligand-receptor pairs for different disease states
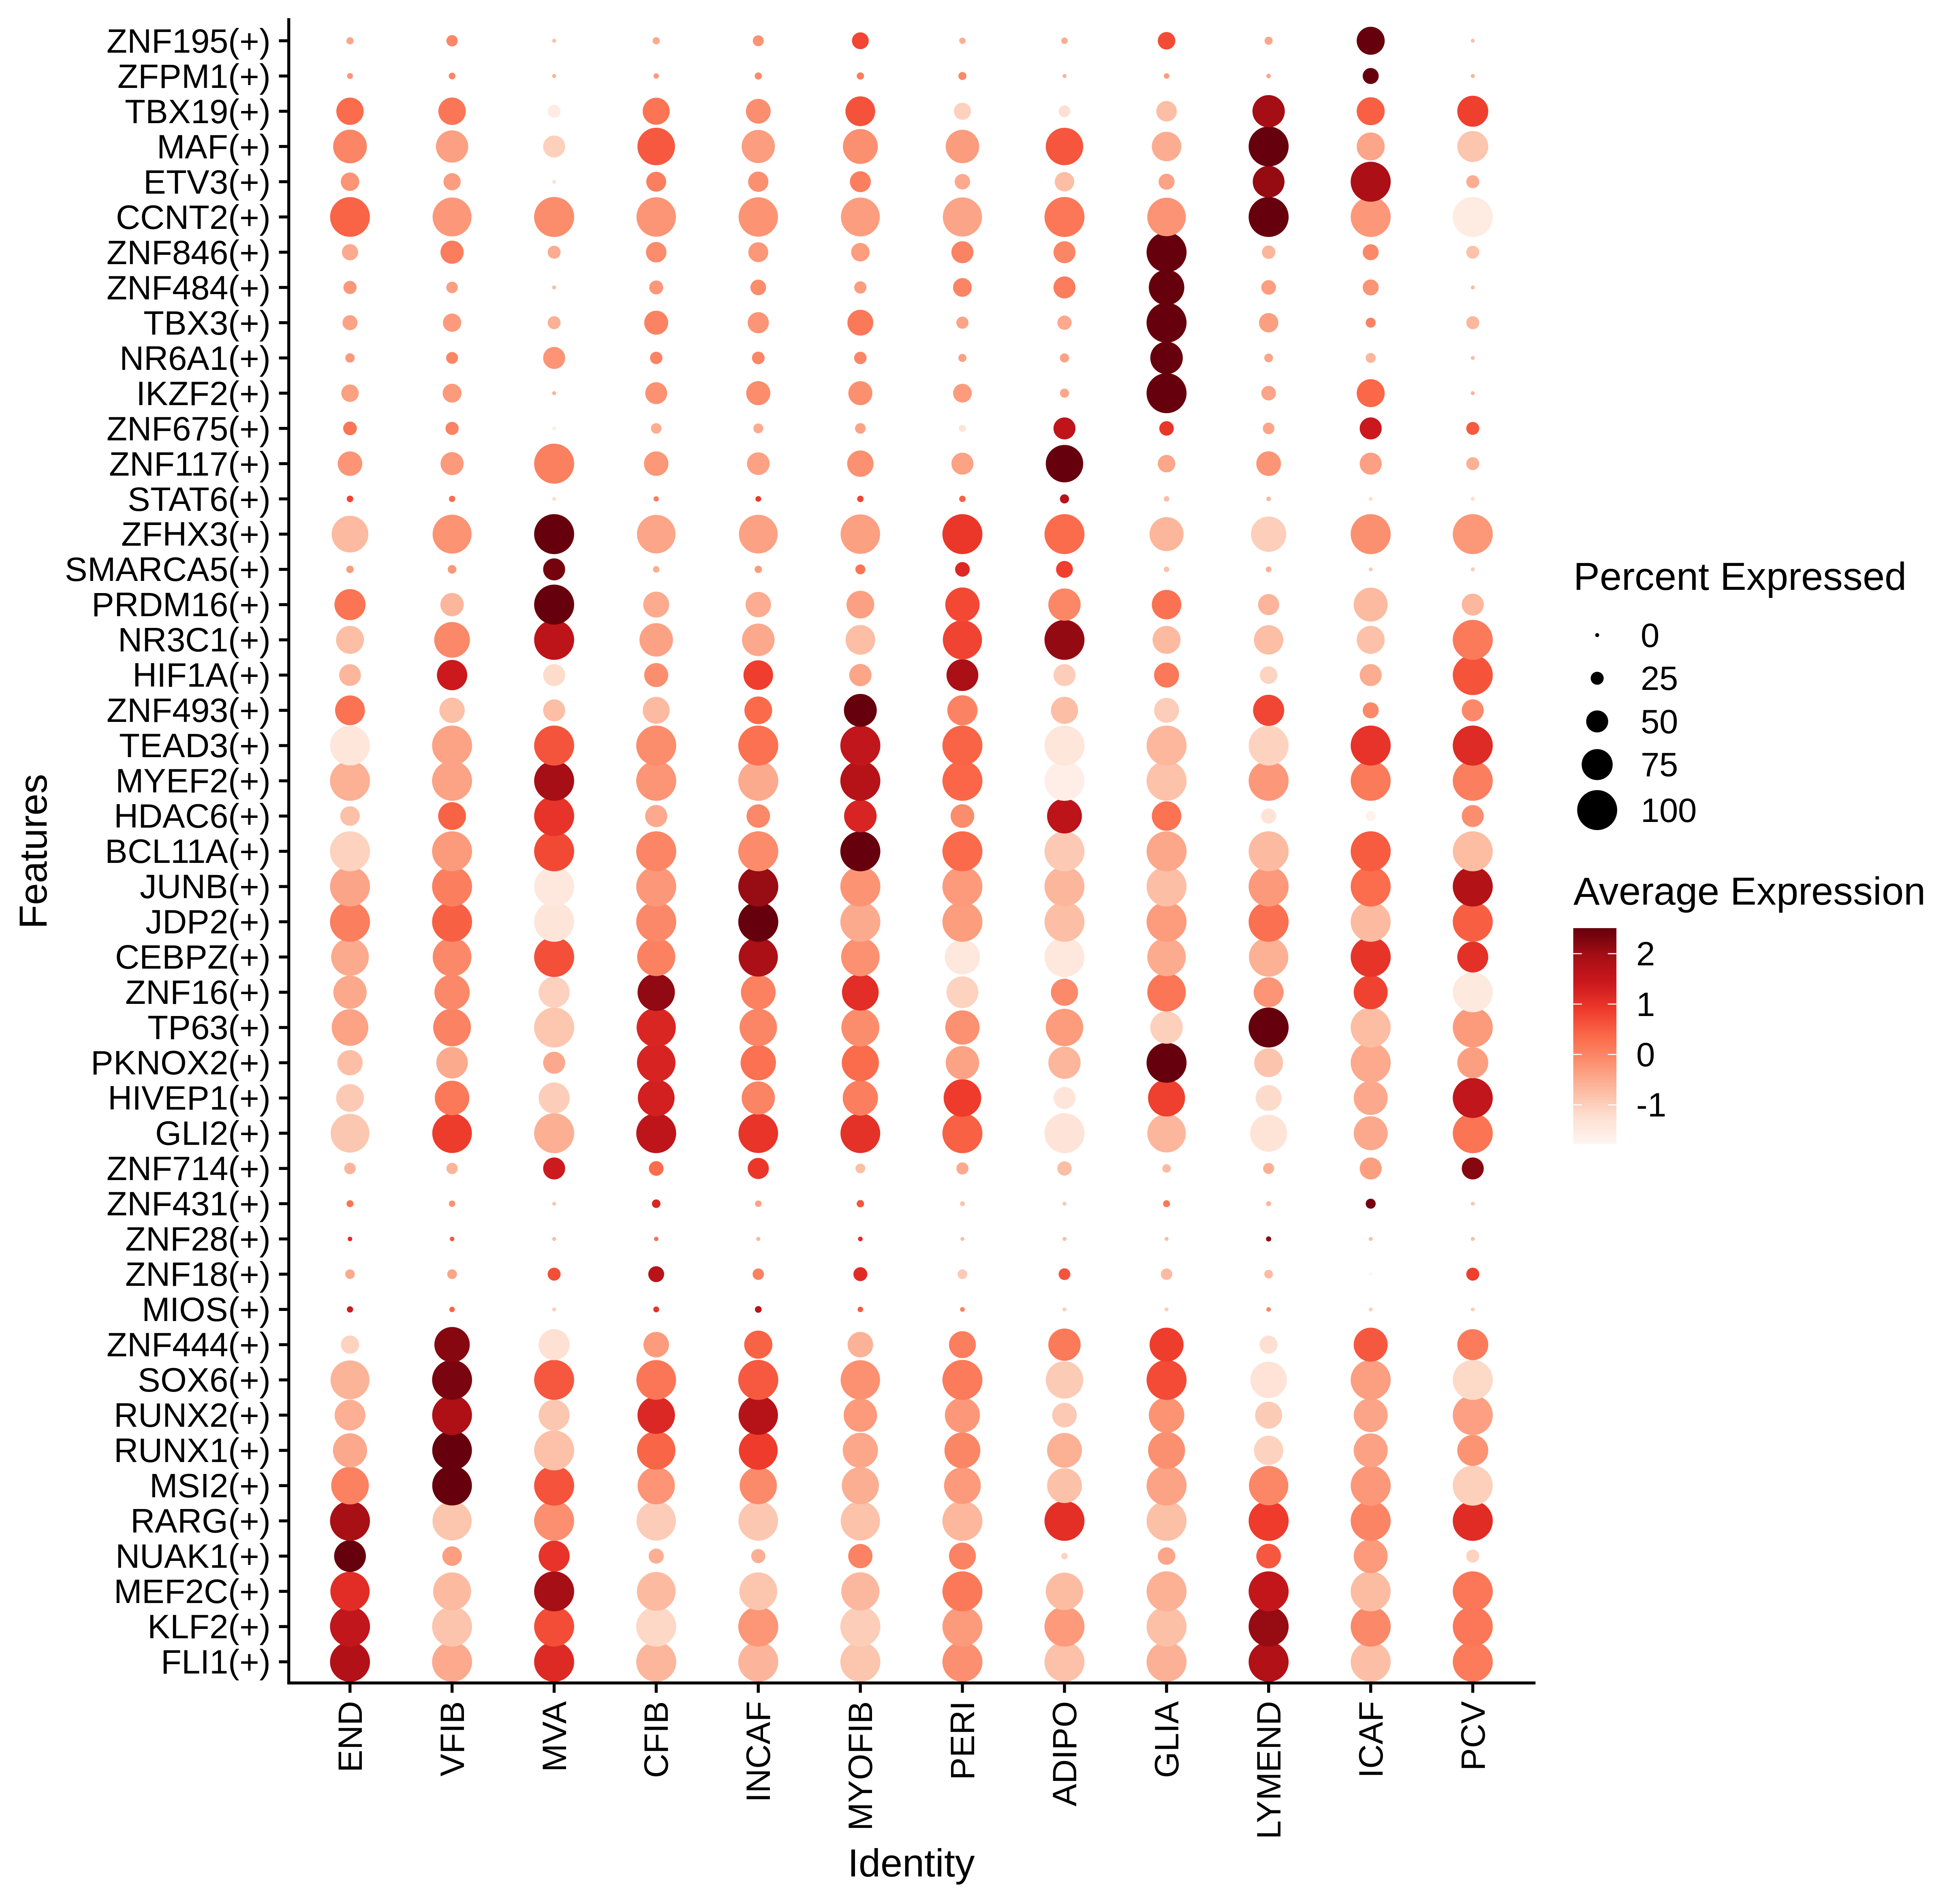
 Find out the significant the regulons (TFs) and the target genes of each regulon across cell types for different disease states
 Annotation of somatic variants for genes involved in malignant transformation
 Identification of chemicals and drugs interact with genes involved in malignant transfromation


