
|
|||||
|
 | |
| |
| |
| |
| |
| |
|
Gene: RPS6KA3 |
Gene summary for RPS6KA3 |
| Gene information | Species | Human | Gene symbol | RPS6KA3 | Gene ID | 6197 |
| Gene name | ribosomal protein S6 kinase A3 | |
| Gene Alias | CLS | |
| Cytomap | Xp22.12 | |
| Gene Type | protein-coding | GO ID | GO:0001501 | UniProtAcc | P51812 |
Top |
Malignant transformation analysis |
| Identification of the aberrant gene expression in precancerous and cancerous lesions by comparing the gene expression of stem-like cells in diseased tissues with normal stem cells |
| Entrez ID | Symbol | Replicates | Species | Organ | Tissue | Adj P-value | Log2FC | Malignancy |
| 6197 | RPS6KA3 | HTA11_3410_2000001011 | Human | Colorectum | AD | 1.18e-25 | -6.88e-01 | 0.0155 |
| 6197 | RPS6KA3 | HTA11_347_2000001011 | Human | Colorectum | AD | 9.77e-06 | 5.19e-01 | -0.1954 |
| 6197 | RPS6KA3 | HTA11_3361_2000001011 | Human | Colorectum | AD | 2.43e-03 | -5.37e-01 | -0.1207 |
| 6197 | RPS6KA3 | HTA11_696_2000001011 | Human | Colorectum | AD | 3.21e-06 | -2.62e-01 | -0.1464 |
| 6197 | RPS6KA3 | HTA11_5212_2000001011 | Human | Colorectum | AD | 1.33e-02 | -5.24e-01 | -0.2061 |
| 6197 | RPS6KA3 | HTA11_866_3004761011 | Human | Colorectum | AD | 5.09e-09 | -5.90e-01 | 0.096 |
| 6197 | RPS6KA3 | HTA11_8622_2000001021 | Human | Colorectum | SER | 4.02e-04 | -6.92e-01 | 0.0528 |
| 6197 | RPS6KA3 | HTA11_10711_2000001011 | Human | Colorectum | AD | 4.73e-02 | -4.79e-01 | 0.0338 |
| 6197 | RPS6KA3 | HTA11_7696_3000711011 | Human | Colorectum | AD | 1.18e-17 | -5.76e-01 | 0.0674 |
| 6197 | RPS6KA3 | HTA11_99999970781_79442 | Human | Colorectum | MSS | 6.79e-12 | -4.94e-01 | 0.294 |
| 6197 | RPS6KA3 | HTA11_99999965104_69814 | Human | Colorectum | MSS | 1.07e-03 | 5.34e-01 | 0.281 |
| 6197 | RPS6KA3 | HTA11_99999971662_82457 | Human | Colorectum | MSS | 9.17e-19 | -5.73e-01 | 0.3859 |
| 6197 | RPS6KA3 | HTA11_99999974143_84620 | Human | Colorectum | MSS | 2.48e-18 | -5.56e-01 | 0.3005 |
| 6197 | RPS6KA3 | F007 | Human | Colorectum | FAP | 1.10e-10 | -6.19e-01 | 0.1176 |
| 6197 | RPS6KA3 | A001-C-207 | Human | Colorectum | FAP | 2.03e-07 | -4.51e-01 | 0.1278 |
| 6197 | RPS6KA3 | A015-C-203 | Human | Colorectum | FAP | 5.71e-37 | -6.74e-01 | -0.1294 |
| 6197 | RPS6KA3 | A015-C-204 | Human | Colorectum | FAP | 2.05e-15 | -5.86e-01 | -0.0228 |
| 6197 | RPS6KA3 | A014-C-040 | Human | Colorectum | FAP | 2.47e-08 | -5.72e-01 | -0.1184 |
| 6197 | RPS6KA3 | A002-C-201 | Human | Colorectum | FAP | 5.95e-18 | -4.67e-01 | 0.0324 |
| 6197 | RPS6KA3 | A002-C-203 | Human | Colorectum | FAP | 1.85e-04 | -2.93e-01 | 0.2786 |
| Page: 1 2 3 4 5 6 7 |
| Tissue | Expression Dynamics | Abbreviation |
| Colorectum (GSE201348) |  | FAP: Familial adenomatous polyposis |
| CRC: Colorectal cancer | ||
| Colorectum (HTA11) |  | AD: Adenomas |
| SER: Sessile serrated lesions | ||
| MSI-H: Microsatellite-high colorectal cancer | ||
| MSS: Microsatellite stable colorectal cancer | ||
| Liver | 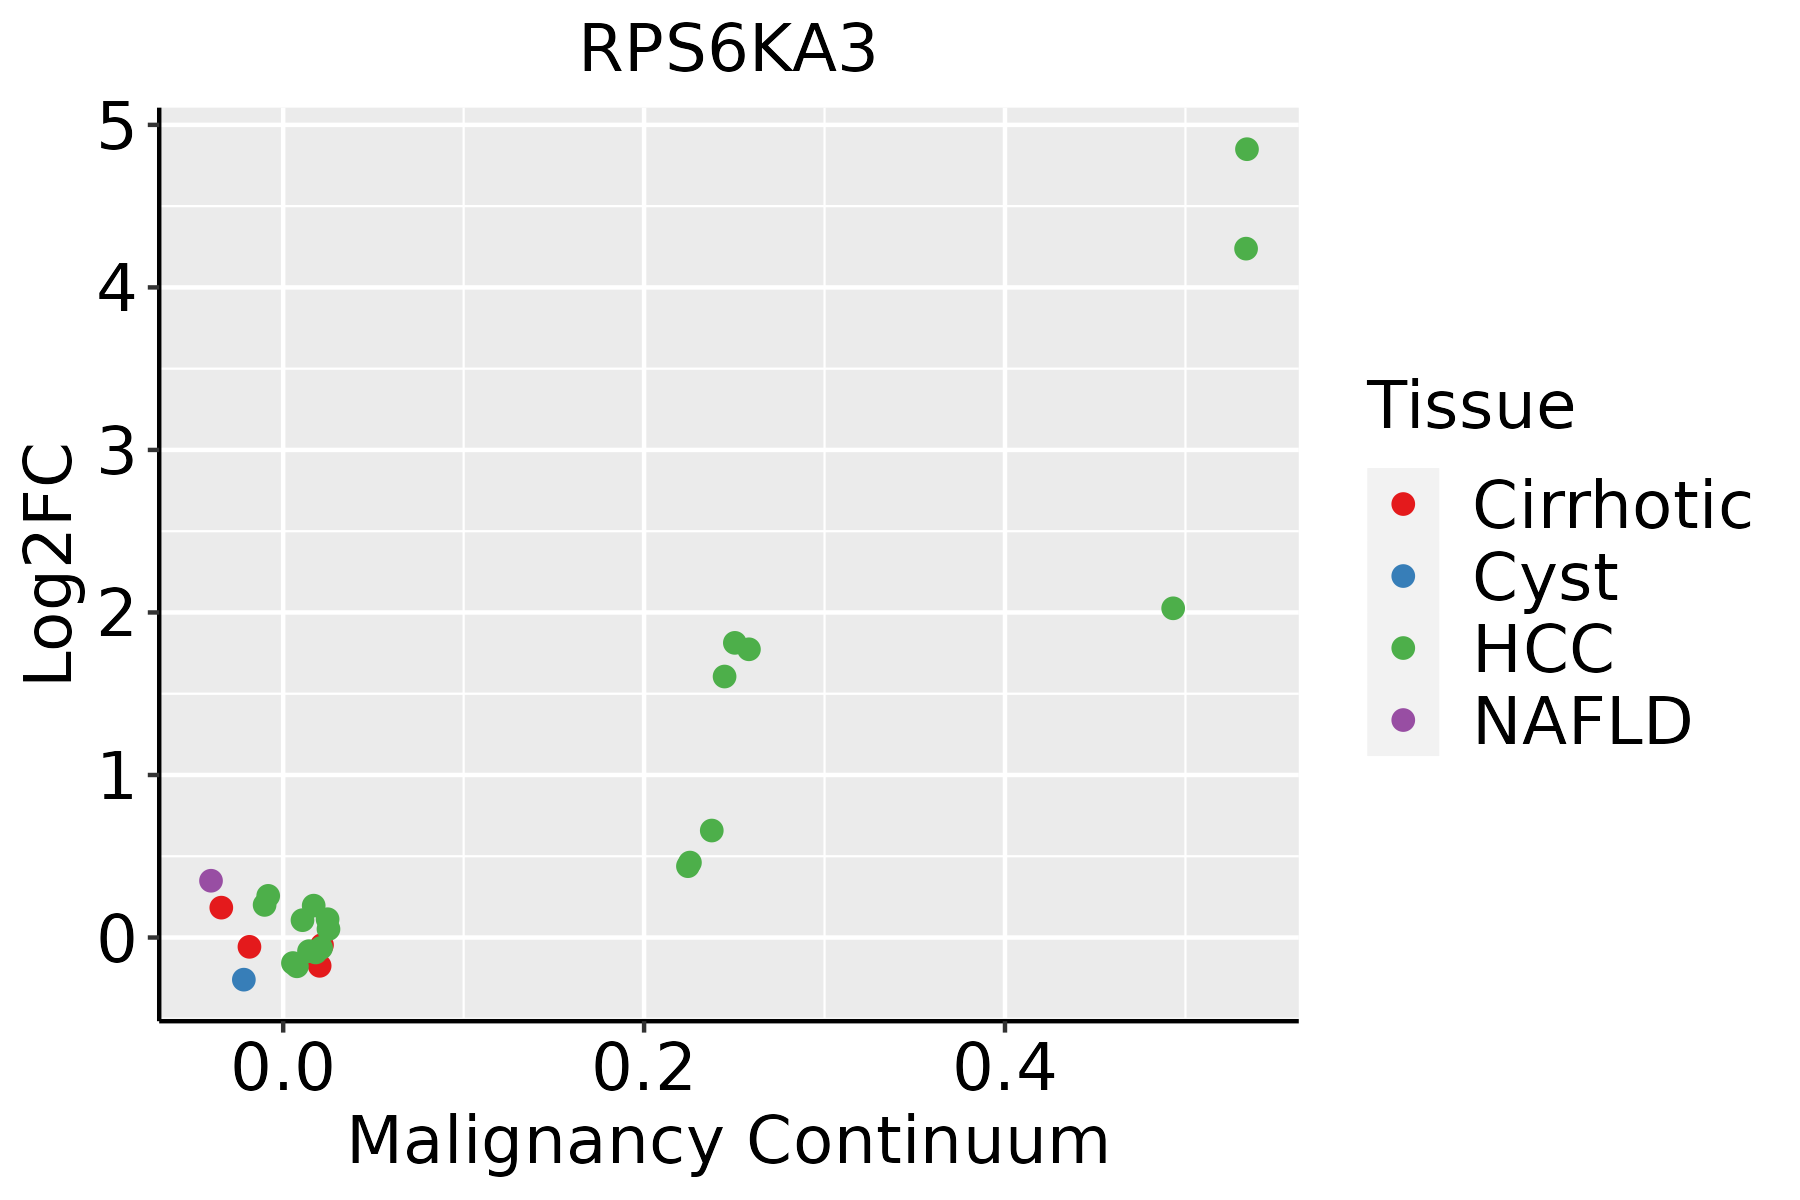 | HCC: Hepatocellular carcinoma |
| NAFLD: Non-alcoholic fatty liver disease | ||
| Lung | 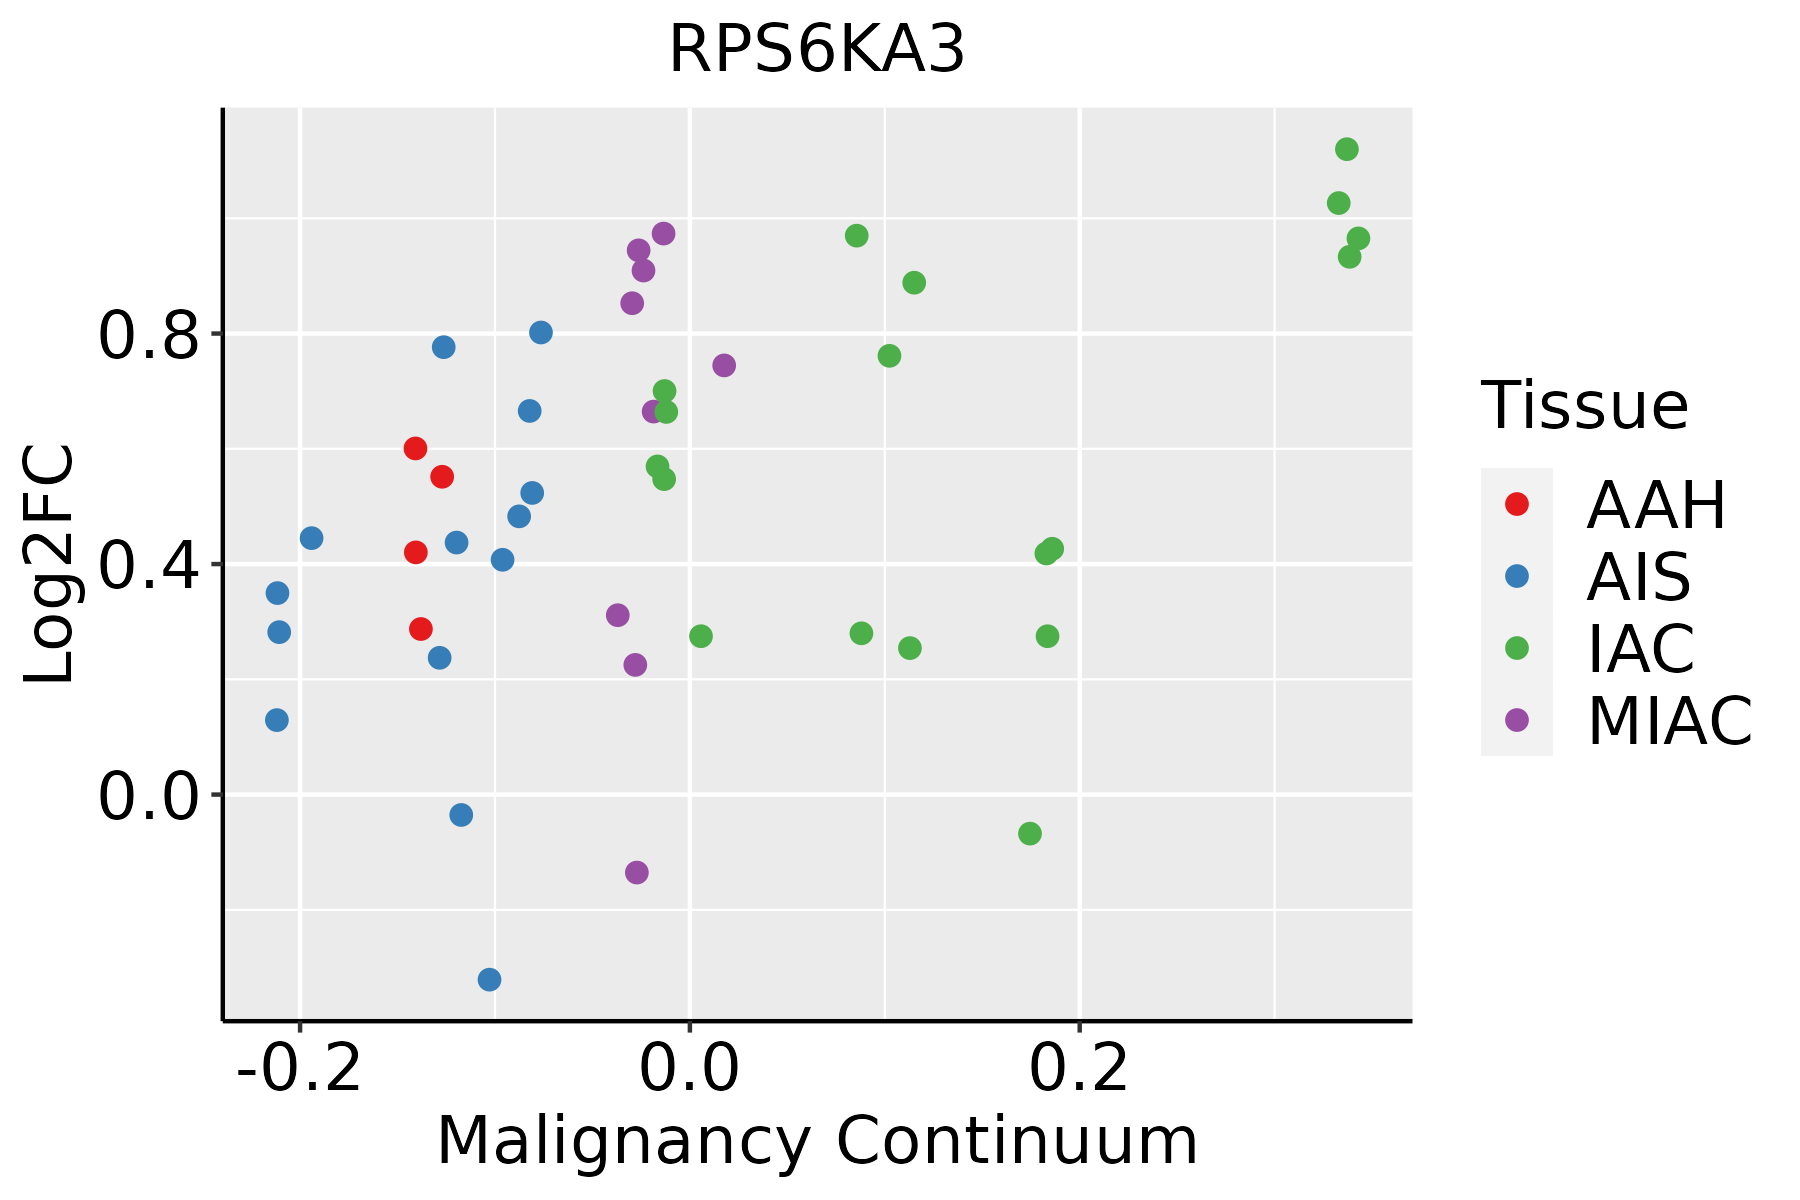 | AAH: Atypical adenomatous hyperplasia |
| AIS: Adenocarcinoma in situ | ||
| IAC: Invasive lung adenocarcinoma | ||
| MIA: Minimally invasive adenocarcinoma | ||
| Oral Cavity | 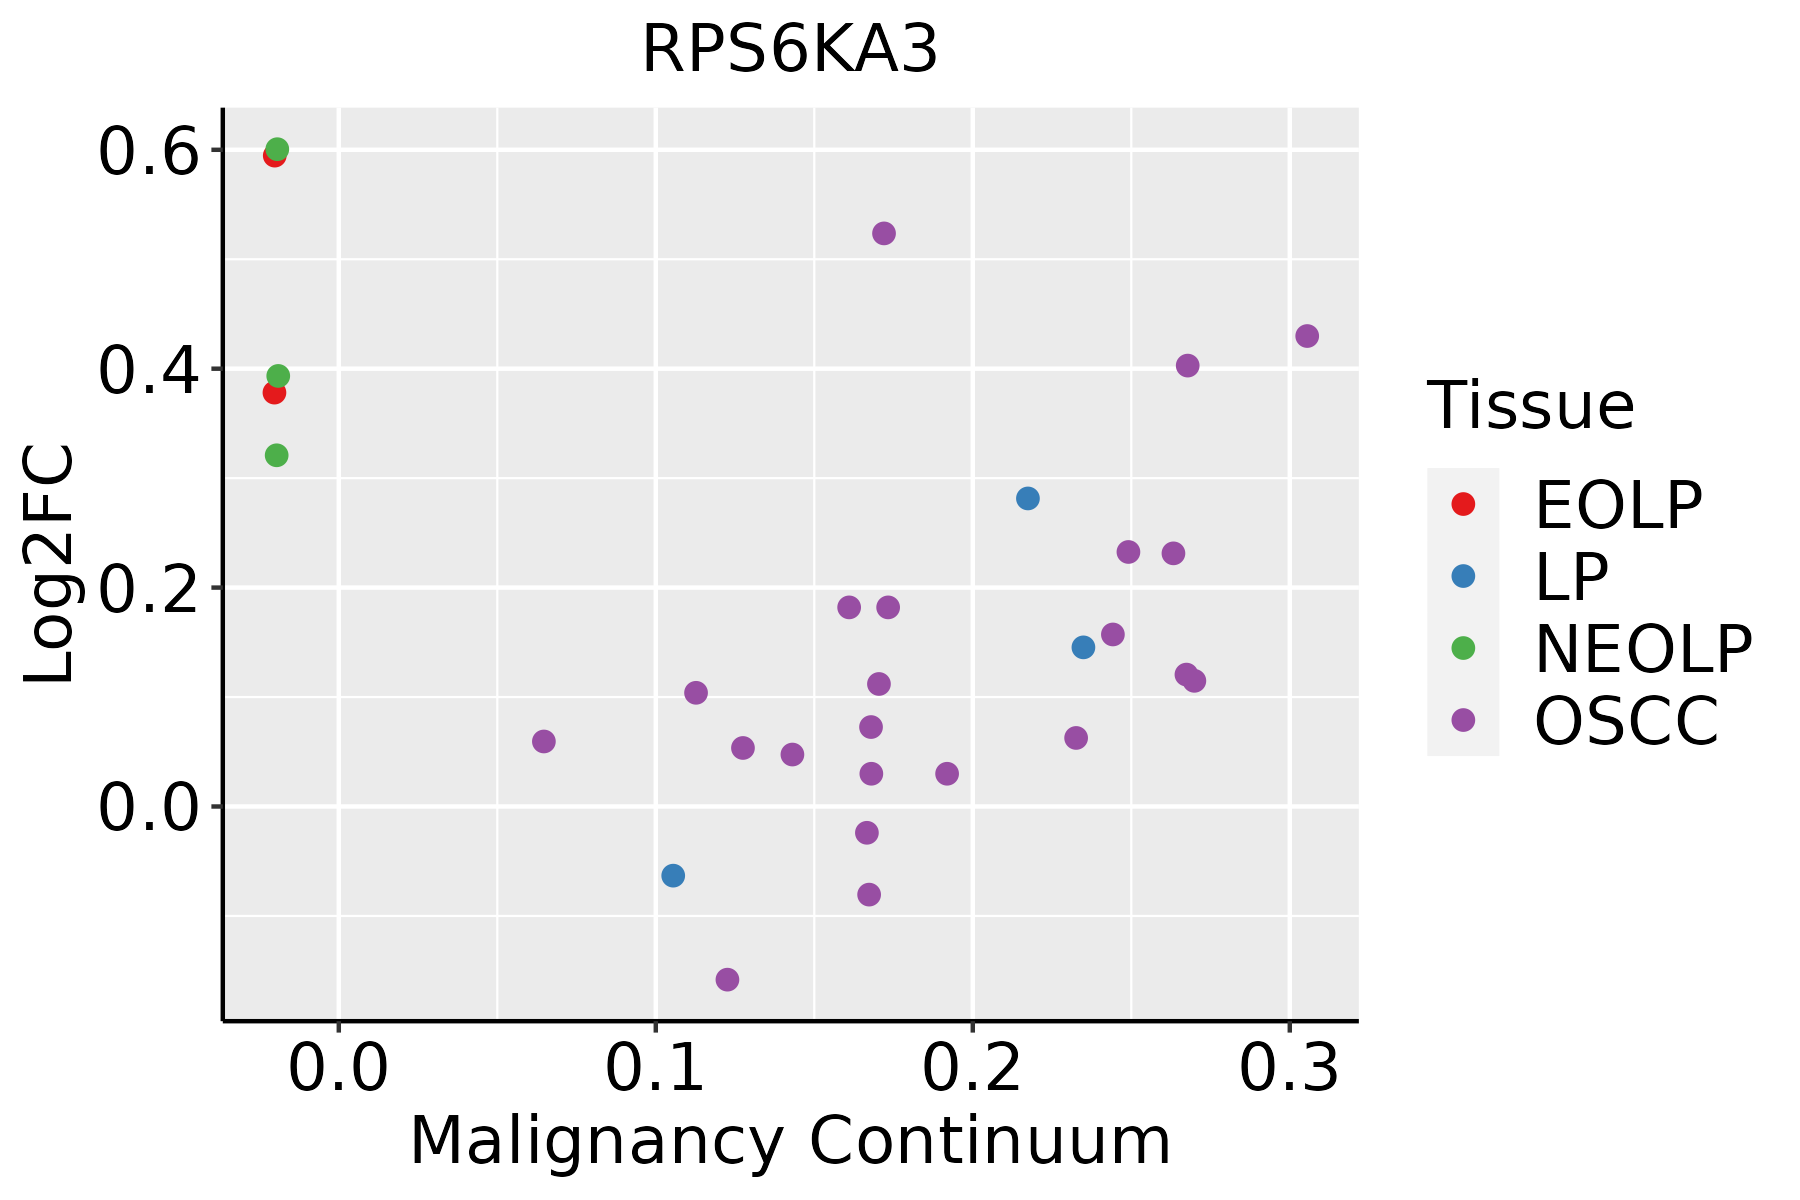 | EOLP: Erosive Oral lichen planus |
| LP: leukoplakia | ||
| NEOLP: Non-erosive oral lichen planus | ||
| OSCC: Oral squamous cell carcinoma | ||
| Prostate |  | BPH: Benign Prostatic Hyperplasia |
| Thyroid |  | ATC: Anaplastic thyroid cancer |
| HT: Hashimoto's thyroiditis | ||
| PTC: Papillary thyroid cancer |
| ∗log2FC in expression of this searched gene in stem-like cells from each diseased tissue sample relative to stem-like cells in normal samples in each tissue plotted against the malignancy continuum. Samples are colored based on if they are from different disease stage. |
Top |
Malignant transformation related pathway analysis |
| Find out the enriched GO biological processes and KEGG pathways involved in transition from healthy to precancer to cancer |
| Tissue | Disease Stage | Enriched GO biological Processes |
| Colorectum | AD |  |
| Colorectum | SER |  |
| Colorectum | MSS |  |
| Colorectum | MSI-H |  |
| Colorectum | FAP |  |
| ∗Top 15 enriched GO BP terms are showed in the bar plot of each disease state in each tissue. Each row represents a significant GO biological process which is colored according to the -log10(p.adjust). |
| Page: 1 2 3 4 5 6 7 8 9 |
| GO ID | Tissue | Disease Stage | Description | Gene Ratio | Bg Ratio | pvalue | p.adjust | Count |
| GO:0006417 | Colorectum | AD | regulation of translation | 141/3918 | 468/18723 | 1.32e-06 | 4.22e-05 | 141 |
| GO:0016049 | Colorectum | AD | cell growth | 143/3918 | 482/18723 | 2.83e-06 | 8.09e-05 | 143 |
| GO:0043281 | Colorectum | AD | regulation of cysteine-type endopeptidase activity involved in apoptotic process | 72/3918 | 209/18723 | 3.70e-06 | 1.03e-04 | 72 |
| GO:2000116 | Colorectum | AD | regulation of cysteine-type endopeptidase activity | 79/3918 | 235/18723 | 3.74e-06 | 1.03e-04 | 79 |
| GO:0052547 | Colorectum | AD | regulation of peptidase activity | 137/3918 | 461/18723 | 4.12e-06 | 1.12e-04 | 137 |
| GO:0001558 | Colorectum | AD | regulation of cell growth | 124/3918 | 414/18723 | 7.67e-06 | 1.86e-04 | 124 |
| GO:0045861 | Colorectum | AD | negative regulation of proteolysis | 106/3918 | 351/18723 | 2.33e-05 | 4.57e-04 | 106 |
| GO:0052548 | Colorectum | AD | regulation of endopeptidase activity | 124/3918 | 432/18723 | 6.58e-05 | 1.07e-03 | 124 |
| GO:0043620 | Colorectum | AD | regulation of DNA-templated transcription in response to stress | 23/3918 | 53/18723 | 1.86e-04 | 2.49e-03 | 23 |
| GO:0043154 | Colorectum | AD | negative regulation of cysteine-type endopeptidase activity involved in apoptotic process | 30/3918 | 78/18723 | 2.95e-04 | 3.59e-03 | 30 |
| GO:0030307 | Colorectum | AD | positive regulation of cell growth | 54/3918 | 166/18723 | 3.08e-04 | 3.69e-03 | 54 |
| GO:0045927 | Colorectum | AD | positive regulation of growth | 77/3918 | 259/18723 | 4.82e-04 | 5.27e-03 | 77 |
| GO:2000117 | Colorectum | AD | negative regulation of cysteine-type endopeptidase activity | 31/3918 | 86/18723 | 8.67e-04 | 8.45e-03 | 31 |
| GO:0018105 | Colorectum | AD | peptidyl-serine phosphorylation | 88/3918 | 315/18723 | 1.73e-03 | 1.43e-02 | 88 |
| GO:0018209 | Colorectum | AD | peptidyl-serine modification | 92/3918 | 338/18723 | 3.19e-03 | 2.36e-02 | 92 |
| GO:00525471 | Colorectum | SER | regulation of peptidase activity | 114/2897 | 461/18723 | 1.18e-07 | 7.17e-06 | 114 |
| GO:00458611 | Colorectum | SER | negative regulation of proteolysis | 88/2897 | 351/18723 | 1.74e-06 | 7.50e-05 | 88 |
| GO:00525481 | Colorectum | SER | regulation of endopeptidase activity | 103/2897 | 432/18723 | 2.86e-06 | 1.16e-04 | 103 |
| GO:00432811 | Colorectum | SER | regulation of cysteine-type endopeptidase activity involved in apoptotic process | 57/2897 | 209/18723 | 8.08e-06 | 2.74e-04 | 57 |
| GO:20001161 | Colorectum | SER | regulation of cysteine-type endopeptidase activity | 62/2897 | 235/18723 | 1.05e-05 | 3.39e-04 | 62 |
| Page: 1 2 3 4 5 6 7 8 9 10 11 12 13 14 15 16 |
| Pathway ID | Tissue | Disease Stage | Description | Gene Ratio | Bg Ratio | pvalue | p.adjust | qvalue | Count |
| hsa0471422 | Liver | HCC | Thermogenesis | 170/4020 | 232/8465 | 5.36e-16 | 2.25e-14 | 1.25e-14 | 170 |
| hsa0493121 | Liver | HCC | Insulin resistance | 77/4020 | 108/8465 | 3.89e-07 | 4.46e-06 | 2.48e-06 | 77 |
| hsa0513542 | Liver | HCC | Yersinia infection | 92/4020 | 137/8465 | 2.25e-06 | 2.19e-05 | 1.22e-05 | 92 |
| hsa041502 | Liver | HCC | mTOR signaling pathway | 95/4020 | 156/8465 | 4.70e-04 | 1.99e-03 | 1.11e-03 | 95 |
| hsa0472210 | Liver | HCC | Neurotrophin signaling pathway | 74/4020 | 119/8465 | 8.27e-04 | 3.26e-03 | 1.81e-03 | 74 |
| hsa0471432 | Liver | HCC | Thermogenesis | 170/4020 | 232/8465 | 5.36e-16 | 2.25e-14 | 1.25e-14 | 170 |
| hsa0493131 | Liver | HCC | Insulin resistance | 77/4020 | 108/8465 | 3.89e-07 | 4.46e-06 | 2.48e-06 | 77 |
| hsa0513552 | Liver | HCC | Yersinia infection | 92/4020 | 137/8465 | 2.25e-06 | 2.19e-05 | 1.22e-05 | 92 |
| hsa0415011 | Liver | HCC | mTOR signaling pathway | 95/4020 | 156/8465 | 4.70e-04 | 1.99e-03 | 1.11e-03 | 95 |
| hsa0472211 | Liver | HCC | Neurotrophin signaling pathway | 74/4020 | 119/8465 | 8.27e-04 | 3.26e-03 | 1.81e-03 | 74 |
| hsa040108 | Lung | IAC | MAPK signaling pathway | 62/1053 | 302/8465 | 3.54e-05 | 6.38e-04 | 4.24e-04 | 62 |
| hsa0472212 | Lung | IAC | Neurotrophin signaling pathway | 29/1053 | 119/8465 | 2.34e-04 | 2.54e-03 | 1.68e-03 | 29 |
| hsa0513514 | Lung | IAC | Yersinia infection | 32/1053 | 137/8465 | 2.63e-04 | 2.76e-03 | 1.83e-03 | 32 |
| hsa0471416 | Lung | IAC | Thermogenesis | 46/1053 | 232/8465 | 7.85e-04 | 6.38e-03 | 4.23e-03 | 46 |
| hsa0401011 | Lung | IAC | MAPK signaling pathway | 62/1053 | 302/8465 | 3.54e-05 | 6.38e-04 | 4.24e-04 | 62 |
| hsa0472213 | Lung | IAC | Neurotrophin signaling pathway | 29/1053 | 119/8465 | 2.34e-04 | 2.54e-03 | 1.68e-03 | 29 |
| hsa0513515 | Lung | IAC | Yersinia infection | 32/1053 | 137/8465 | 2.63e-04 | 2.76e-03 | 1.83e-03 | 32 |
| hsa0471417 | Lung | IAC | Thermogenesis | 46/1053 | 232/8465 | 7.85e-04 | 6.38e-03 | 4.23e-03 | 46 |
| hsa0401021 | Lung | AIS | MAPK signaling pathway | 57/961 | 302/8465 | 6.41e-05 | 9.43e-04 | 6.03e-04 | 57 |
| hsa0513523 | Lung | AIS | Yersinia infection | 30/961 | 137/8465 | 2.70e-04 | 2.92e-03 | 1.87e-03 | 30 |
| Page: 1 2 3 4 5 6 7 8 |
Top |
Cell-cell communication analysis |
| Identification of potential cell-cell interactions between two cell types and their ligand-receptor pairs for different disease states |
| Ligand | Receptor | LRpair | Pathway | Tissue | Disease Stage |
| Page: 1 |
Top |
Single-cell gene regulatory network inference analysis |
| Find out the significant the regulons (TFs) and the target genes of each regulon across cell types for different disease states |
| TF | Cell Type | Tissue | Disease Stage | Target Gene | RSS | Regulon Activity |
| ∗The dot plots of a searched regulon are shown for all cell subpopulations in each disease state of each tissue based on the regulon specific score inferred using pySCENIC and by calculating the average expression. |
| Page: 1 |
Top |
Somatic mutation of malignant transformation related genes |
| Annotation of somatic variants for genes involved in malignant transformation |
| Hugo Symbol | Variant Class | Variant Classification | dbSNP RS | HGVSc | HGVSp | HGVSp Short | SWISSPROT | BIOTYPE | SIFT | PolyPhen | Tumor Sample Barcode | Tissue | Histology | Sex | Age | Stage | Therapy Types | Drugs | Outcome |
| RPS6KA3 | SNV | Missense_Mutation | c.355N>T | p.Arg119Cys | p.R119C | P51812 | protein_coding | deleterious(0) | probably_damaging(1) | TCGA-A8-A09Q-01 | Breast | breast invasive carcinoma | Female | >=65 | III/IV | Hormone Therapy | anastrozole | SD | |
| RPS6KA3 | SNV | Missense_Mutation | c.2038G>A | p.Val680Ile | p.V680I | P51812 | protein_coding | tolerated(0.24) | benign(0) | TCGA-AN-A046-01 | Breast | breast invasive carcinoma | Female | >=65 | I/II | Unknown | Unknown | SD | |
| RPS6KA3 | SNV | Missense_Mutation | novel | c.1399C>A | p.Leu467Ile | p.L467I | P51812 | protein_coding | deleterious(0.01) | probably_damaging(0.94) | TCGA-AN-A046-01 | Breast | breast invasive carcinoma | Female | >=65 | I/II | Unknown | Unknown | SD |
| RPS6KA3 | SNV | Missense_Mutation | rs779360754 | c.1579G>A | p.Val527Ile | p.V527I | P51812 | protein_coding | tolerated(0.07) | benign(0.045) | TCGA-BH-A0BL-01 | Breast | breast invasive carcinoma | Female | <65 | I/II | Chemotherapy | adriamycin | CR |
| RPS6KA3 | SNV | Missense_Mutation | novel | c.909N>G | p.Phe303Leu | p.F303L | P51812 | protein_coding | tolerated(0.51) | benign(0.096) | TCGA-BH-A0BW-01 | Breast | breast invasive carcinoma | Female | >=65 | I/II | Chemotherapy | adriamycin | CR |
| RPS6KA3 | SNV | Missense_Mutation | c.472C>T | p.Arg158Cys | p.R158C | P51812 | protein_coding | deleterious(0) | probably_damaging(0.999) | TCGA-D8-A1XJ-01 | Breast | breast invasive carcinoma | Female | >=65 | III/IV | Hormone Therapy | tamoxiphen | SD | |
| RPS6KA3 | SNV | Missense_Mutation | c.332A>G | p.Asp111Gly | p.D111G | P51812 | protein_coding | deleterious(0) | benign(0.432) | TCGA-D8-A1XQ-01 | Breast | breast invasive carcinoma | Female | >=65 | I/II | Unknown | Unknown | SD | |
| RPS6KA3 | insertion | Nonsense_Mutation | novel | c.2063_2064insGTTGTGG | p.Tyr688Ter | p.Y688* | P51812 | protein_coding | TCGA-E9-A1NC-01 | Breast | breast invasive carcinoma | Female | <65 | I/II | Chemotherapy | doxorubicin | CR | ||
| RPS6KA3 | SNV | Missense_Mutation | novel | c.1377N>A | p.Asp459Glu | p.D459E | P51812 | protein_coding | deleterious(0.03) | benign(0.13) | TCGA-2W-A8YY-01 | Cervix | cervical & endocervical cancer | Female | <65 | I/II | Chemotherapy | cisplatin | CR |
| RPS6KA3 | SNV | Missense_Mutation | novel | c.1171N>G | p.Thr391Ala | p.T391A | P51812 | protein_coding | tolerated(0.85) | benign(0) | TCGA-C5-A901-01 | Cervix | cervical & endocervical cancer | Female | <65 | I/II | Unknown | Unknown | SD |
| Page: 1 2 3 4 5 6 7 8 9 10 11 |
Top |
Related drugs of malignant transformation related genes |
| Identification of chemicals and drugs interact with genes involved in malignant transfromation |
| (DGIdb 4.0) |
| Entrez ID | Symbol | Category | Interaction Types | Drug Claim Name | Drug Name | PMIDs |
| 6197 | RPS6KA3 | DRUGGABLE GENOME, KINASE, ENZYME, SERINE THREONINE KINASE, TRANSCRIPTION FACTOR | inhibitor | 249565819 | ||
| 6197 | RPS6KA3 | DRUGGABLE GENOME, KINASE, ENZYME, SERINE THREONINE KINASE, TRANSCRIPTION FACTOR | GNF-PF-2301 | CHEMBL578061 | ||
| 6197 | RPS6KA3 | DRUGGABLE GENOME, KINASE, ENZYME, SERINE THREONINE KINASE, TRANSCRIPTION FACTOR | GM-CSF | REGRAMOSTIM | 8662788 | |
| 6197 | RPS6KA3 | DRUGGABLE GENOME, KINASE, ENZYME, SERINE THREONINE KINASE, TRANSCRIPTION FACTOR | LAUROGUADINE | LAUROGUADINE | ||
| 6197 | RPS6KA3 | DRUGGABLE GENOME, KINASE, ENZYME, SERINE THREONINE KINASE, TRANSCRIPTION FACTOR | inhibitor | 249565718 | CHEMBL573107 | |
| 6197 | RPS6KA3 | DRUGGABLE GENOME, KINASE, ENZYME, SERINE THREONINE KINASE, TRANSCRIPTION FACTOR | SP-600125 | SP-600125 | ||
| 6197 | RPS6KA3 | DRUGGABLE GENOME, KINASE, ENZYME, SERINE THREONINE KINASE, TRANSCRIPTION FACTOR | PHA-767491 | CHEMBL225519 | ||
| 6197 | RPS6KA3 | DRUGGABLE GENOME, KINASE, ENZYME, SERINE THREONINE KINASE, TRANSCRIPTION FACTOR | GS 6201 | GS 6201 | ||
| 6197 | RPS6KA3 | DRUGGABLE GENOME, KINASE, ENZYME, SERINE THREONINE KINASE, TRANSCRIPTION FACTOR | LY-2090314 | LY-2090314 | ||
| 6197 | RPS6KA3 | DRUGGABLE GENOME, KINASE, ENZYME, SERINE THREONINE KINASE, TRANSCRIPTION FACTOR | UREA | UREA | 9458825 |
| Page: 1 2 3 4 5 |

Copyright 2023-Present -The University of Texas Health Science Center at Houston |