Schematic overview of the cellular and molecular mechanisms involved in the cancer progression, including the proposed cellular and molecular mechanisms in cancer cells trajectory. AT1: alveolar type 1 cells; AT2: alveolar type 2 cells; AAH: atypical adenomatous hyperplasia; AIS: adenocarcinoma in situ; MIA: minimally invasive adenocarcinoma; IA: invasive adenocarcinoma; EMT: epithelial-mesenchymal transition

Home

Download

Statistics

Help

Contact

Center for Computational Systems Medicine
leaf

Gene summary

leaf

Malignant transformation analysis

leaf

Malignant transformation related pathway analysis

leaf

Cell-cell communication analysis

leaf

Single-cell gene regulatory network inference analysis

leaf

Somatic mutation of malignant transformation related genes

leaf

Related drugs of malignant transformation related genes

Gene: ELOC

Gene summary for ELOC

check button Gene summary.

Gene informationSpeciesHuman
Gene symbol

ELOC

Gene ID

6921

Gene nameelongin C
Gene AliasSIII
Cytomap8q21.11
Gene Typeprotein-coding
GO ID

GO:0006139

UniProtAcc

A0A024R7Y5


Top

Malignant transformation analysis

check button Identification of the aberrant gene expression in precancerous and cancerous lesions by comparing the gene expression of stem-like cells in diseased tissues with normal stem cells
check button Malignant transformation involving gene list.
Entrez IDSymbolReplicatesSpeciesOrganTissueAdj P-valueLog2FCMalignancy
6921ELOCGSM4909281HumanBreastIDC2.00e-286.61e-010.21
6921ELOCGSM4909282HumanBreastIDC2.55e-257.15e-01-0.0288
6921ELOCGSM4909285HumanBreastIDC2.69e-164.66e-010.21
6921ELOCGSM4909286HumanBreastIDC4.10e-233.31e-010.1081
6921ELOCGSM4909289HumanBreastIDC1.95e-035.05e-010.1064
6921ELOCGSM4909290HumanBreastIDC1.39e-073.70e-010.2096
6921ELOCGSM4909291HumanBreastIDC5.34e-461.03e+000.1753
6921ELOCGSM4909293HumanBreastIDC8.82e-081.36e-010.1581
6921ELOCGSM4909295HumanBreastIDC1.60e-054.41e-010.0898
6921ELOCGSM4909296HumanBreastIDC8.58e-073.53e-010.1524
6921ELOCGSM4909297HumanBreastIDC1.62e-052.16e-010.1517
6921ELOCGSM4909298HumanBreastIDC3.25e-081.85e-010.1551
6921ELOCGSM4909301HumanBreastIDC1.68e-023.40e-010.1577
6921ELOCGSM4909304HumanBreastIDC2.69e-062.86e-010.1636
6921ELOCGSM4909305HumanBreastIDC1.15e-094.17e-010.0436
6921ELOCGSM4909306HumanBreastIDC1.38e-267.01e-010.1564
6921ELOCGSM4909307HumanBreastIDC7.59e-094.28e-010.1569
6921ELOCGSM4909308HumanBreastIDC4.45e-154.06e-010.158
6921ELOCGSM4909309HumanBreastIDC1.77e-033.23e-010.0483
6921ELOCGSM4909311HumanBreastIDC7.21e-192.08e-010.1534
Page: 1 2 3 4 5 6 7 8 9 

check button Transcriptomic changes along malignancy continuum.
TissueExpression DynamicsAbbreviation
BreastThe image shows the transcriptomic changes along malignancy continuum.log2FC in expression of this searched gene in stem-like cells from each diseased tissue sample relative to stem-like cells in normal samples in each tissue plotted against the malignancy continuum. Samples are colored based on if they are from different disease stage.IDC: Invasive ductal carcinoma
DCIS: Ductal carcinoma in situ
Precancer(BRCA1-mut): Precancerous lesion from BRCA1 mutation carriers
EndometriumThe image shows the transcriptomic changes along malignancy continuum.log2FC in expression of this searched gene in stem-like cells from each diseased tissue sample relative to stem-like cells in normal samples in each tissue plotted against the malignancy continuum. Samples are colored based on if they are from different disease stage.
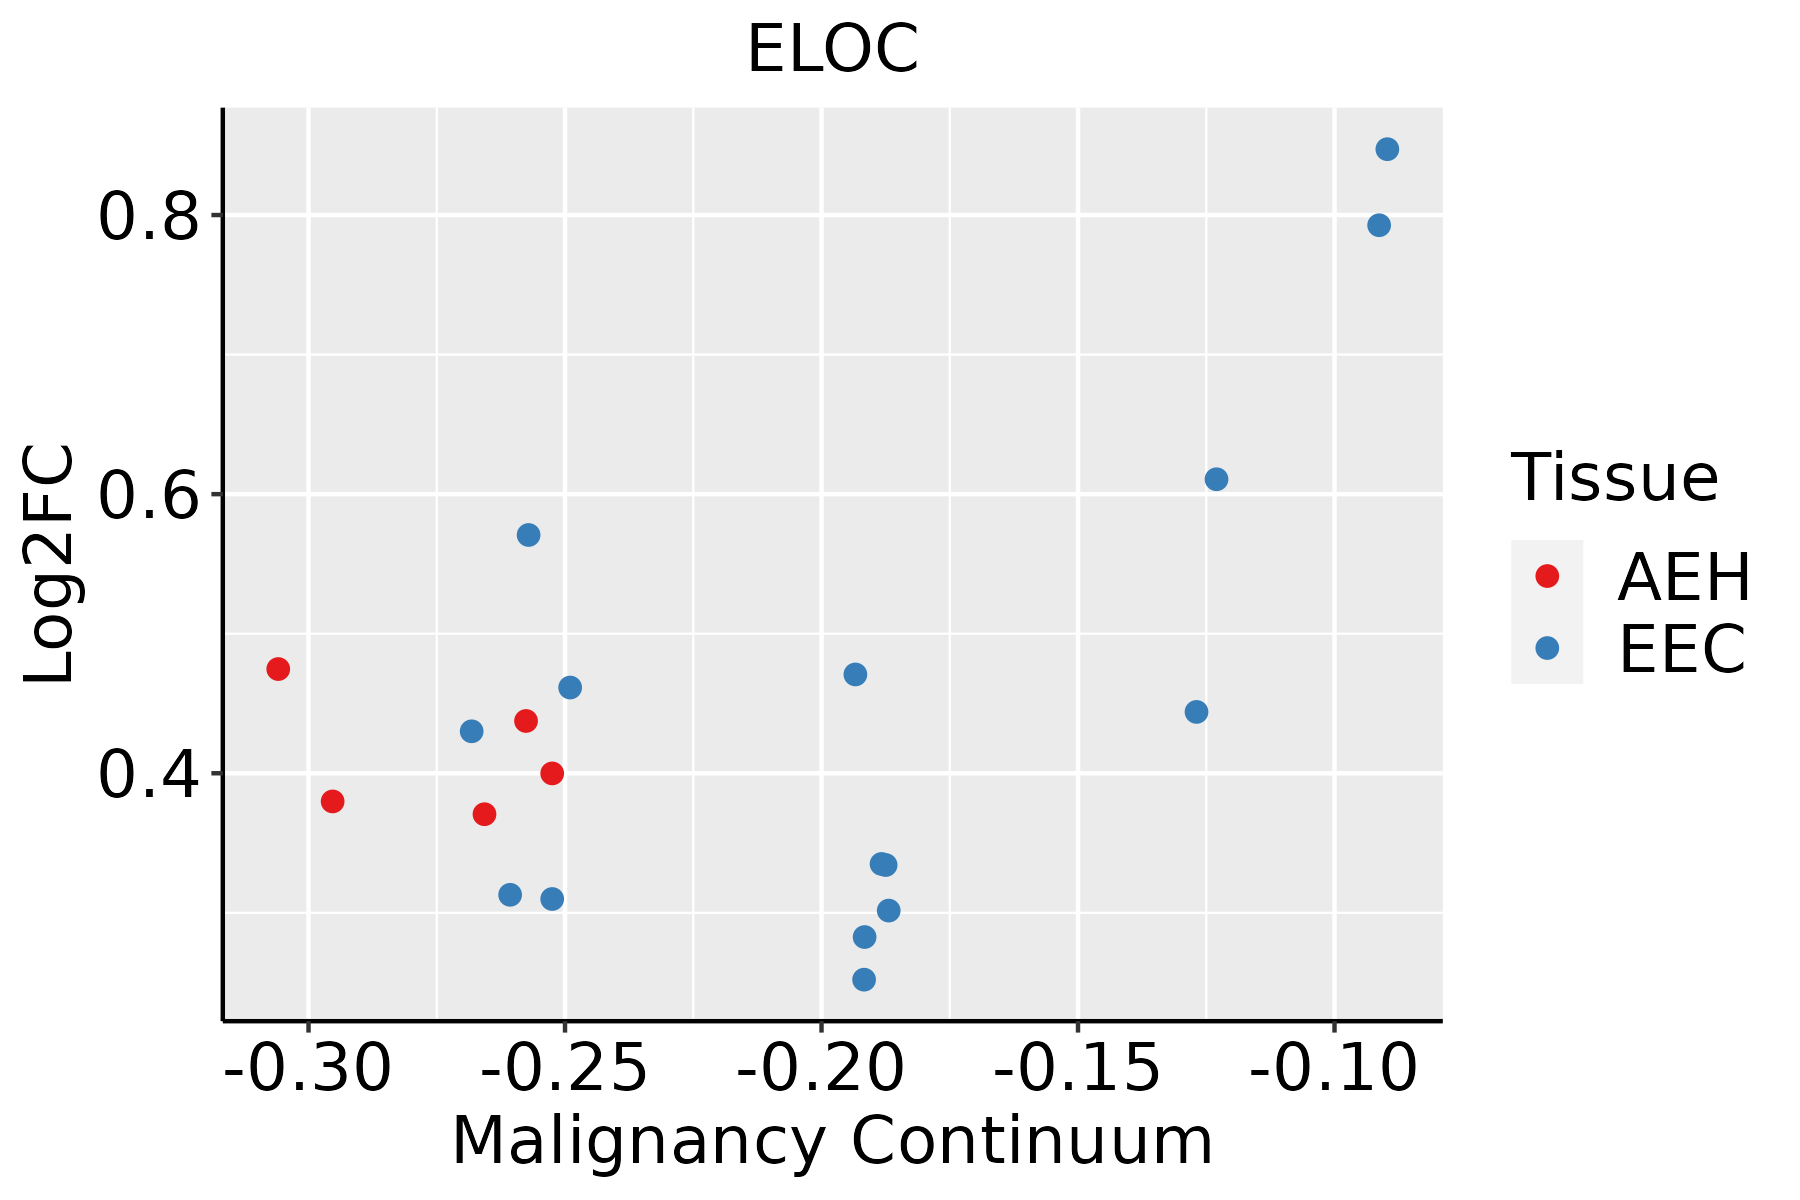
AEH: Atypical endometrial hyperplasia
EEC: Endometrioid Cancer
EsophagusThe image shows the transcriptomic changes along malignancy continuum.log2FC in expression of this searched gene in stem-like cells from each diseased tissue sample relative to stem-like cells in normal samples in each tissue plotted against the malignancy continuum. Samples are colored based on if they are from different disease stage.ESCC: Esophageal squamous cell carcinoma
HGIN: High-grade intraepithelial neoplasias
LGIN: Low-grade intraepithelial neoplasias
GCThe image shows the transcriptomic changes along malignancy continuum.log2FC in expression of this searched gene in stem-like cells from each diseased tissue sample relative to stem-like cells in normal samples in each tissue plotted against the malignancy continuum. Samples are colored based on if they are from different disease stage.
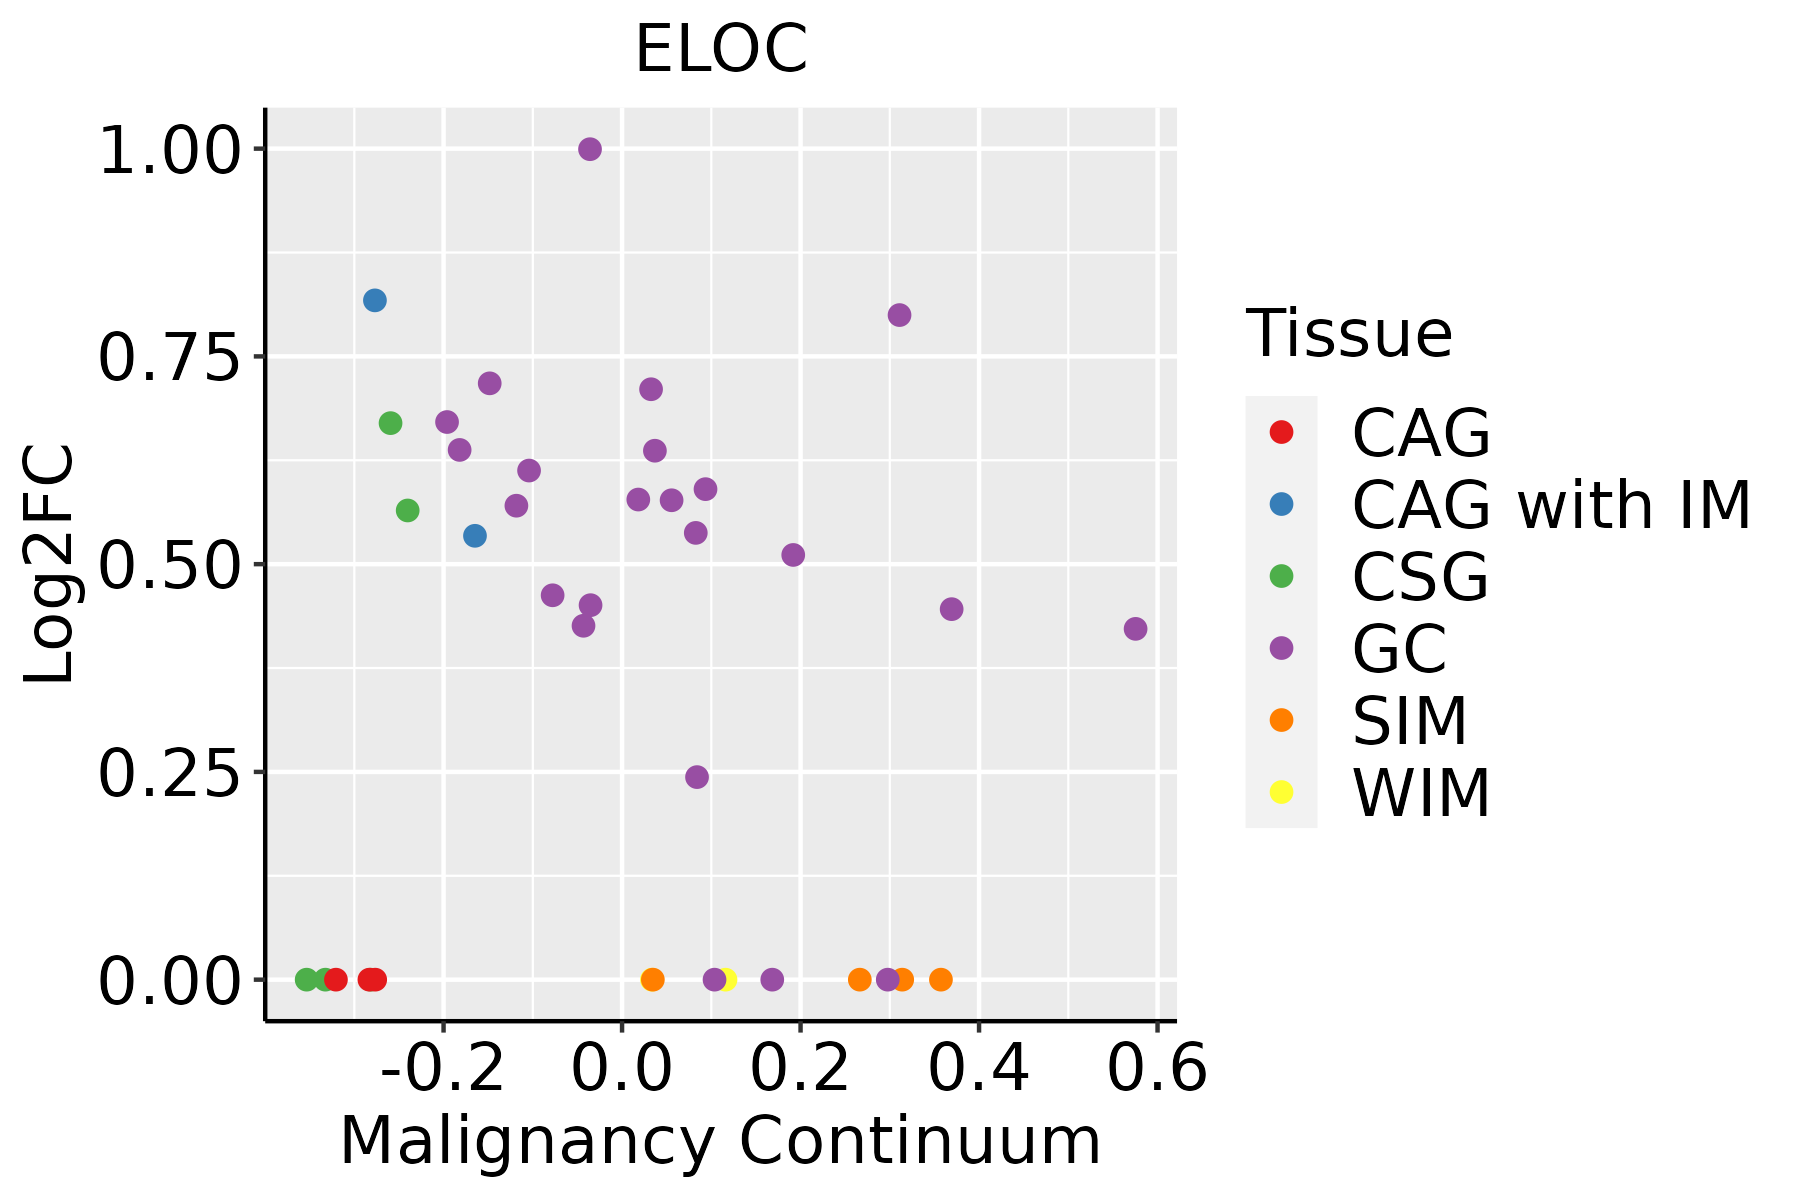
CAG: Chronic atrophic gastritis
CAG with IM: Chronic atrophic gastritis with intestinal metaplasia
CSG: Chronic superficial gastritis
GC: Gastric cancer
SIM: Severe intestinal metaplasia
WIM: Wild intestinal metaplasia
LiverThe image shows the transcriptomic changes along malignancy continuum.log2FC in expression of this searched gene in stem-like cells from each diseased tissue sample relative to stem-like cells in normal samples in each tissue plotted against the malignancy continuum. Samples are colored based on if they are from different disease stage.
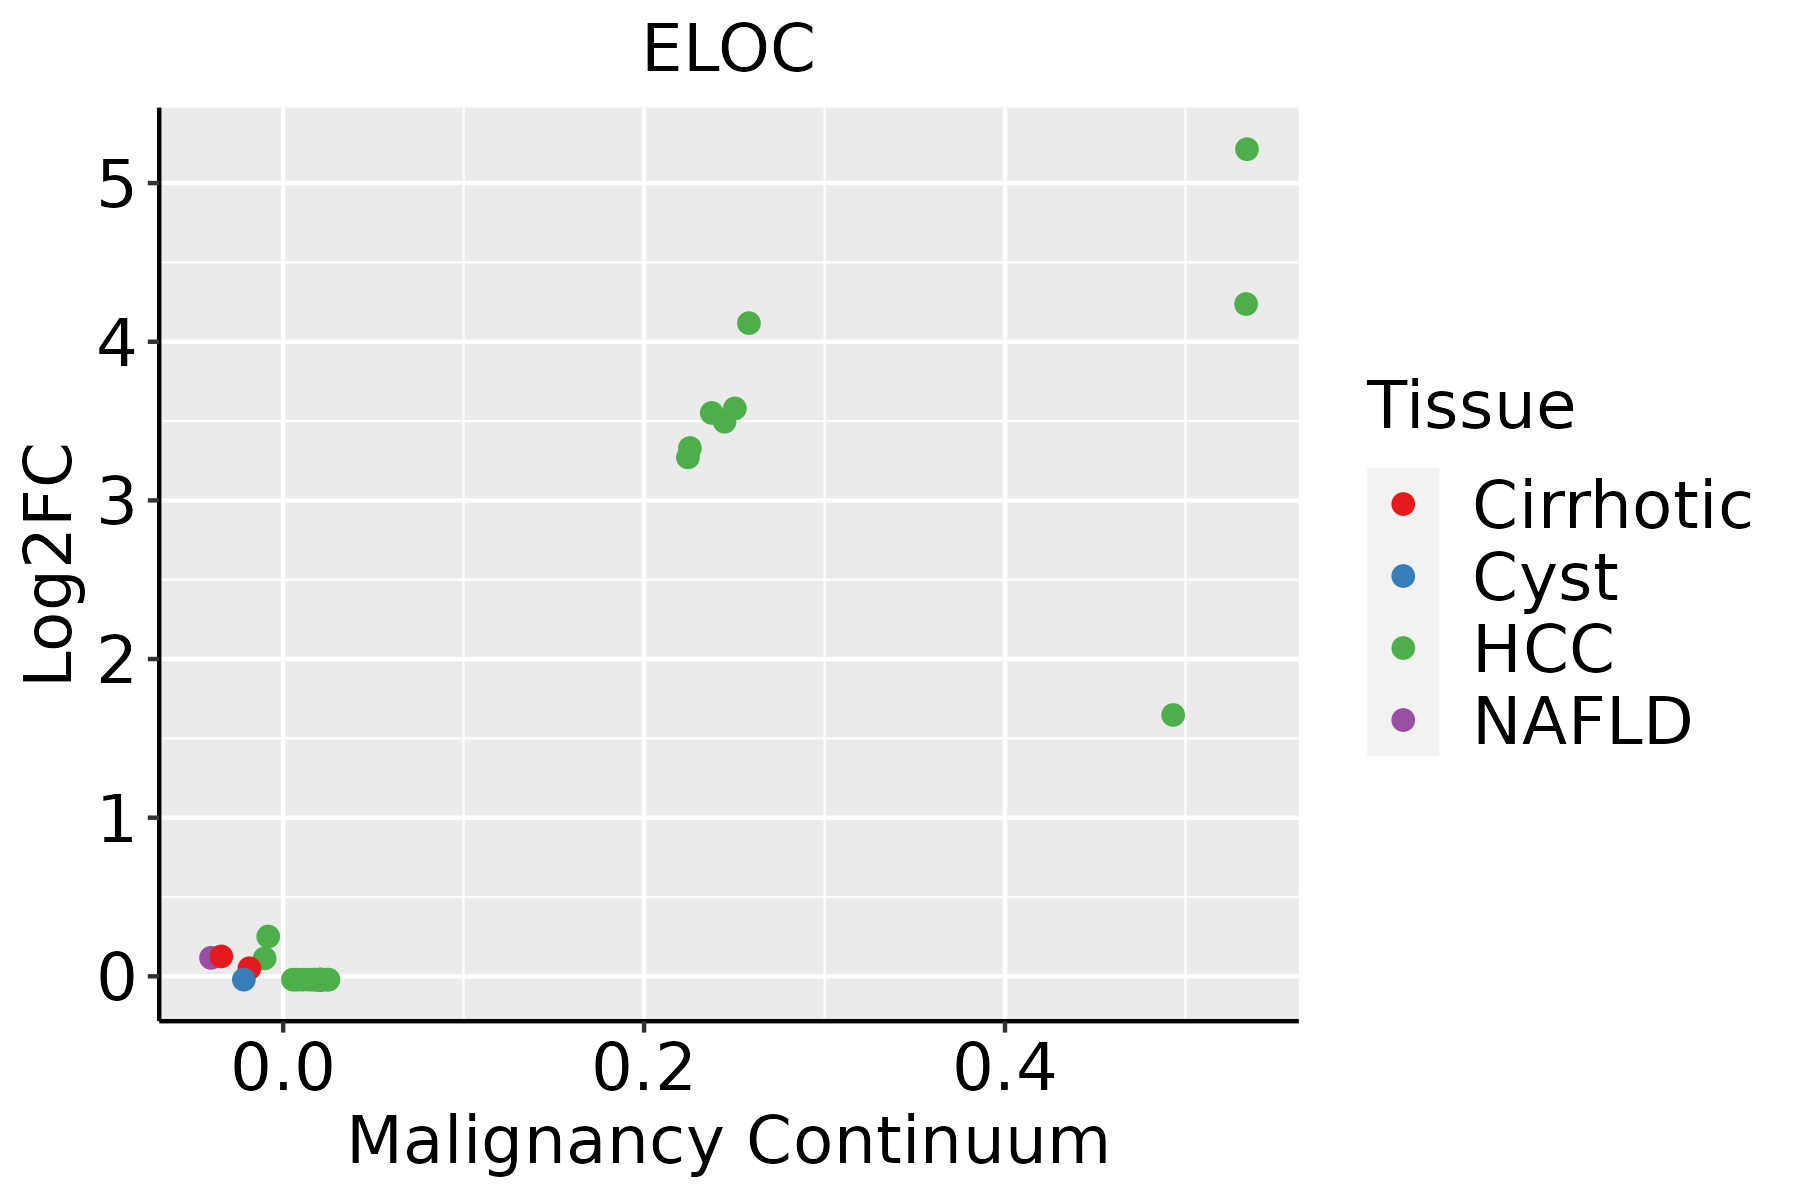
HCC: Hepatocellular carcinoma
NAFLD: Non-alcoholic fatty liver disease
LungThe image shows the transcriptomic changes along malignancy continuum.log2FC in expression of this searched gene in stem-like cells from each diseased tissue sample relative to stem-like cells in normal samples in each tissue plotted against the malignancy continuum. Samples are colored based on if they are from different disease stage.
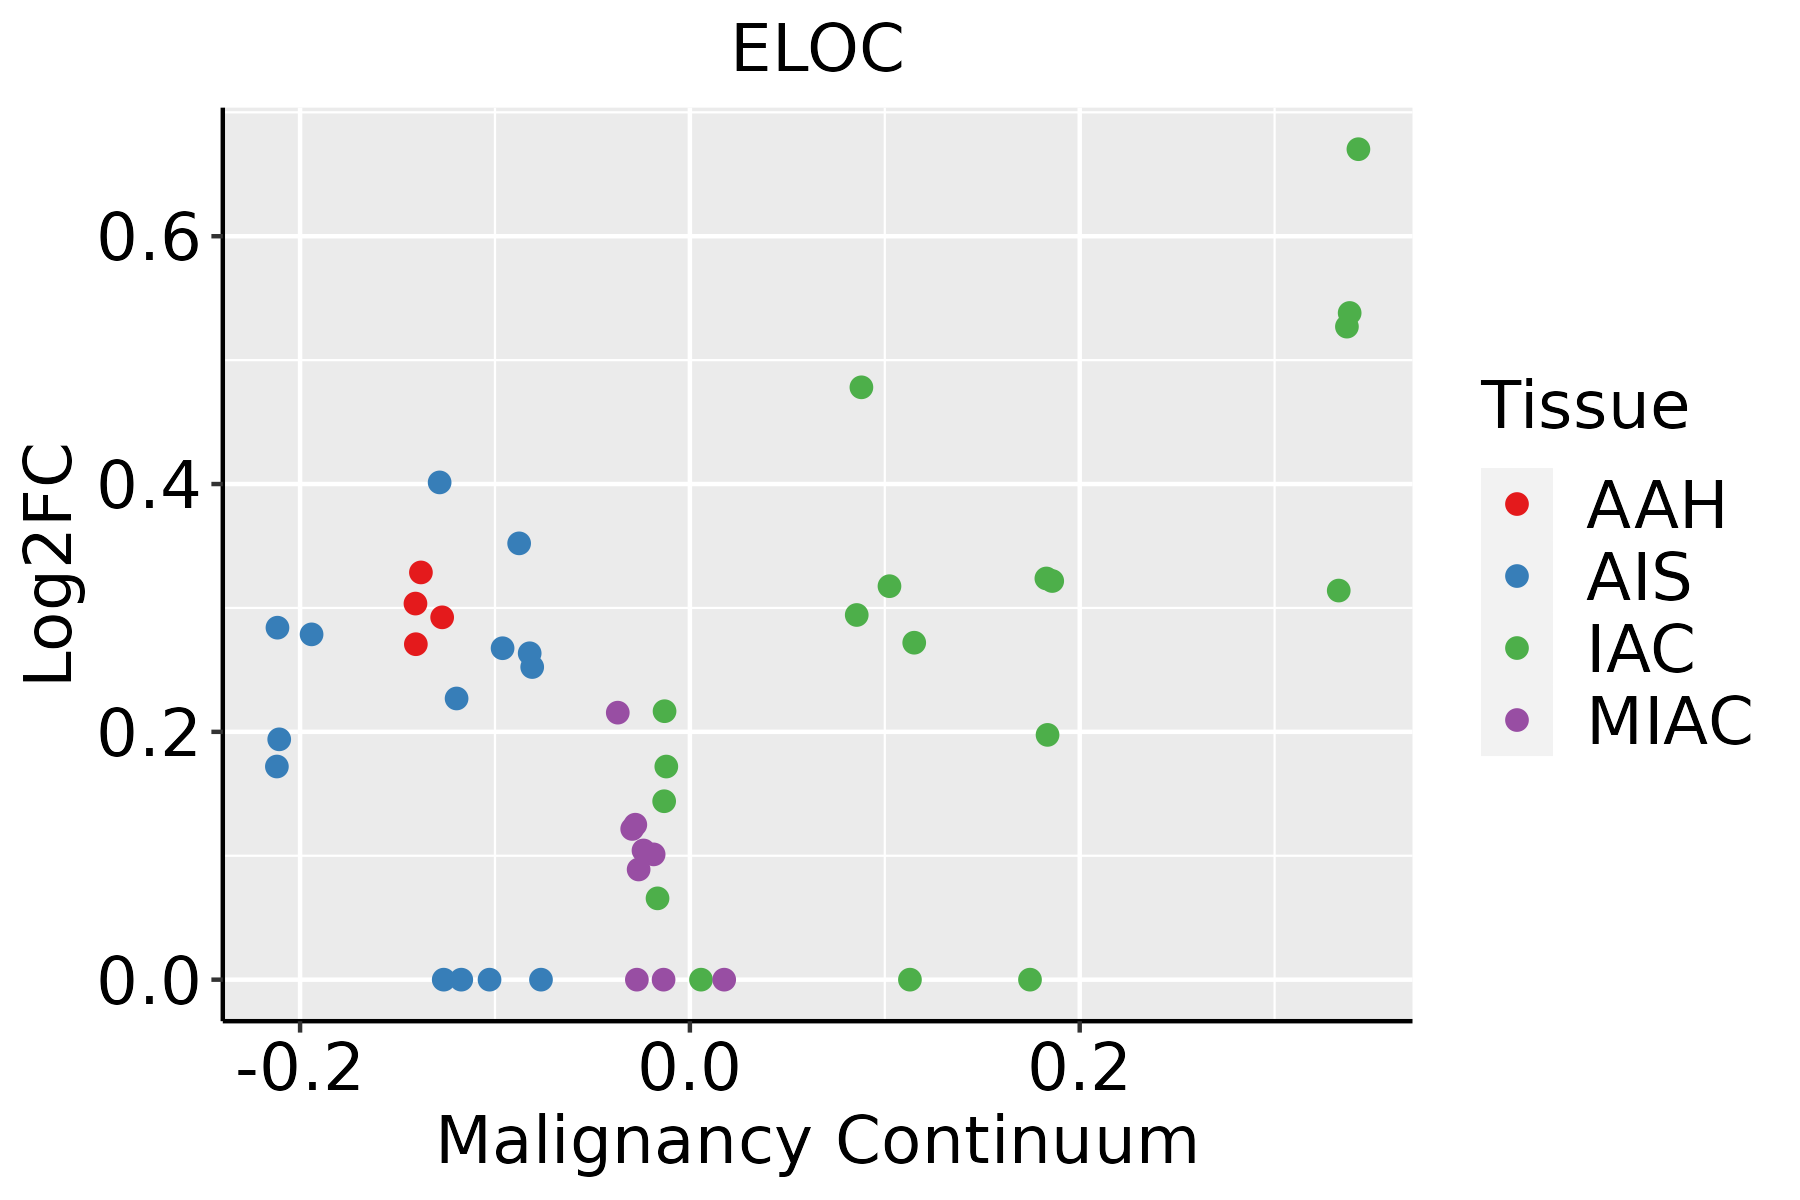
AAH: Atypical adenomatous hyperplasia
AIS: Adenocarcinoma in situ
IAC: Invasive lung adenocarcinoma
MIA: Minimally invasive adenocarcinoma
ProstateThe image shows the transcriptomic changes along malignancy continuum.log2FC in expression of this searched gene in stem-like cells from each diseased tissue sample relative to stem-like cells in normal samples in each tissue plotted against the malignancy continuum. Samples are colored based on if they are from different disease stage.BPH: Benign Prostatic Hyperplasia
SkinThe image shows the transcriptomic changes along malignancy continuum.log2FC in expression of this searched gene in stem-like cells from each diseased tissue sample relative to stem-like cells in normal samples in each tissue plotted against the malignancy continuum. Samples are colored based on if they are from different disease stage.AK: Actinic keratosis
cSCC: Cutaneous squamous cell carcinoma
SCCIS:squamous cell carcinoma in situ
ThyroidThe image shows the transcriptomic changes along malignancy continuum.log2FC in expression of this searched gene in stem-like cells from each diseased tissue sample relative to stem-like cells in normal samples in each tissue plotted against the malignancy continuum. Samples are colored based on if they are from different disease stage.ATC: Anaplastic thyroid cancer
HT: Hashimoto's thyroiditis
PTC: Papillary thyroid cancer
∗log2FC in expression of this searched gene in stem-like cells from each diseased tissue sample relative to stem-like cells in normal samples in each tissue plotted against the malignancy continuum. Samples are colored based on if they are from different disease stage.

Top

Malignant transformation related pathway analysis

check buttonFind out the enriched GO biological processes and KEGG pathways involved in transition from healthy to precancer to cancer
check button Figure of enriched GO biological processes.
TissueDisease StageEnriched GO biological Processes
ColorectumADGO analysis - Figure of enriched GO biological processes: Top 15 enriched GO BP terms are showed in the bar plot of each disease state in each tissue. Each row represents a significant GO biological process which is colored according to the -log10(p.adjust).
ColorectumSERGO analysis - Figure of enriched GO biological processes: Top 15 enriched GO BP terms are showed in the bar plot of each disease state in each tissue. Each row represents a significant GO biological process which is colored according to the -log10(p.adjust).
ColorectumMSSGO analysis - Figure of enriched GO biological processes: Top 15 enriched GO BP terms are showed in the bar plot of each disease state in each tissue. Each row represents a significant GO biological process which is colored according to the -log10(p.adjust).
ColorectumMSI-HGO analysis - Figure of enriched GO biological processes: Top 15 enriched GO BP terms are showed in the bar plot of each disease state in each tissue. Each row represents a significant GO biological process which is colored according to the -log10(p.adjust).
ColorectumFAPGO analysis - Figure of enriched GO biological processes: Top 15 enriched GO BP terms are showed in the bar plot of each disease state in each tissue. Each row represents a significant GO biological process which is colored according to the -log10(p.adjust).
∗Top 15 enriched GO BP terms are showed in the bar plot of each disease state in each tissue. Each row represents a significant GO biological process which is colored according to the -log10(p.adjust).
Page: 1 2 3 4 5 6 7 8 9 

check button Enriched GO biological processes.
GO IDTissueDisease StageDescriptionGene RatioBg Ratiopvaluep.adjustCount
Page: 1 

check button Enriched KEGG pathways.
Pathway IDTissueDisease StageDescriptionGene RatioBg Ratiopvaluep.adjustqvalueCount
hsa0521110ProstateBPHRenal cell carcinoma26/171869/84656.25e-043.08e-031.90e-0326
hsa0517020ProstateBPHHuman immunodeficiency virus 1 infection60/1718212/84652.96e-031.12e-026.92e-0360
hsa0412019ProstateBPHUbiquitin mediated proteolysis61/1718142/84655.50e-109.07e-095.61e-0961
hsa04066111ProstateBPHHIF-1 signaling pathway40/1718109/84654.97e-053.35e-042.07e-0440
hsa0521115ProstateBPHRenal cell carcinoma26/171869/84656.25e-043.08e-031.90e-0326
hsa05170110ProstateBPHHuman immunodeficiency virus 1 infection60/1718212/84652.96e-031.12e-026.92e-0360
hsa0412024ProstateTumorUbiquitin mediated proteolysis61/1791142/84653.08e-095.09e-083.16e-0861
hsa0406626ProstateTumorHIF-1 signaling pathway41/1791109/84655.67e-054.27e-042.65e-0441
hsa0521124ProstateTumorRenal cell carcinoma26/179169/84651.20e-035.23e-033.25e-0326
hsa0517026ProstateTumorHuman immunodeficiency virus 1 infection62/1791212/84653.05e-031.12e-026.94e-0362
hsa0412034ProstateTumorUbiquitin mediated proteolysis61/1791142/84653.08e-095.09e-083.16e-0861
hsa0406635ProstateTumorHIF-1 signaling pathway41/1791109/84655.67e-054.27e-042.65e-0441
hsa0521134ProstateTumorRenal cell carcinoma26/179169/84651.20e-035.23e-033.25e-0326
hsa0517036ProstateTumorHuman immunodeficiency virus 1 infection62/1791212/84653.05e-031.12e-026.94e-0362
hsa0406610StomachGCHIF-1 signaling pathway20/708109/84656.21e-045.23e-033.68e-0320
hsa051708StomachGCHuman immunodeficiency virus 1 infection30/708212/84652.91e-031.76e-021.24e-0230
hsa0406611StomachGCHIF-1 signaling pathway20/708109/84656.21e-045.23e-033.68e-0320
hsa0517011StomachGCHuman immunodeficiency virus 1 infection30/708212/84652.91e-031.76e-021.24e-0230
hsa0517021StomachCAG with IMHuman immunodeficiency virus 1 infection29/640212/84651.26e-038.93e-036.27e-0329
hsa0406621StomachCAG with IMHIF-1 signaling pathway18/640109/84651.26e-038.93e-036.27e-0318
Page: 1 2 3 4 5 

Top

Cell-cell communication analysis

check buttonIdentification of potential cell-cell interactions between two cell types and their ligand-receptor pairs for different disease states
LigandReceptorLRpairPathwayTissueDisease Stage
Page: 1 

Top

Single-cell gene regulatory network inference analysis

check buttonFind out the significant the regulons (TFs) and the target genes of each regulon across cell types for different disease states
TFCell TypeTissueDisease StageTarget GeneRSSRegulon Activity
∗The dot plots of a searched regulon are shown for all cell subpopulations in each disease state of each tissue based on the regulon specific score inferred using pySCENIC and by calculating the average expression.
Page: 1 

Top

Somatic mutation of malignant transformation related genes

check buttonAnnotation of somatic variants for genes involved in malignant transformation
Hugo SymbolVariant ClassVariant ClassificationdbSNP RSHGVScHGVSpHGVSp ShortSWISSPROTBIOTYPESIFTPolyPhenTumor Sample BarcodeTissueHistologySexAgeStageTherapy TypesDrugsOutcome
ELOCSNVMissense_Mutationc.200N>Tp.Ser67Leup.S67LQ15369protein_codingdeleterious(0.01)benign(0.061)TCGA-AR-A256-01Breastbreast invasive carcinomaFemale<65I/IIChemotherapydoxorubicinPD
ELOCSNVMissense_Mutationc.122N>Tp.Thr41Metp.T41MQ15369protein_codingtolerated(0.05)possibly_damaging(0.604)TCGA-AD-5900-01Colorectumcolon adenocarcinomaMale>=65I/IIUnknownUnknownSD
ELOCinsertionIn_Frame_Insnovelc.192_193insTTCAACTGCp.Glu64_Ile65insPheAsnCysp.E64_I65insFNCQ15369protein_codingTCGA-F4-6703-01Colorectumcolon adenocarcinomaMale<65I/IIUnknownUnknownSD
ELOCSNVMissense_Mutationnovelc.212C>Tp.Ser71Leup.S71LQ15369protein_codingtolerated(0.25)benign(0.003)TCGA-A5-A2K5-01Endometriumuterine corpus endometrioid carcinomaFemale>=65I/IIUnknownUnknownSD
ELOCSNVMissense_Mutationnovelc.158N>Ap.Ala53Aspp.A53DQ15369protein_codingdeleterious(0.02)benign(0.367)TCGA-AJ-A3EK-01Endometriumuterine corpus endometrioid carcinomaFemale<65I/IIChemotherapycarboplatinCR
ELOCSNVMissense_Mutationc.256A>Gp.Ser86Glyp.S86GQ15369protein_codingdeleterious(0.01)benign(0.284)TCGA-AP-A05N-01Endometriumuterine corpus endometrioid carcinomaFemale<65I/IIUnknownUnknownSD
ELOCSNVMissense_Mutationc.122N>Tp.Thr41Metp.T41MQ15369protein_codingtolerated(0.05)possibly_damaging(0.604)TCGA-B5-A11E-01Endometriumuterine corpus endometrioid carcinomaFemale<65I/IIUnknownUnknownSD
ELOCSNVMissense_Mutationnovelc.272N>Ap.Pro91Hisp.P91HQ15369protein_codingdeleterious(0)possibly_damaging(0.481)TCGA-B5-A1MX-01Endometriumuterine corpus endometrioid carcinomaFemale<65I/IIHormone TherapymegaceSD
ELOCSNVMissense_Mutationrs762993549c.233N>Tp.Thr78Metp.T78MQ15369protein_codingtolerated(0.18)benign(0.067)TCGA-EO-A22R-01Endometriumuterine corpus endometrioid carcinomaFemale<65I/IIUnknownUnknownSD
ELOCSNVMissense_Mutationnovelc.158C>Tp.Ala53Valp.A53VQ15369protein_codingtolerated(0.08)benign(0.056)TCGA-EO-A22U-01Endometriumuterine corpus endometrioid carcinomaFemale>=65I/IIUnknownUnknownSD
Page: 1 2 

Top

Related drugs of malignant transformation related genes

check buttonIdentification of chemicals and drugs interact with genes involved in malignant transfromation
(DGIdb 4.0)
Entrez IDSymbolCategoryInteraction TypesDrug Claim NameDrug NamePMIDs
Page: 1