
|
|||||
|
 | |
| |
| |
| |
| |
| |
|
Gene: CTNND1 |
Gene summary for CTNND1 |
| Gene information | Species | Human | Gene symbol | CTNND1 | Gene ID | 1500 |
| Gene name | catenin delta 1 | |
| Gene Alias | BCDS2 | |
| Cytomap | 11q12.1 | |
| Gene Type | protein-coding | GO ID | GO:0007043 | UniProtAcc | O60716 |
Top |
Malignant transformation analysis |
| Identification of the aberrant gene expression in precancerous and cancerous lesions by comparing the gene expression of stem-like cells in diseased tissues with normal stem cells |
| Entrez ID | Symbol | Replicates | Species | Organ | Tissue | Adj P-value | Log2FC | Malignancy |
| 1500 | CTNND1 | CCI_2 | Human | Cervix | CC | 2.80e-05 | 7.07e-01 | 0.5249 |
| 1500 | CTNND1 | CCI_3 | Human | Cervix | CC | 2.60e-04 | 6.68e-01 | 0.516 |
| 1500 | CTNND1 | Tumor | Human | Cervix | CC | 5.45e-48 | 8.98e-01 | 0.1241 |
| 1500 | CTNND1 | sample3 | Human | Cervix | CC | 1.64e-66 | 1.02e+00 | 0.1387 |
| 1500 | CTNND1 | H2 | Human | Cervix | HSIL_HPV | 1.76e-04 | 3.23e-01 | 0.0632 |
| 1500 | CTNND1 | T1 | Human | Cervix | CC | 4.54e-09 | 4.64e-01 | 0.0918 |
| 1500 | CTNND1 | T3 | Human | Cervix | CC | 1.35e-71 | 1.01e+00 | 0.1389 |
| 1500 | CTNND1 | HTA11_2487_2000001011 | Human | Colorectum | SER | 6.61e-07 | 5.76e-01 | -0.1808 |
| 1500 | CTNND1 | HTA11_1938_2000001011 | Human | Colorectum | AD | 2.07e-15 | 9.20e-01 | -0.0811 |
| 1500 | CTNND1 | HTA11_78_2000001011 | Human | Colorectum | AD | 1.44e-10 | 7.06e-01 | -0.1088 |
| 1500 | CTNND1 | HTA11_347_2000001011 | Human | Colorectum | AD | 1.29e-34 | 9.89e-01 | -0.1954 |
| 1500 | CTNND1 | HTA11_411_2000001011 | Human | Colorectum | SER | 5.83e-05 | 9.31e-01 | -0.2602 |
| 1500 | CTNND1 | HTA11_2112_2000001011 | Human | Colorectum | SER | 4.59e-03 | 7.83e-01 | -0.2196 |
| 1500 | CTNND1 | HTA11_83_2000001011 | Human | Colorectum | SER | 1.25e-09 | 7.14e-01 | -0.1526 |
| 1500 | CTNND1 | HTA11_2992_2000001011 | Human | Colorectum | SER | 1.06e-06 | 8.87e-01 | -0.1706 |
| 1500 | CTNND1 | HTA11_5212_2000001011 | Human | Colorectum | AD | 3.18e-09 | 8.90e-01 | -0.2061 |
| 1500 | CTNND1 | HTA11_7862_2000001011 | Human | Colorectum | AD | 6.93e-03 | 3.73e-01 | -0.0179 |
| 1500 | CTNND1 | HTA11_866_3004761011 | Human | Colorectum | AD | 2.42e-05 | 4.91e-01 | 0.096 |
| 1500 | CTNND1 | HTA11_7663_2000001011 | Human | Colorectum | SER | 4.21e-06 | 7.38e-01 | 0.0131 |
| 1500 | CTNND1 | HTA11_10623_2000001011 | Human | Colorectum | AD | 1.49e-04 | 7.09e-01 | -0.0177 |
| Page: 1 2 3 4 5 6 7 8 9 10 11 12 13 |
| Tissue | Expression Dynamics | Abbreviation |
| Cervix | 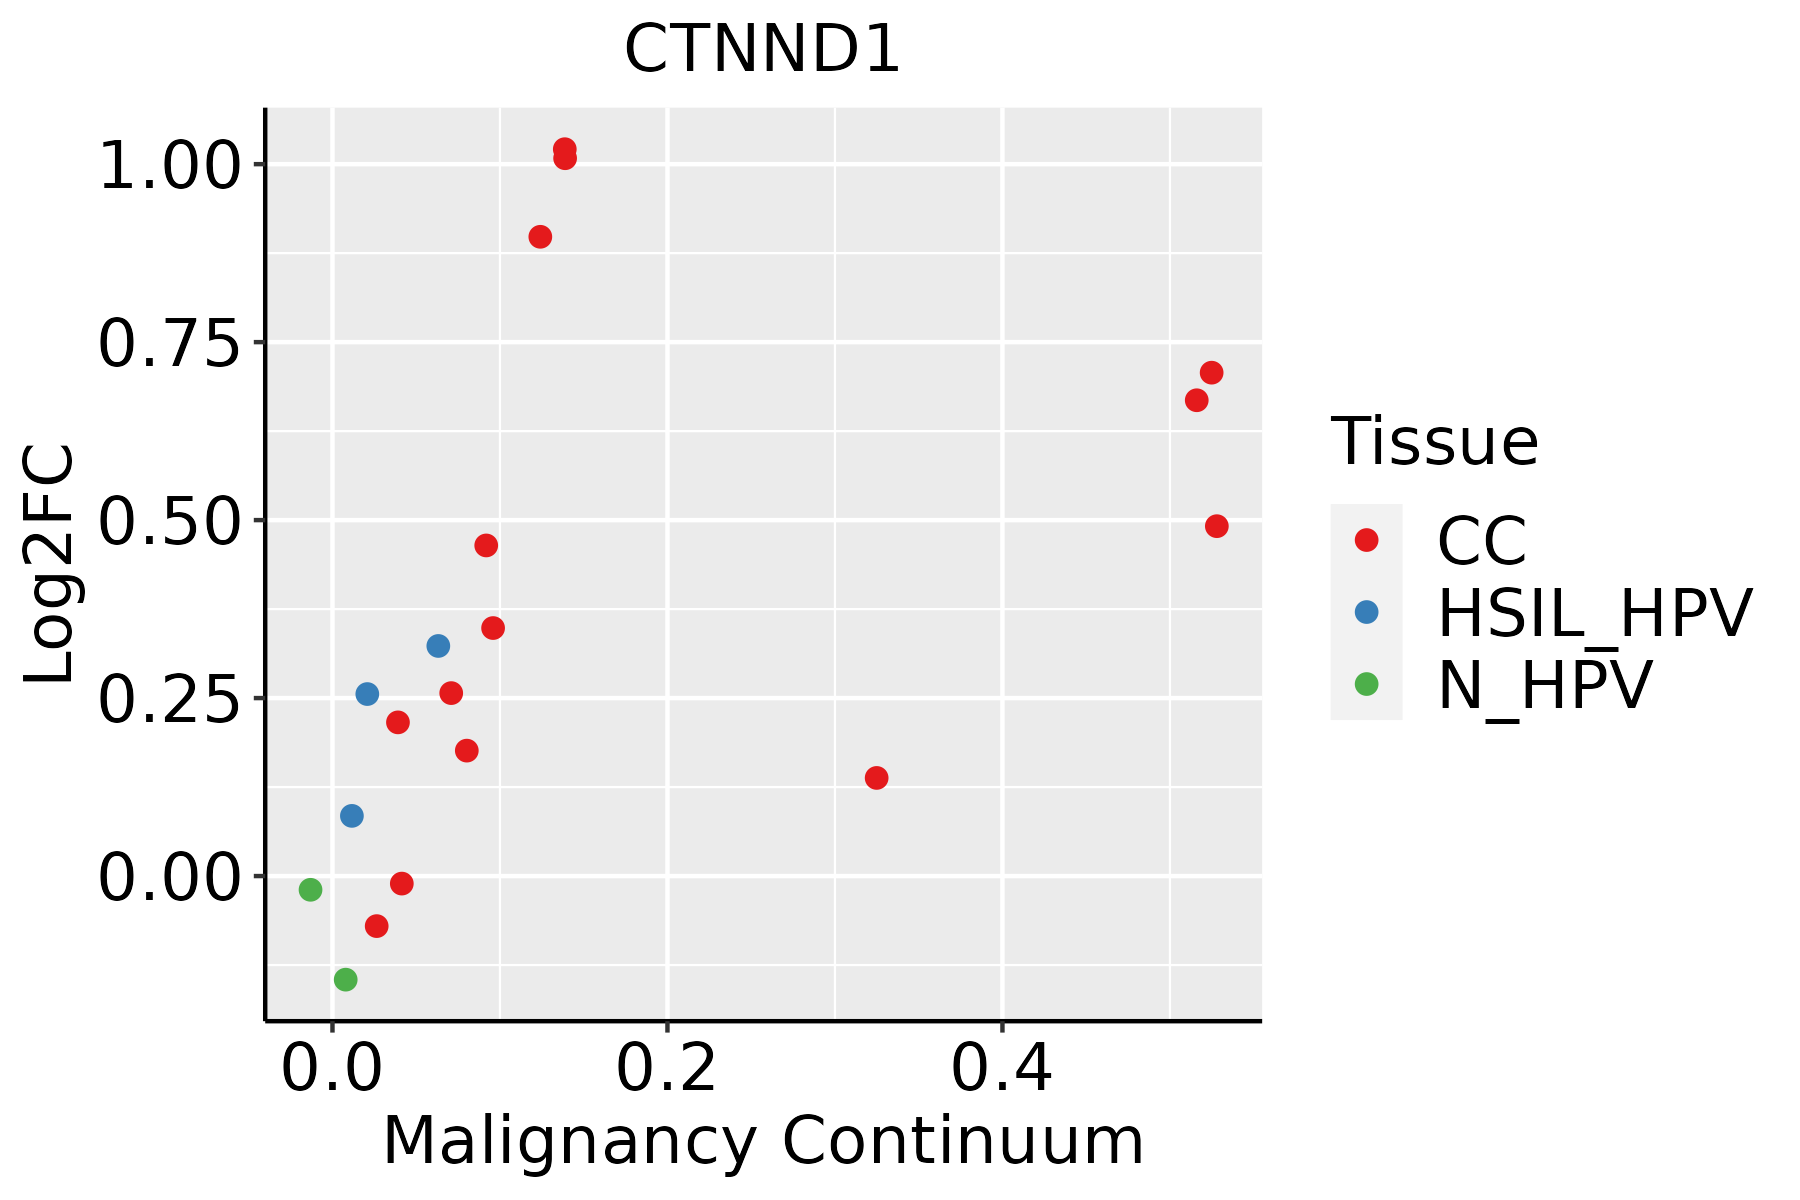 | CC: Cervix cancer |
| HSIL_HPV: HPV-infected high-grade squamous intraepithelial lesions | ||
| N_HPV: HPV-infected normal cervix | ||
| Colorectum (GSE201348) |  | FAP: Familial adenomatous polyposis |
| CRC: Colorectal cancer | ||
| Colorectum (HTA11) |  | AD: Adenomas |
| SER: Sessile serrated lesions | ||
| MSI-H: Microsatellite-high colorectal cancer | ||
| MSS: Microsatellite stable colorectal cancer | ||
| Endometrium |  | AEH: Atypical endometrial hyperplasia |
| EEC: Endometrioid Cancer | ||
| Esophagus |  | ESCC: Esophageal squamous cell carcinoma |
| HGIN: High-grade intraepithelial neoplasias | ||
| LGIN: Low-grade intraepithelial neoplasias | ||
| Liver | 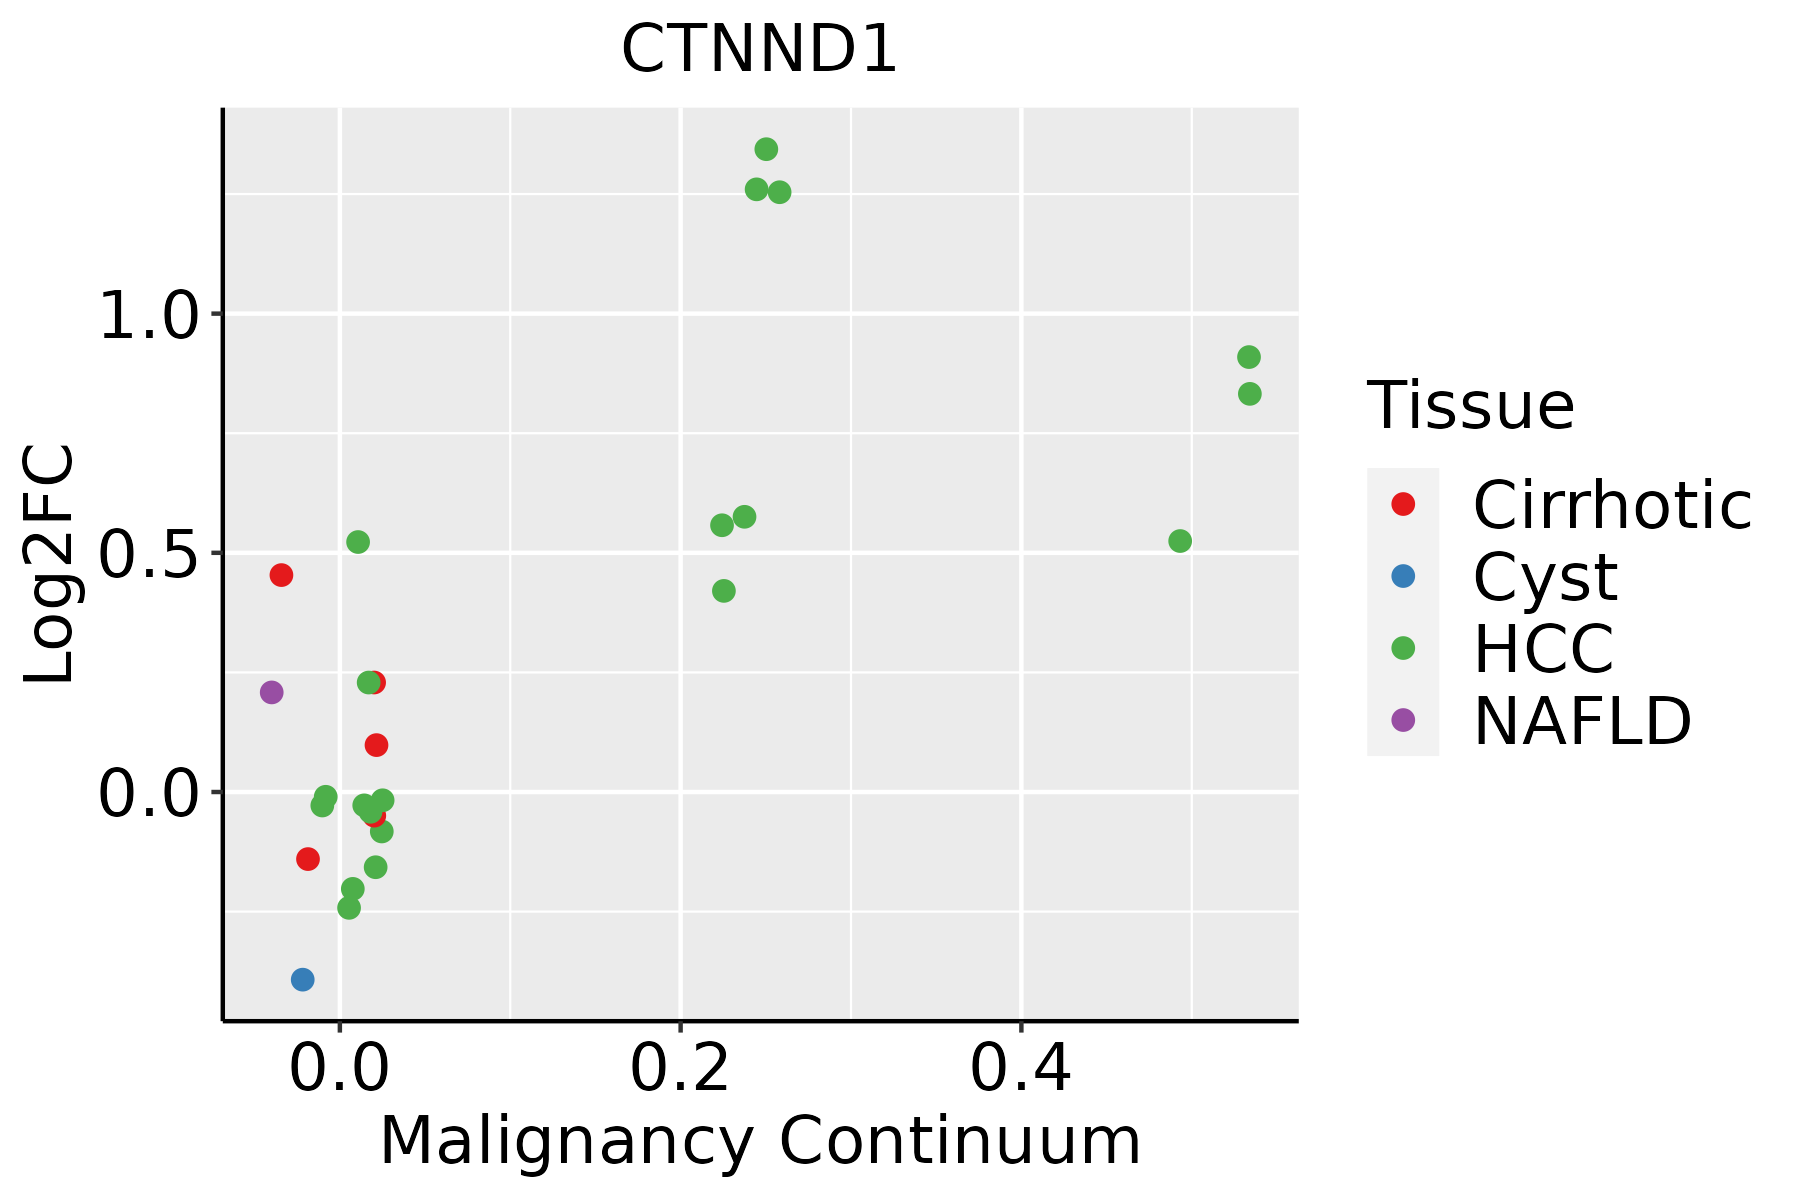 | HCC: Hepatocellular carcinoma |
| NAFLD: Non-alcoholic fatty liver disease | ||
| Lung | 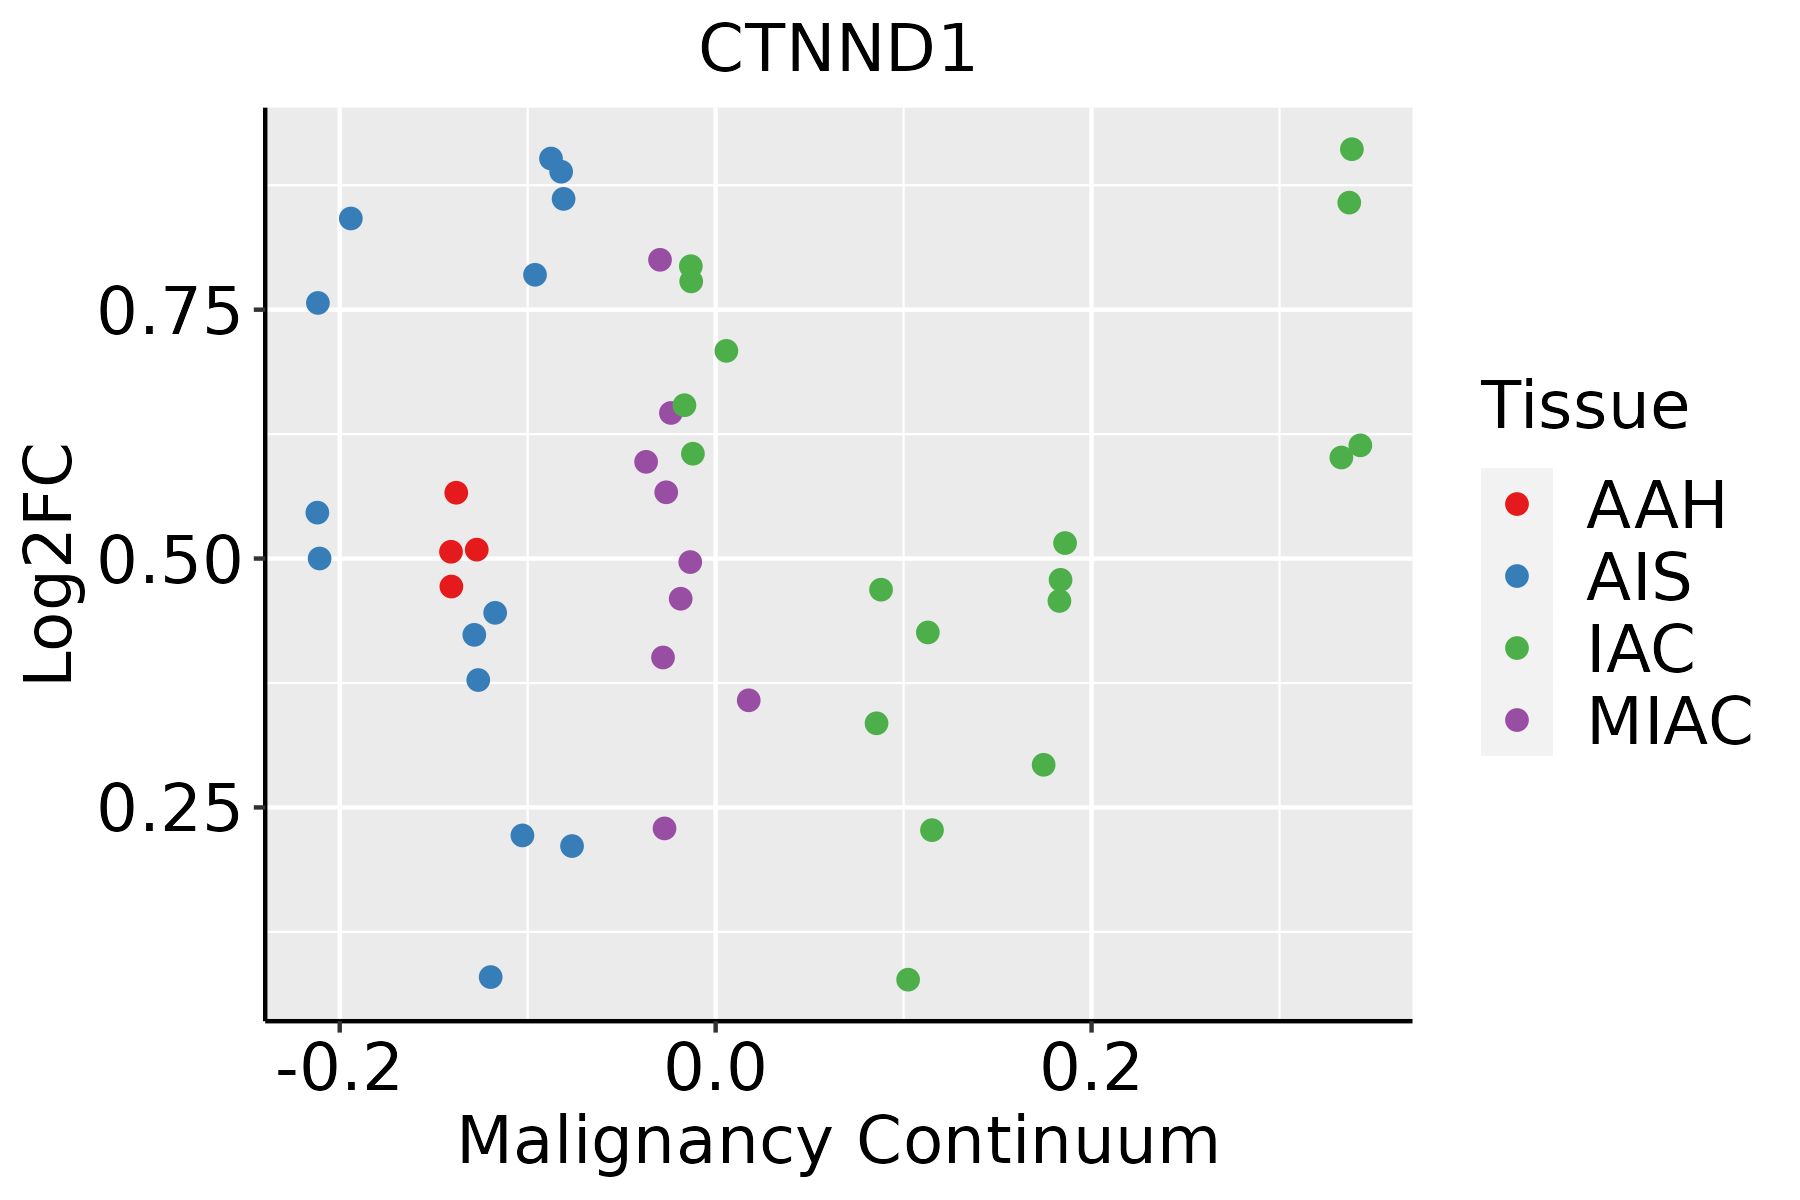 | AAH: Atypical adenomatous hyperplasia |
| AIS: Adenocarcinoma in situ | ||
| IAC: Invasive lung adenocarcinoma | ||
| MIA: Minimally invasive adenocarcinoma | ||
| Oral Cavity |  | EOLP: Erosive Oral lichen planus |
| LP: leukoplakia | ||
| NEOLP: Non-erosive oral lichen planus | ||
| OSCC: Oral squamous cell carcinoma | ||
| Prostate | 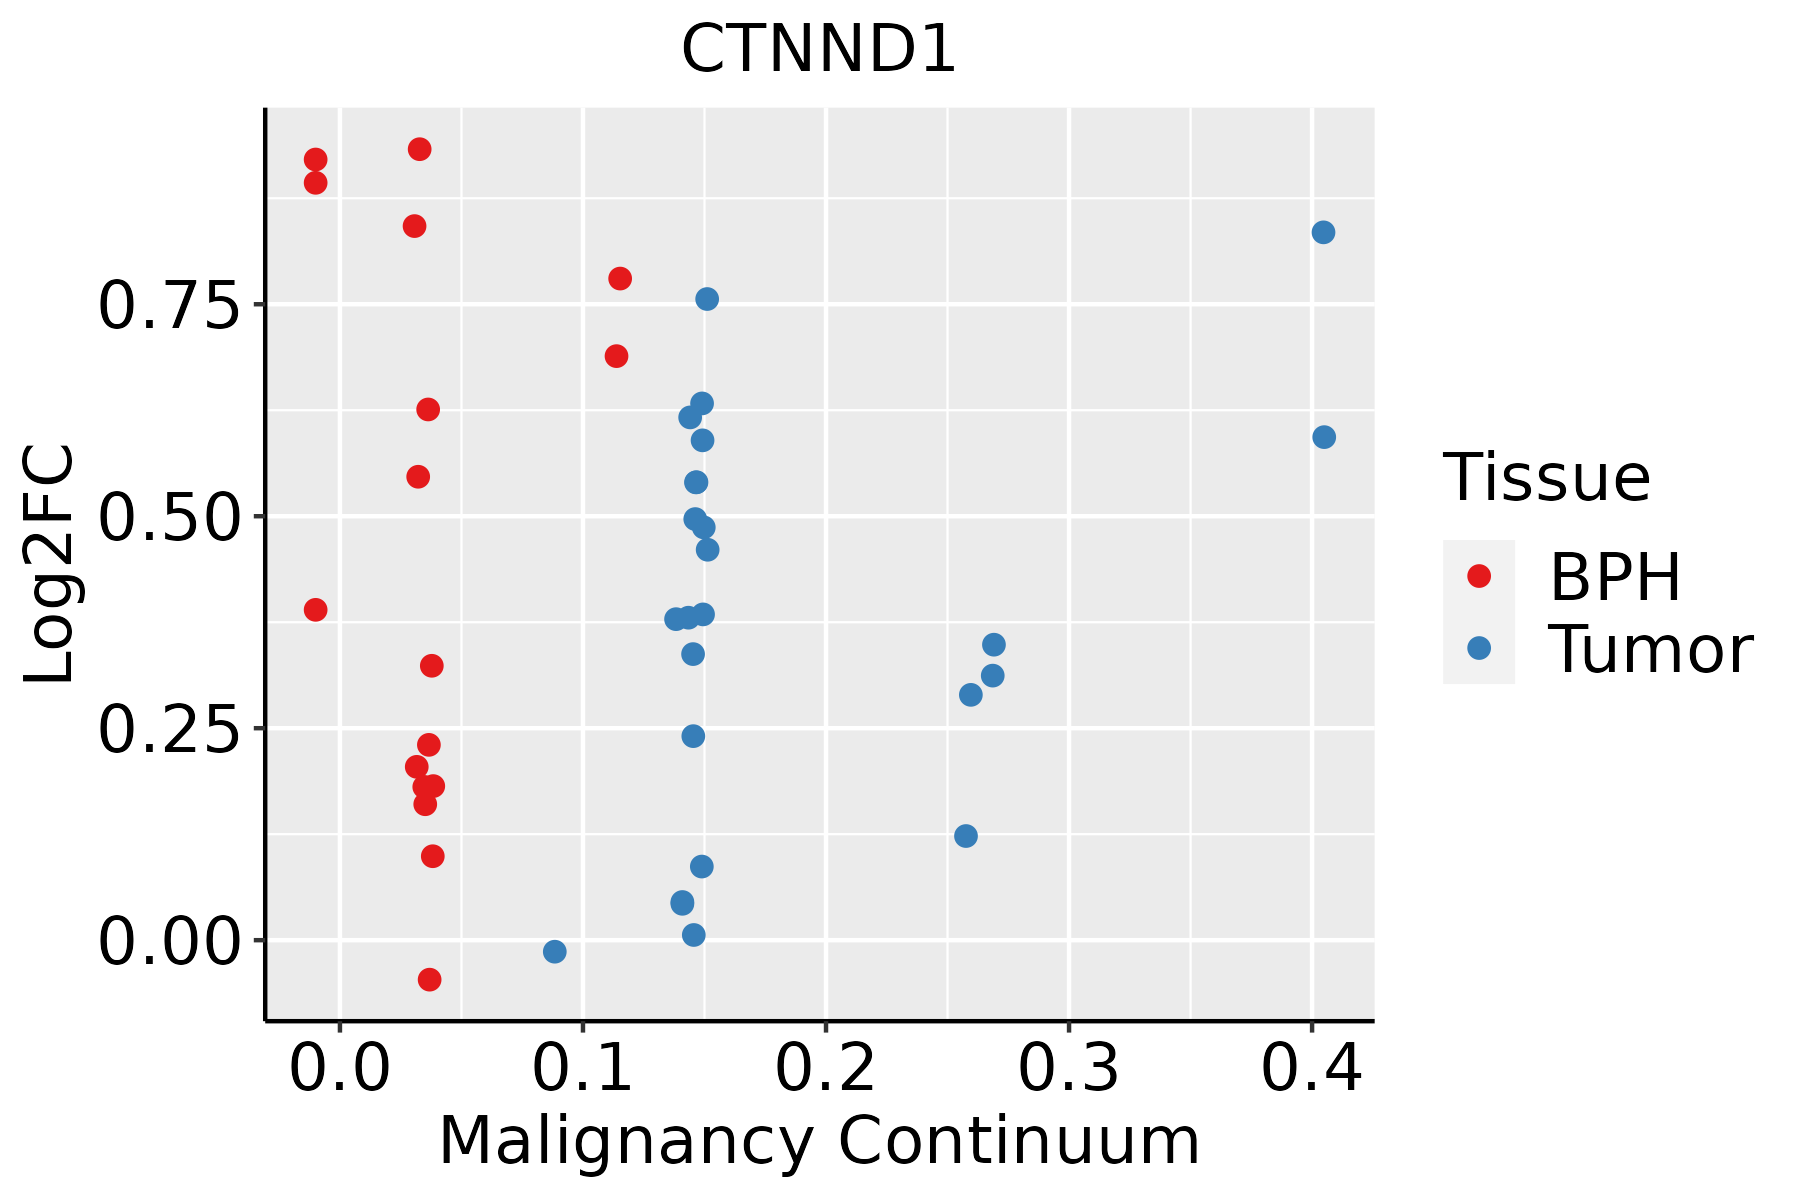 | BPH: Benign Prostatic Hyperplasia |
| Skin | 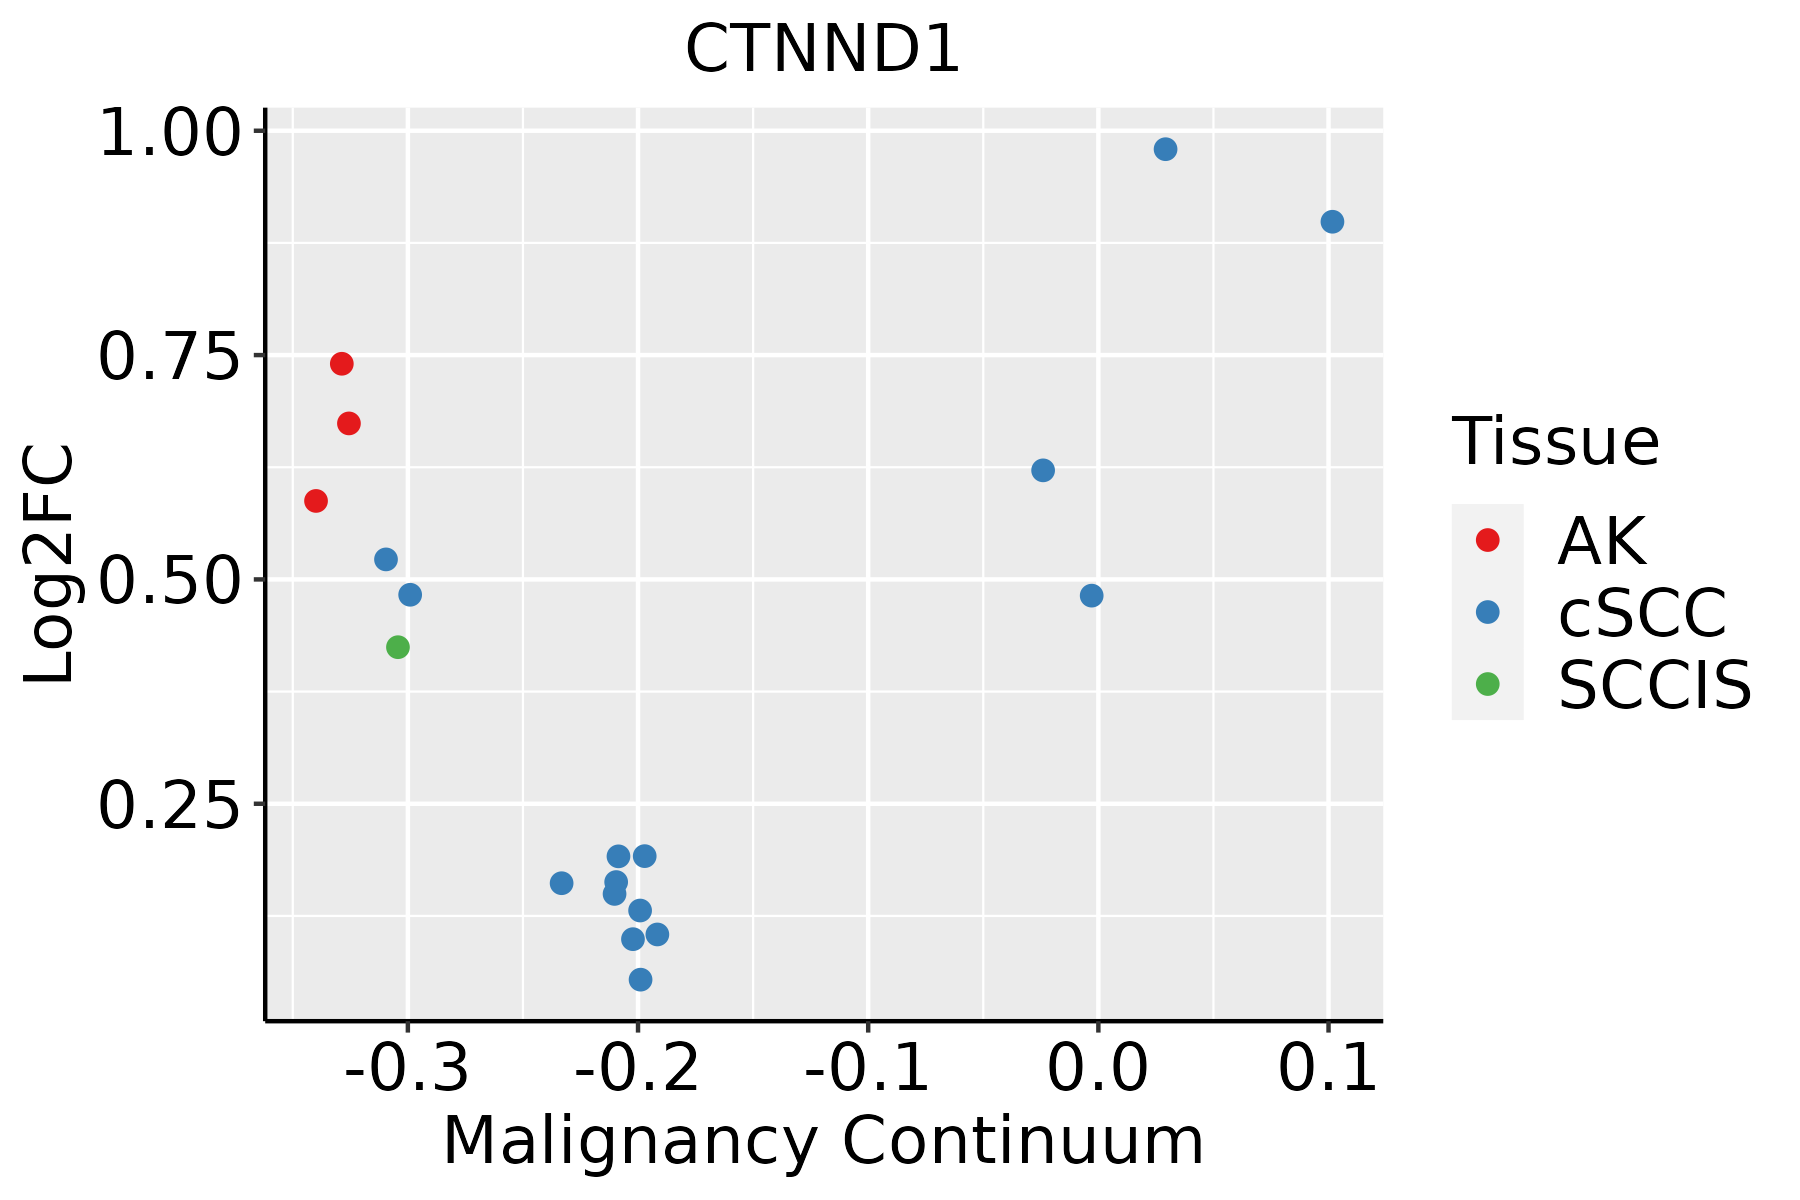 | AK: Actinic keratosis |
| cSCC: Cutaneous squamous cell carcinoma | ||
| SCCIS:squamous cell carcinoma in situ | ||
| Thyroid |  | ATC: Anaplastic thyroid cancer |
| HT: Hashimoto's thyroiditis | ||
| PTC: Papillary thyroid cancer |
| ∗log2FC in expression of this searched gene in stem-like cells from each diseased tissue sample relative to stem-like cells in normal samples in each tissue plotted against the malignancy continuum. Samples are colored based on if they are from different disease stage. |
Top |
Malignant transformation related pathway analysis |
| Find out the enriched GO biological processes and KEGG pathways involved in transition from healthy to precancer to cancer |
| Tissue | Disease Stage | Enriched GO biological Processes |
| Colorectum | AD |  |
| Colorectum | SER |  |
| Colorectum | MSS |  |
| Colorectum | MSI-H |  |
| Colorectum | FAP |  |
| ∗Top 15 enriched GO BP terms are showed in the bar plot of each disease state in each tissue. Each row represents a significant GO biological process which is colored according to the -log10(p.adjust). |
| Page: 1 2 3 4 5 6 7 8 9 |
| GO ID | Tissue | Disease Stage | Description | Gene Ratio | Bg Ratio | pvalue | p.adjust | Count |
| GO:00160557 | Cervix | CC | Wnt signaling pathway | 98/2311 | 444/18723 | 4.82e-09 | 4.65e-07 | 98 |
| GO:01987387 | Cervix | CC | cell-cell signaling by wnt | 98/2311 | 446/18723 | 6.16e-09 | 5.58e-07 | 98 |
| GO:00301117 | Cervix | CC | regulation of Wnt signaling pathway | 76/2311 | 328/18723 | 3.05e-08 | 2.08e-06 | 76 |
| GO:00452169 | Cervix | CC | cell-cell junction organization | 53/2311 | 200/18723 | 3.83e-08 | 2.53e-06 | 53 |
| GO:00343298 | Cervix | CC | cell junction assembly | 88/2311 | 420/18723 | 3.42e-07 | 1.38e-05 | 88 |
| GO:00608287 | Cervix | CC | regulation of canonical Wnt signaling pathway | 58/2311 | 253/18723 | 1.83e-06 | 5.89e-05 | 58 |
| GO:00070439 | Cervix | CC | cell-cell junction assembly | 39/2311 | 146/18723 | 1.86e-06 | 5.94e-05 | 39 |
| GO:00600707 | Cervix | CC | canonical Wnt signaling pathway | 66/2311 | 303/18723 | 2.47e-06 | 7.35e-05 | 66 |
| GO:003164710 | Cervix | CC | regulation of protein stability | 63/2311 | 298/18723 | 1.14e-05 | 2.45e-04 | 63 |
| GO:005082110 | Cervix | CC | protein stabilization | 43/2311 | 191/18723 | 5.90e-05 | 8.54e-04 | 43 |
| GO:00301784 | Cervix | CC | negative regulation of Wnt signaling pathway | 35/2311 | 170/18723 | 1.52e-03 | 1.17e-02 | 35 |
| GO:00900901 | Cervix | CC | negative regulation of canonical Wnt signaling pathway | 29/2311 | 137/18723 | 2.40e-03 | 1.70e-02 | 29 |
| GO:0044331 | Cervix | CC | cell-cell adhesion mediated by cadherin | 9/2311 | 28/18723 | 5.02e-03 | 2.98e-02 | 9 |
| GO:003164715 | Cervix | HSIL_HPV | regulation of protein stability | 31/737 | 298/18723 | 8.69e-07 | 4.19e-05 | 31 |
| GO:004521614 | Cervix | HSIL_HPV | cell-cell junction organization | 23/737 | 200/18723 | 4.21e-06 | 1.69e-04 | 23 |
| GO:000704314 | Cervix | HSIL_HPV | cell-cell junction assembly | 19/737 | 146/18723 | 4.72e-06 | 1.84e-04 | 19 |
| GO:005082115 | Cervix | HSIL_HPV | protein stabilization | 21/737 | 191/18723 | 2.17e-05 | 6.58e-04 | 21 |
| GO:003432913 | Cervix | HSIL_HPV | cell junction assembly | 28/737 | 420/18723 | 4.82e-03 | 3.98e-02 | 28 |
| GO:0045216 | Colorectum | AD | cell-cell junction organization | 80/3918 | 200/18723 | 5.57e-10 | 4.58e-08 | 80 |
| GO:0031647 | Colorectum | AD | regulation of protein stability | 108/3918 | 298/18723 | 6.33e-10 | 5.08e-08 | 108 |
| Page: 1 2 3 4 5 6 7 8 9 10 11 12 13 14 15 |
| Pathway ID | Tissue | Disease Stage | Description | Gene Ratio | Bg Ratio | pvalue | p.adjust | qvalue | Count |
| hsa0452042 | Liver | HCC | Adherens junction | 68/4020 | 93/8465 | 3.99e-07 | 4.46e-06 | 2.48e-06 | 68 |
| hsa0467042 | Liver | HCC | Leukocyte transendothelial migration | 68/4020 | 114/8465 | 5.79e-03 | 1.64e-02 | 9.15e-03 | 68 |
| hsa0452052 | Liver | HCC | Adherens junction | 68/4020 | 93/8465 | 3.99e-07 | 4.46e-06 | 2.48e-06 | 68 |
| hsa0467052 | Liver | HCC | Leukocyte transendothelial migration | 68/4020 | 114/8465 | 5.79e-03 | 1.64e-02 | 9.15e-03 | 68 |
| hsa0452016 | Lung | IAC | Adherens junction | 37/1053 | 93/8465 | 1.99e-11 | 2.16e-09 | 1.43e-09 | 37 |
| hsa0467016 | Lung | IAC | Leukocyte transendothelial migration | 30/1053 | 114/8465 | 4.03e-05 | 6.55e-04 | 4.35e-04 | 30 |
| hsa0401510 | Lung | IAC | Rap1 signaling pathway | 41/1053 | 210/8465 | 2.01e-03 | 1.07e-02 | 7.10e-03 | 41 |
| hsa0452017 | Lung | IAC | Adherens junction | 37/1053 | 93/8465 | 1.99e-11 | 2.16e-09 | 1.43e-09 | 37 |
| hsa0467017 | Lung | IAC | Leukocyte transendothelial migration | 30/1053 | 114/8465 | 4.03e-05 | 6.55e-04 | 4.35e-04 | 30 |
| hsa0401511 | Lung | IAC | Rap1 signaling pathway | 41/1053 | 210/8465 | 2.01e-03 | 1.07e-02 | 7.10e-03 | 41 |
| hsa0452023 | Lung | AIS | Adherens junction | 34/961 | 93/8465 | 1.59e-10 | 1.29e-08 | 8.26e-09 | 34 |
| hsa0467023 | Lung | AIS | Leukocyte transendothelial migration | 29/961 | 114/8465 | 1.92e-05 | 4.08e-04 | 2.61e-04 | 29 |
| hsa0401521 | Lung | AIS | Rap1 signaling pathway | 41/961 | 210/8465 | 3.23e-04 | 3.38e-03 | 2.16e-03 | 41 |
| hsa0452033 | Lung | AIS | Adherens junction | 34/961 | 93/8465 | 1.59e-10 | 1.29e-08 | 8.26e-09 | 34 |
| hsa0467033 | Lung | AIS | Leukocyte transendothelial migration | 29/961 | 114/8465 | 1.92e-05 | 4.08e-04 | 2.61e-04 | 29 |
| hsa0401531 | Lung | AIS | Rap1 signaling pathway | 41/961 | 210/8465 | 3.23e-04 | 3.38e-03 | 2.16e-03 | 41 |
| hsa0452062 | Lung | MIAC | Adherens junction | 27/507 | 93/8465 | 2.36e-12 | 2.29e-10 | 1.66e-10 | 27 |
| hsa0401561 | Lung | MIAC | Rap1 signaling pathway | 29/507 | 210/8465 | 1.94e-05 | 9.40e-04 | 6.80e-04 | 29 |
| hsa0467062 | Lung | MIAC | Leukocyte transendothelial migration | 16/507 | 114/8465 | 1.18e-03 | 1.38e-02 | 9.97e-03 | 16 |
| hsa0452072 | Lung | MIAC | Adherens junction | 27/507 | 93/8465 | 2.36e-12 | 2.29e-10 | 1.66e-10 | 27 |
| Page: 1 2 3 4 5 6 |
Top |
Cell-cell communication analysis |
| Identification of potential cell-cell interactions between two cell types and their ligand-receptor pairs for different disease states |
| Ligand | Receptor | LRpair | Pathway | Tissue | Disease Stage |
| Page: 1 |
Top |
Single-cell gene regulatory network inference analysis |
| Find out the significant the regulons (TFs) and the target genes of each regulon across cell types for different disease states |
| TF | Cell Type | Tissue | Disease Stage | Target Gene | RSS | Regulon Activity |
| ∗The dot plots of a searched regulon are shown for all cell subpopulations in each disease state of each tissue based on the regulon specific score inferred using pySCENIC and by calculating the average expression. |
| Page: 1 |
Top |
Somatic mutation of malignant transformation related genes |
| Annotation of somatic variants for genes involved in malignant transformation |
| Hugo Symbol | Variant Class | Variant Classification | dbSNP RS | HGVSc | HGVSp | HGVSp Short | SWISSPROT | BIOTYPE | SIFT | PolyPhen | Tumor Sample Barcode | Tissue | Histology | Sex | Age | Stage | Therapy Types | Drugs | Outcome |
| CTNND1 | SNV | Missense_Mutation | novel | c.2407G>A | p.Glu803Lys | p.E803K | O60716 | protein_coding | deleterious(0.01) | benign(0.321) | TCGA-3C-AALI-01 | Breast | breast invasive carcinoma | Female | <65 | I/II | Unspecific | Poly E | Complete Response |
| CTNND1 | SNV | Missense_Mutation | c.2734N>A | p.Asp912Asn | p.D912N | O60716 | protein_coding | tolerated(0.12) | benign(0.083) | TCGA-B6-A0RU-01 | Breast | breast invasive carcinoma | Female | <65 | I/II | Unknown | Unknown | PD | |
| CTNND1 | SNV | Missense_Mutation | novel | c.1207N>A | p.Asp403Asn | p.D403N | O60716 | protein_coding | deleterious(0) | possibly_damaging(0.657) | TCGA-BH-A2L8-01 | Breast | breast invasive carcinoma | Female | <65 | I/II | Chemotherapy | cytoxan | CR |
| CTNND1 | SNV | Missense_Mutation | rs760465020 | c.440N>G | p.Thr147Ser | p.T147S | O60716 | protein_coding | tolerated(0.09) | probably_damaging(0.956) | TCGA-C8-A1HM-01 | Breast | breast invasive carcinoma | Female | >=65 | I/II | Chemotherapy | doxorubicin | CR |
| CTNND1 | SNV | Missense_Mutation | c.665N>G | p.Pro222Arg | p.P222R | O60716 | protein_coding | tolerated(0.15) | possibly_damaging(0.578) | TCGA-C8-A1HM-01 | Breast | breast invasive carcinoma | Female | >=65 | I/II | Chemotherapy | doxorubicin | CR | |
| CTNND1 | SNV | Missense_Mutation | rs770665127 | c.790N>T | p.Arg264Trp | p.R264W | O60716 | protein_coding | tolerated(0.17) | probably_damaging(0.913) | TCGA-D8-A1JA-01 | Breast | breast invasive carcinoma | Female | <65 | III/IV | Chemotherapy | adriamycin | PD |
| CTNND1 | insertion | Nonsense_Mutation | novel | c.1566_1567insCATTGCTTATAGTTTTGTTTGTTTT | p.Trp523HisfsTer4 | p.W523Hfs*4 | O60716 | protein_coding | TCGA-A8-A07R-01 | Breast | breast invasive carcinoma | Female | >=65 | III/IV | Ancillary | zoledronic | SD | ||
| CTNND1 | insertion | Frame_Shift_Ins | novel | c.2632_2633insT | p.Lys878IlefsTer4 | p.K878Ifs*4 | O60716 | protein_coding | TCGA-AR-A0U0-01 | Breast | breast invasive carcinoma | Female | >=65 | I/II | Unknown | Unknown | SD | ||
| CTNND1 | insertion | Nonsense_Mutation | novel | c.2633_2634insTTGACACT | p.Lys878AsnfsTer2 | p.K878Nfs*2 | O60716 | protein_coding | TCGA-AR-A0U0-01 | Breast | breast invasive carcinoma | Female | >=65 | I/II | Unknown | Unknown | SD | ||
| CTNND1 | SNV | Missense_Mutation | novel | c.1634N>A | p.Arg545His | p.R545H | O60716 | protein_coding | deleterious(0) | probably_damaging(0.996) | TCGA-2W-A8YY-01 | Cervix | cervical & endocervical cancer | Female | <65 | I/II | Chemotherapy | cisplatin | CR |
| Page: 1 2 3 4 5 6 7 8 9 10 11 12 13 14 15 |
Top |
Related drugs of malignant transformation related genes |
| Identification of chemicals and drugs interact with genes involved in malignant transfromation |
| (DGIdb 4.0) |
| Entrez ID | Symbol | Category | Interaction Types | Drug Claim Name | Drug Name | PMIDs |
| Page: 1 |

Copyright 2023-Present -The University of Texas Health Science Center at Houston |