
|
|||||
|
 | |
| |
| |
| |
| |
| |
|
Gene: ATP6V1E1 |
Gene summary for ATP6V1E1 |
| Gene information | Species | Human | Gene symbol | ATP6V1E1 | Gene ID | 529 |
| Gene name | ATPase H+ transporting V1 subunit E1 | |
| Gene Alias | ARCL2C | |
| Cytomap | 22q11.21 | |
| Gene Type | protein-coding | GO ID | GO:0006810 | UniProtAcc | P36543 |
Top |
Malignant transformation analysis |
| Identification of the aberrant gene expression in precancerous and cancerous lesions by comparing the gene expression of stem-like cells in diseased tissues with normal stem cells |
| Entrez ID | Symbol | Replicates | Species | Organ | Tissue | Adj P-value | Log2FC | Malignancy |
| 529 | ATP6V1E1 | HTA11_3410_2000001011 | Human | Colorectum | AD | 3.29e-02 | 7.66e-02 | 0.0155 |
| 529 | ATP6V1E1 | HTA11_2487_2000001011 | Human | Colorectum | SER | 1.00e-07 | 3.66e-01 | -0.1808 |
| 529 | ATP6V1E1 | HTA11_1938_2000001011 | Human | Colorectum | AD | 3.03e-06 | 4.15e-01 | -0.0811 |
| 529 | ATP6V1E1 | HTA11_78_2000001011 | Human | Colorectum | AD | 1.40e-06 | 3.76e-01 | -0.1088 |
| 529 | ATP6V1E1 | HTA11_347_2000001011 | Human | Colorectum | AD | 2.21e-16 | 4.68e-01 | -0.1954 |
| 529 | ATP6V1E1 | HTA11_411_2000001011 | Human | Colorectum | SER | 1.05e-04 | 8.49e-01 | -0.2602 |
| 529 | ATP6V1E1 | HTA11_3361_2000001011 | Human | Colorectum | AD | 1.88e-06 | 3.18e-01 | -0.1207 |
| 529 | ATP6V1E1 | HTA11_696_2000001011 | Human | Colorectum | AD | 6.94e-03 | 3.18e-01 | -0.1464 |
| 529 | ATP6V1E1 | HTA11_1391_2000001011 | Human | Colorectum | AD | 2.16e-06 | 4.65e-01 | -0.059 |
| 529 | ATP6V1E1 | HTA11_5212_2000001011 | Human | Colorectum | AD | 1.05e-02 | 4.45e-01 | -0.2061 |
| 529 | ATP6V1E1 | HTA11_546_2000001011 | Human | Colorectum | AD | 1.24e-02 | 2.54e-01 | -0.0842 |
| 529 | ATP6V1E1 | HTA11_99999970781_79442 | Human | Colorectum | MSS | 1.12e-04 | 3.79e-01 | 0.294 |
| 529 | ATP6V1E1 | HTA11_99999965104_69814 | Human | Colorectum | MSS | 1.04e-10 | 4.89e-01 | 0.281 |
| 529 | ATP6V1E1 | HTA11_99999971662_82457 | Human | Colorectum | MSS | 5.93e-08 | 5.12e-01 | 0.3859 |
| 529 | ATP6V1E1 | HTA11_99999973899_84307 | Human | Colorectum | MSS | 7.37e-04 | 2.24e-01 | 0.2585 |
| 529 | ATP6V1E1 | A015-C-203 | Human | Colorectum | FAP | 3.66e-02 | -1.18e-01 | -0.1294 |
| 529 | ATP6V1E1 | A015-C-104 | Human | Colorectum | FAP | 4.01e-03 | -8.09e-02 | -0.1899 |
| 529 | ATP6V1E1 | A002-C-116 | Human | Colorectum | FAP | 1.95e-02 | -5.70e-02 | -0.0452 |
| 529 | ATP6V1E1 | LZE4T | Human | Esophagus | ESCC | 3.13e-16 | 4.84e-01 | 0.0811 |
| 529 | ATP6V1E1 | LZE5T | Human | Esophagus | ESCC | 2.66e-04 | 4.35e-01 | 0.0514 |
| Page: 1 2 3 4 5 6 7 8 |
| Tissue | Expression Dynamics | Abbreviation |
| Colorectum (GSE201348) |  | FAP: Familial adenomatous polyposis |
| CRC: Colorectal cancer | ||
| Colorectum (HTA11) |  | AD: Adenomas |
| SER: Sessile serrated lesions | ||
| MSI-H: Microsatellite-high colorectal cancer | ||
| MSS: Microsatellite stable colorectal cancer | ||
| Esophagus | 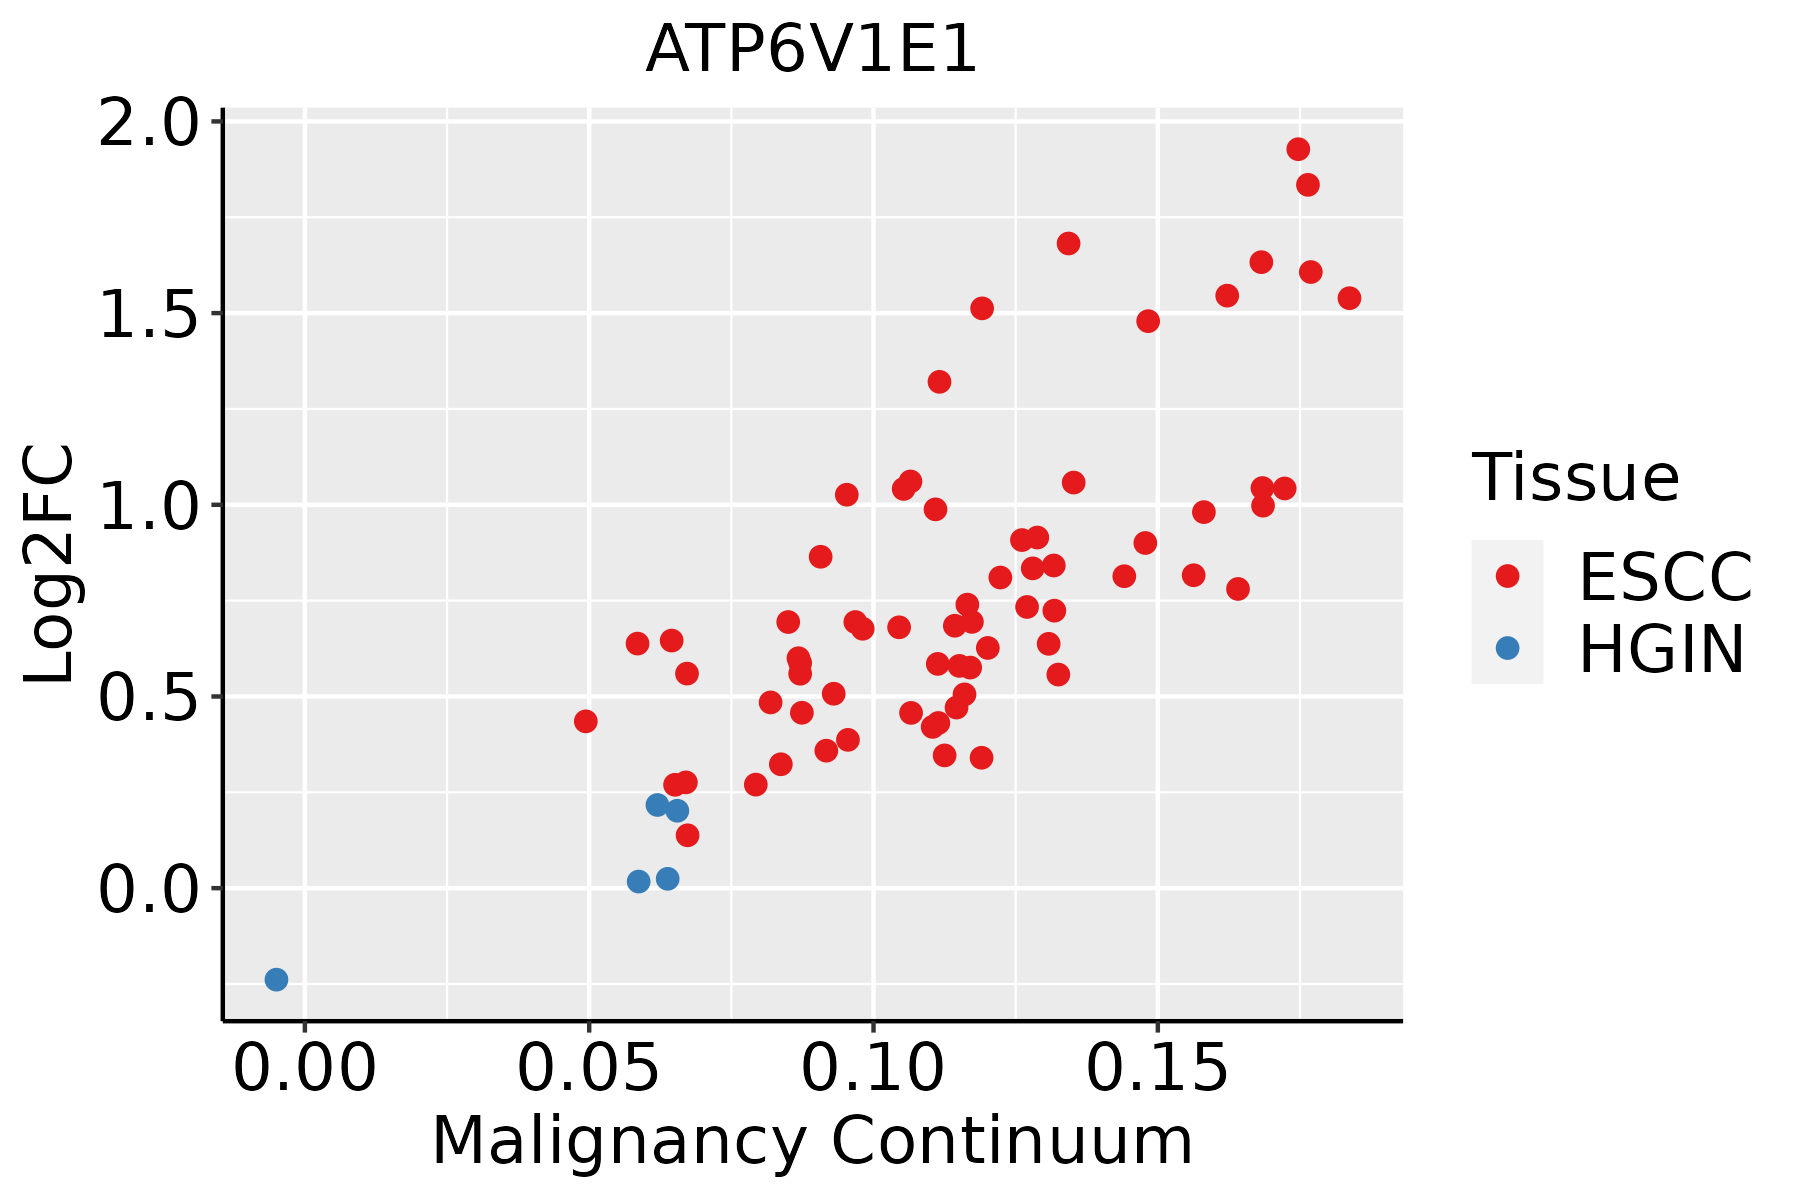 | ESCC: Esophageal squamous cell carcinoma |
| HGIN: High-grade intraepithelial neoplasias | ||
| LGIN: Low-grade intraepithelial neoplasias | ||
| Liver |  | HCC: Hepatocellular carcinoma |
| NAFLD: Non-alcoholic fatty liver disease | ||
| Oral Cavity | 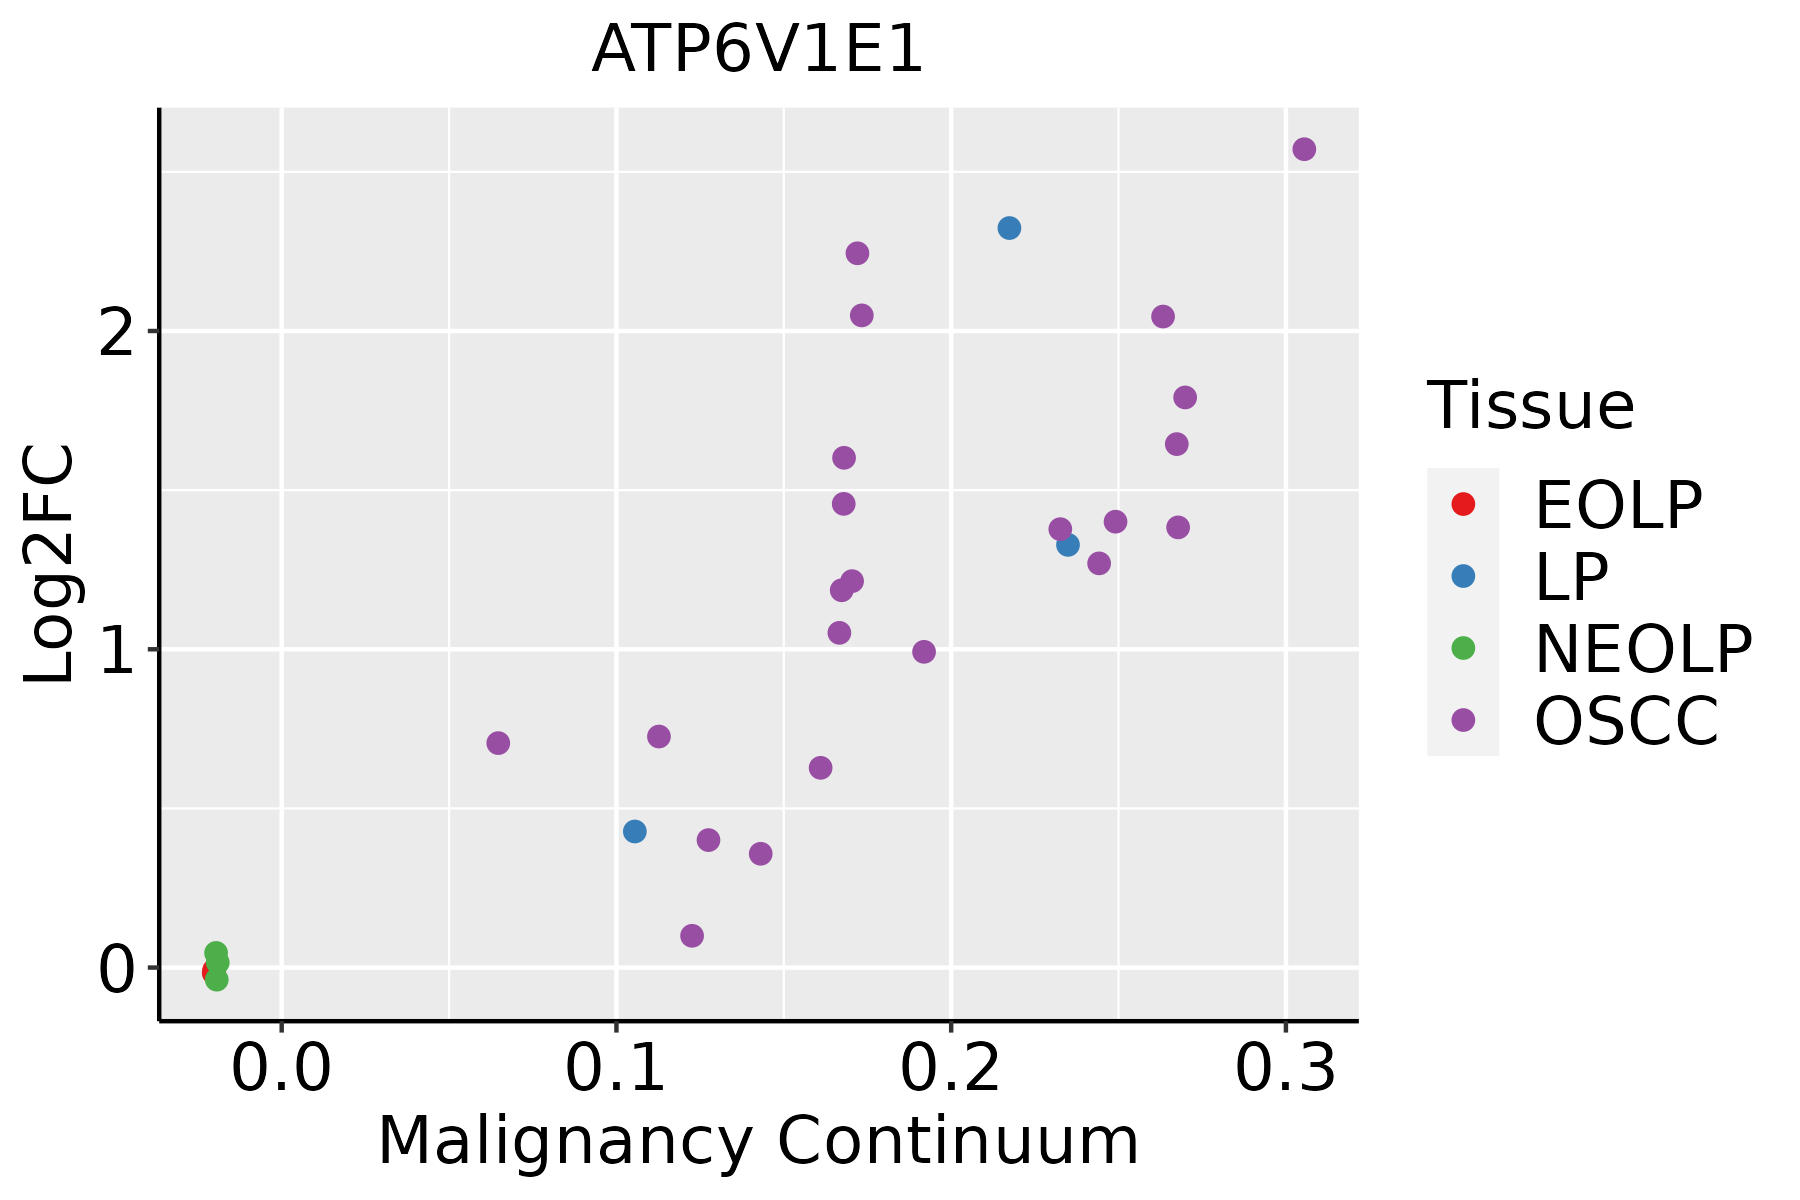 | EOLP: Erosive Oral lichen planus |
| LP: leukoplakia | ||
| NEOLP: Non-erosive oral lichen planus | ||
| OSCC: Oral squamous cell carcinoma | ||
| Prostate | 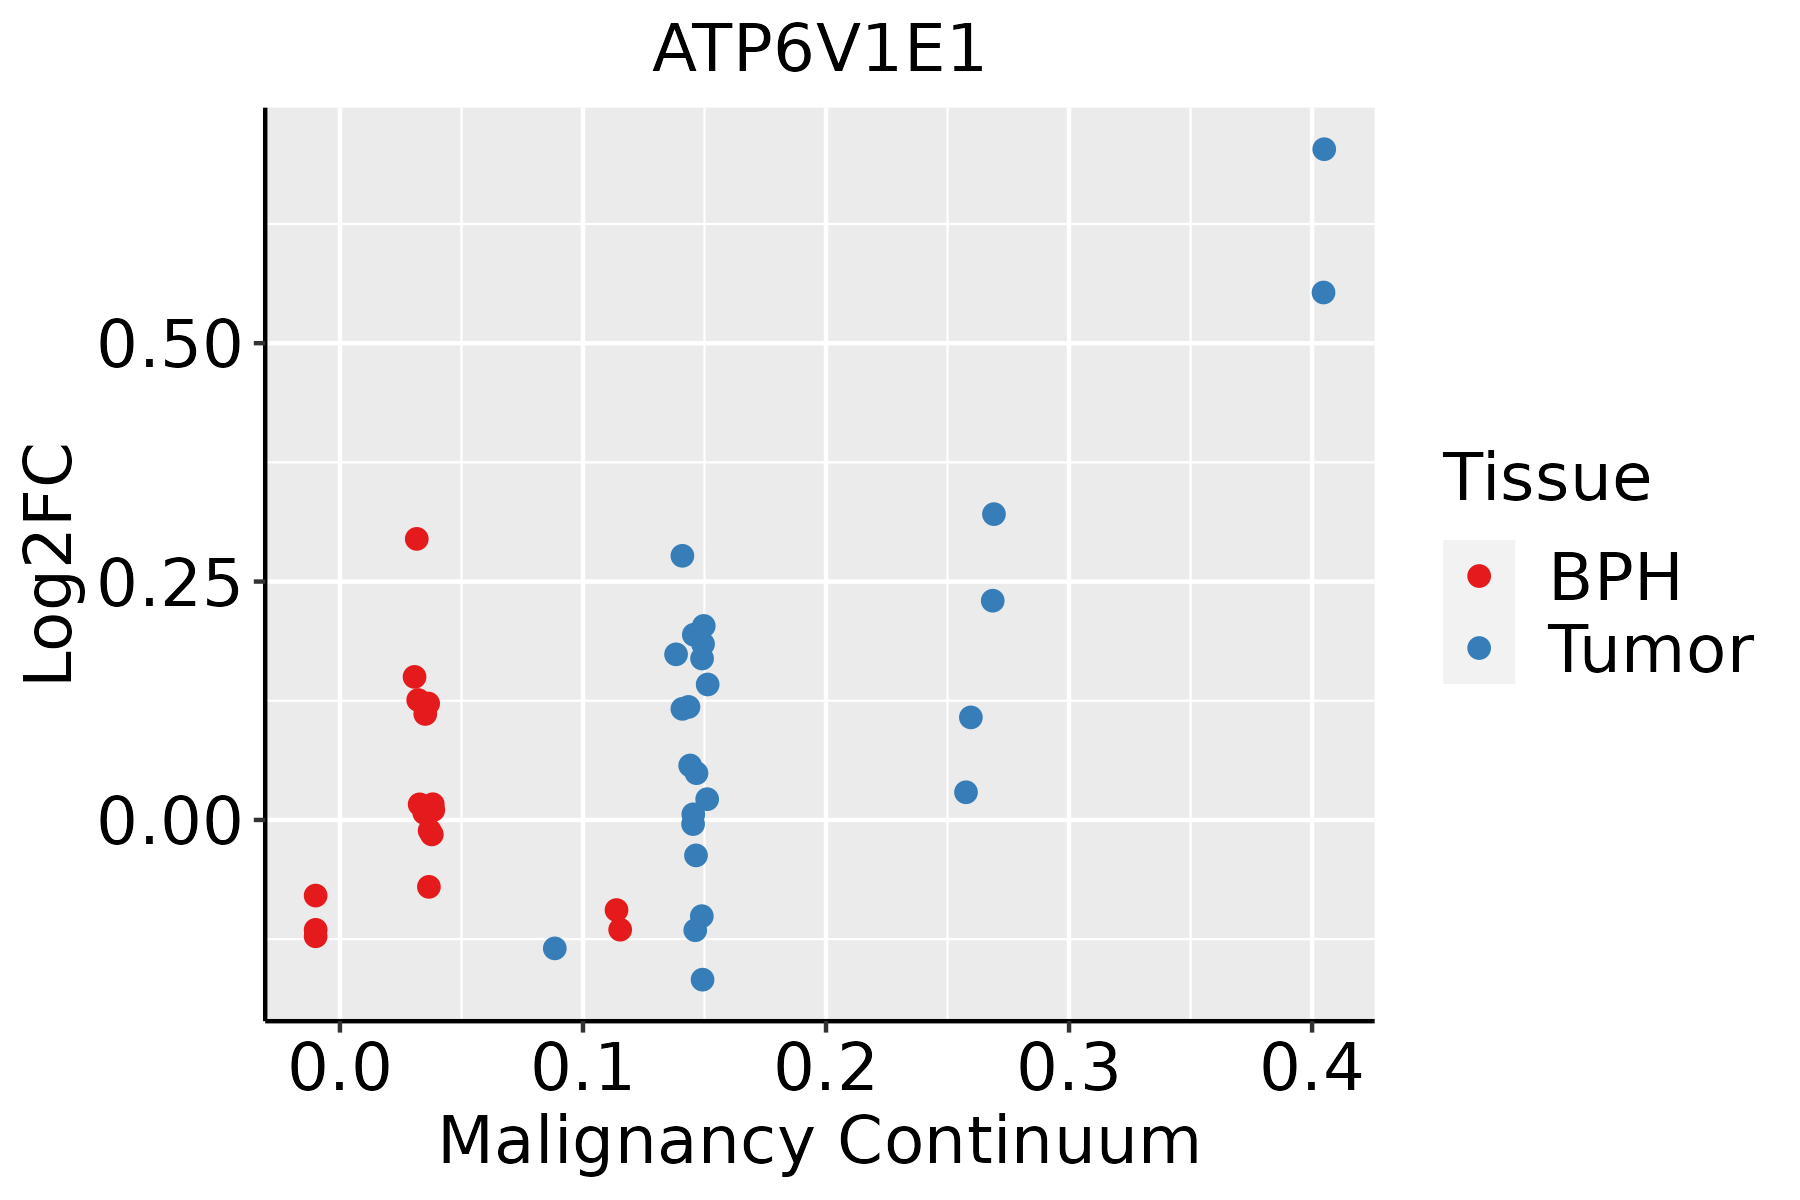 | BPH: Benign Prostatic Hyperplasia |
| Skin | 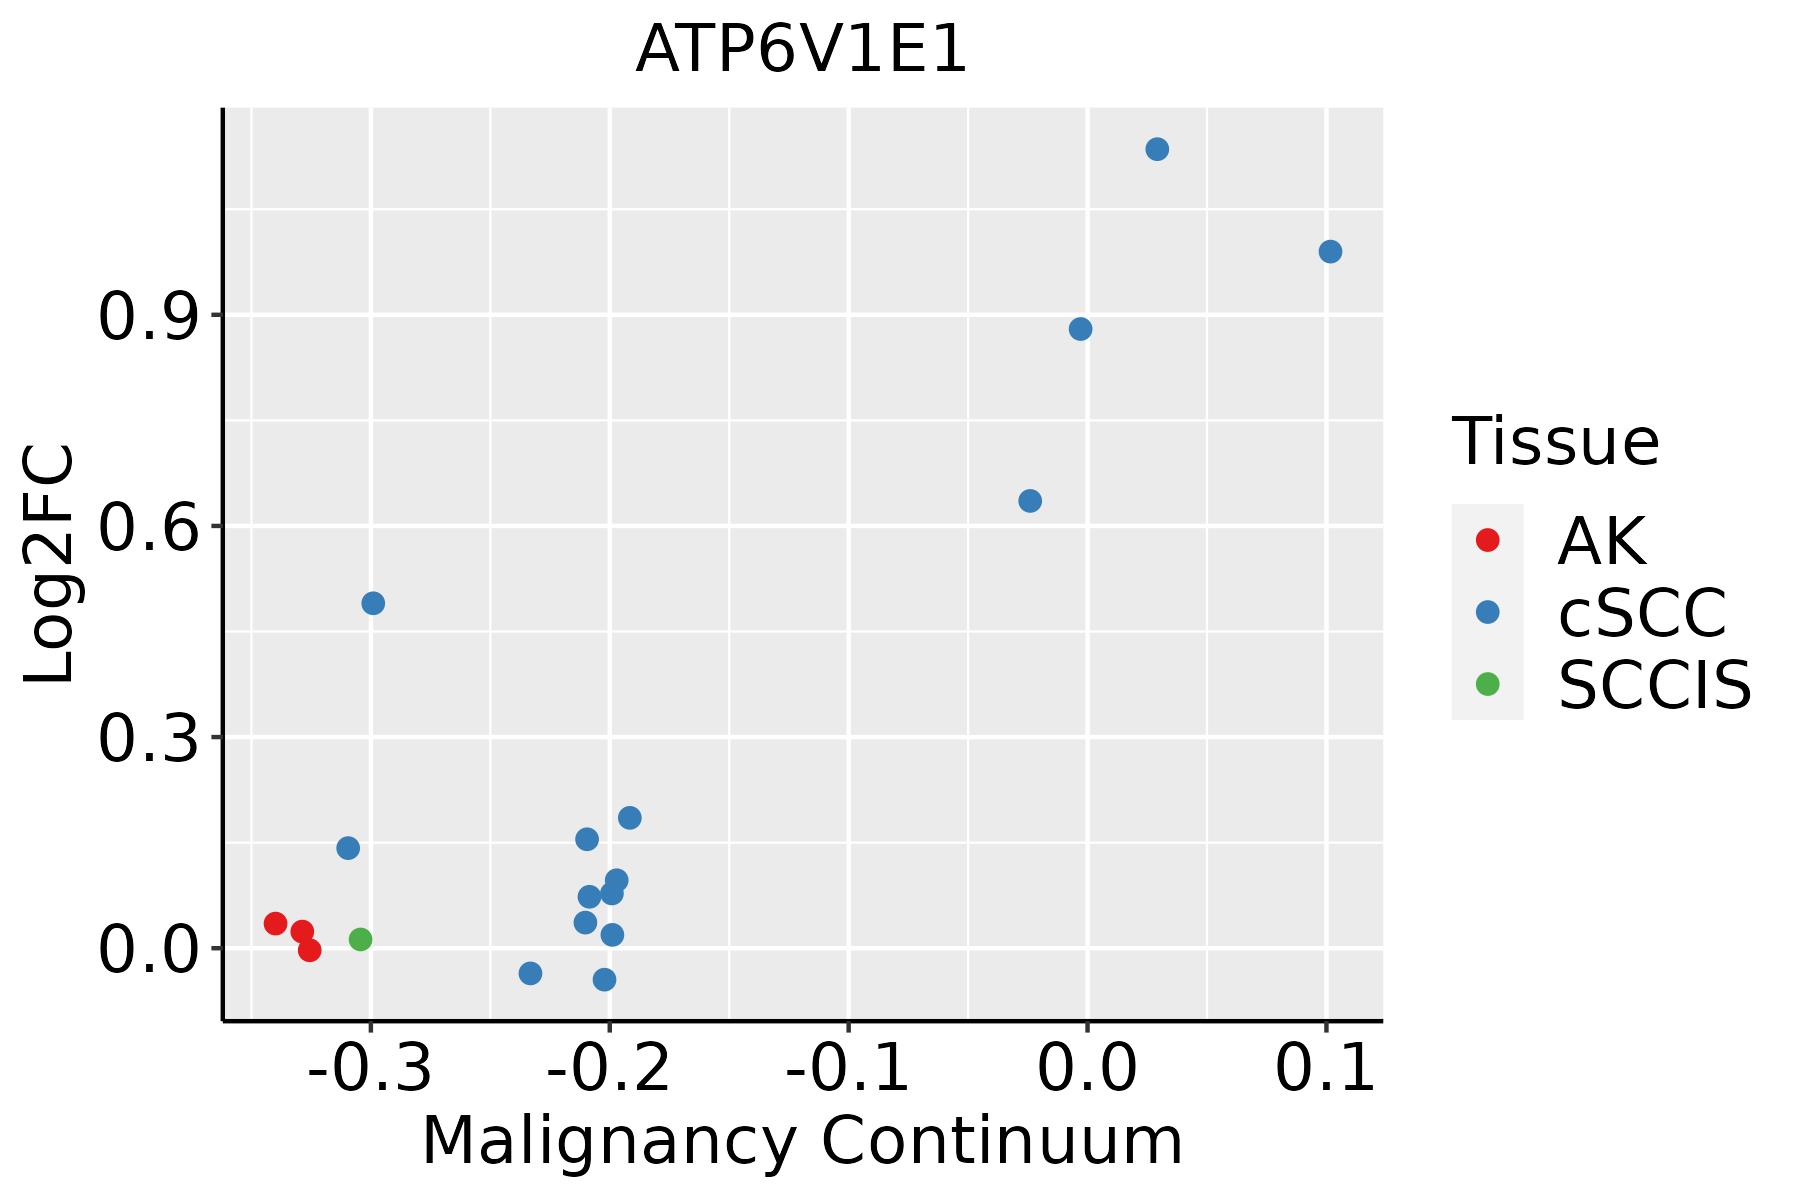 | AK: Actinic keratosis |
| cSCC: Cutaneous squamous cell carcinoma | ||
| SCCIS:squamous cell carcinoma in situ | ||
| Thyroid | 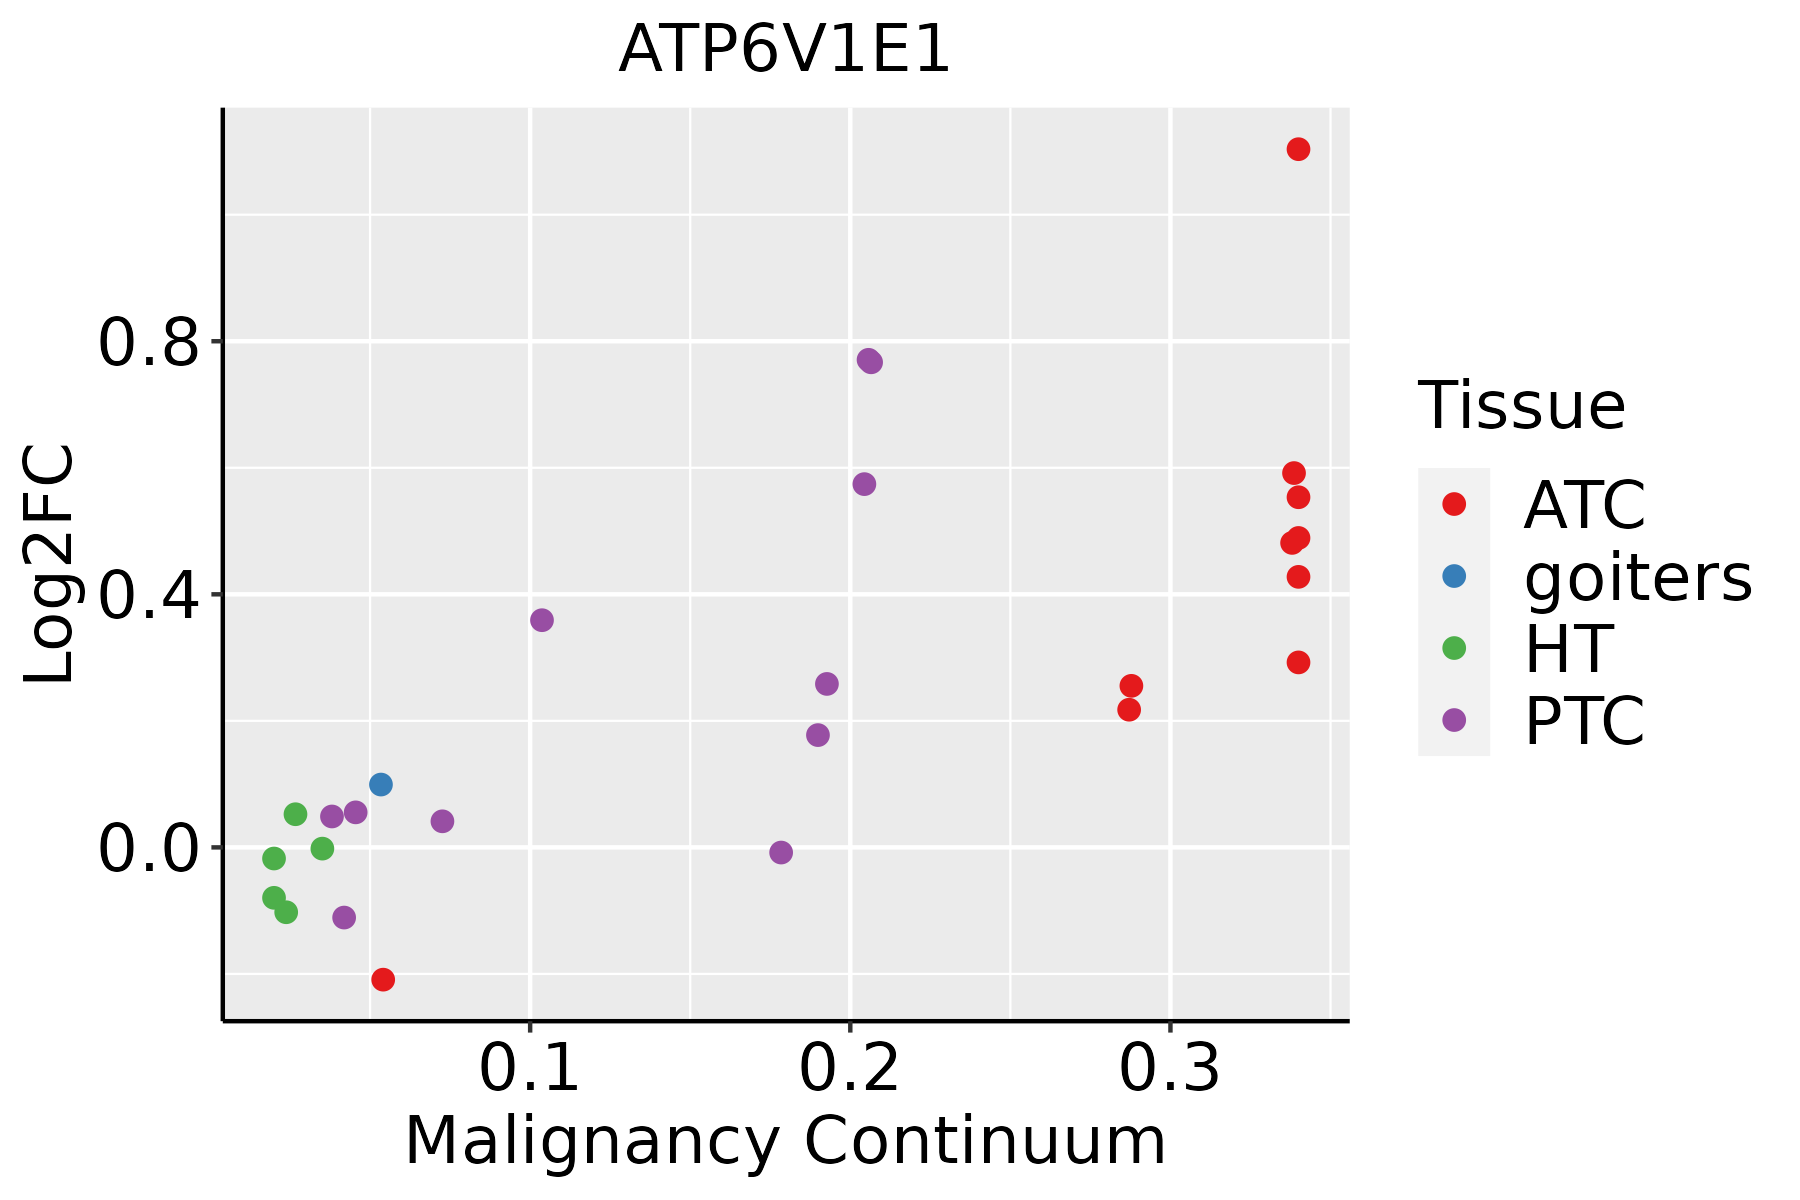 | ATC: Anaplastic thyroid cancer |
| HT: Hashimoto's thyroiditis | ||
| PTC: Papillary thyroid cancer |
| ∗log2FC in expression of this searched gene in stem-like cells from each diseased tissue sample relative to stem-like cells in normal samples in each tissue plotted against the malignancy continuum. Samples are colored based on if they are from different disease stage. |
Top |
Malignant transformation related pathway analysis |
| Find out the enriched GO biological processes and KEGG pathways involved in transition from healthy to precancer to cancer |
| Tissue | Disease Stage | Enriched GO biological Processes |
| Colorectum | AD |  |
| Colorectum | SER |  |
| Colorectum | MSS |  |
| Colorectum | MSI-H |  |
| Colorectum | FAP |  |
| ∗Top 15 enriched GO BP terms are showed in the bar plot of each disease state in each tissue. Each row represents a significant GO biological process which is colored according to the -log10(p.adjust). |
| Page: 1 2 3 4 5 6 7 8 9 |
| GO ID | Tissue | Disease Stage | Description | Gene Ratio | Bg Ratio | pvalue | p.adjust | Count |
| GO:1902600 | Colorectum | AD | proton transmembrane transport | 66/3918 | 157/18723 | 1.59e-09 | 1.17e-07 | 66 |
| GO:0010506 | Colorectum | AD | regulation of autophagy | 111/3918 | 317/18723 | 3.57e-09 | 2.35e-07 | 111 |
| GO:0016236 | Colorectum | AD | macroautophagy | 103/3918 | 291/18723 | 6.76e-09 | 4.15e-07 | 103 |
| GO:0016241 | Colorectum | AD | regulation of macroautophagy | 50/3918 | 141/18723 | 4.55e-05 | 7.92e-04 | 50 |
| GO:19026001 | Colorectum | SER | proton transmembrane transport | 60/2897 | 157/18723 | 3.12e-12 | 7.08e-10 | 60 |
| GO:00162361 | Colorectum | SER | macroautophagy | 79/2897 | 291/18723 | 1.97e-07 | 1.10e-05 | 79 |
| GO:00105061 | Colorectum | SER | regulation of autophagy | 74/2897 | 317/18723 | 1.39e-04 | 2.77e-03 | 74 |
| GO:00162411 | Colorectum | SER | regulation of macroautophagy | 34/2897 | 141/18723 | 4.74e-03 | 3.72e-02 | 34 |
| GO:00162362 | Colorectum | MSS | macroautophagy | 93/3467 | 291/18723 | 2.08e-08 | 1.17e-06 | 93 |
| GO:19026002 | Colorectum | MSS | proton transmembrane transport | 57/3467 | 157/18723 | 1.00e-07 | 4.81e-06 | 57 |
| GO:00105062 | Colorectum | MSS | regulation of autophagy | 95/3467 | 317/18723 | 4.36e-07 | 1.71e-05 | 95 |
| GO:00162412 | Colorectum | MSS | regulation of macroautophagy | 44/3467 | 141/18723 | 1.88e-04 | 2.64e-03 | 44 |
| GO:00105063 | Colorectum | FAP | regulation of autophagy | 80/2622 | 317/18723 | 6.43e-08 | 4.54e-06 | 80 |
| GO:00162363 | Colorectum | FAP | macroautophagy | 70/2622 | 291/18723 | 2.73e-06 | 1.02e-04 | 70 |
| GO:00162413 | Colorectum | FAP | regulation of macroautophagy | 38/2622 | 141/18723 | 3.78e-05 | 8.13e-04 | 38 |
| GO:19026004 | Colorectum | FAP | proton transmembrane transport | 39/2622 | 157/18723 | 2.03e-04 | 2.92e-03 | 39 |
| GO:001050616 | Esophagus | HGIN | regulation of autophagy | 84/2587 | 317/18723 | 1.39e-09 | 1.08e-07 | 84 |
| GO:001623616 | Esophagus | HGIN | macroautophagy | 77/2587 | 291/18723 | 7.15e-09 | 4.61e-07 | 77 |
| GO:190260017 | Esophagus | HGIN | proton transmembrane transport | 43/2587 | 157/18723 | 5.51e-06 | 1.75e-04 | 43 |
| GO:00162418 | Esophagus | HGIN | regulation of macroautophagy | 38/2587 | 141/18723 | 2.80e-05 | 7.21e-04 | 38 |
| Page: 1 2 3 |
| Pathway ID | Tissue | Disease Stage | Description | Gene Ratio | Bg Ratio | pvalue | p.adjust | qvalue | Count |
| hsa0512010 | Oral cavity | OSCC | Epithelial cell signaling in Helicobacter pylori infection | 49/3704 | 70/8465 | 7.57e-06 | 3.59e-05 | 1.83e-05 | 49 |
| hsa0414528 | Oral cavity | OSCC | Phagosome | 88/3704 | 152/8465 | 2.83e-04 | 9.13e-04 | 4.65e-04 | 88 |
| hsa041504 | Oral cavity | OSCC | mTOR signaling pathway | 90/3704 | 156/8465 | 2.87e-04 | 9.15e-04 | 4.66e-04 | 90 |
| hsa0532318 | Oral cavity | OSCC | Rheumatoid arthritis | 56/3704 | 93/8465 | 9.72e-04 | 2.76e-03 | 1.40e-03 | 56 |
| hsa0511026 | Oral cavity | OSCC | Vibrio cholerae infection | 32/3704 | 50/8465 | 3.05e-03 | 7.74e-03 | 3.94e-03 | 32 |
| hsa0516514 | Oral cavity | OSCC | Human papillomavirus infection | 200/3704 | 331/8465 | 3.83e-10 | 4.93e-09 | 2.51e-09 | 200 |
| hsa00190112 | Oral cavity | OSCC | Oxidative phosphorylation | 88/3704 | 134/8465 | 2.15e-07 | 1.44e-06 | 7.32e-07 | 88 |
| hsa0512017 | Oral cavity | OSCC | Epithelial cell signaling in Helicobacter pylori infection | 49/3704 | 70/8465 | 7.57e-06 | 3.59e-05 | 1.83e-05 | 49 |
| hsa04145113 | Oral cavity | OSCC | Phagosome | 88/3704 | 152/8465 | 2.83e-04 | 9.13e-04 | 4.65e-04 | 88 |
| hsa0415012 | Oral cavity | OSCC | mTOR signaling pathway | 90/3704 | 156/8465 | 2.87e-04 | 9.15e-04 | 4.66e-04 | 90 |
| hsa0532319 | Oral cavity | OSCC | Rheumatoid arthritis | 56/3704 | 93/8465 | 9.72e-04 | 2.76e-03 | 1.40e-03 | 56 |
| hsa05110111 | Oral cavity | OSCC | Vibrio cholerae infection | 32/3704 | 50/8465 | 3.05e-03 | 7.74e-03 | 3.94e-03 | 32 |
| hsa0019029 | Oral cavity | LP | Oxidative phosphorylation | 81/2418 | 134/8465 | 9.58e-15 | 2.45e-13 | 1.58e-13 | 81 |
| hsa0414529 | Oral cavity | LP | Phagosome | 73/2418 | 152/8465 | 2.37e-07 | 3.29e-06 | 2.12e-06 | 73 |
| hsa0512024 | Oral cavity | LP | Epithelial cell signaling in Helicobacter pylori infection | 38/2418 | 70/8465 | 5.17e-06 | 4.20e-05 | 2.71e-05 | 38 |
| hsa0516523 | Oral cavity | LP | Human papillomavirus infection | 121/2418 | 331/8465 | 8.00e-04 | 3.86e-03 | 2.49e-03 | 121 |
| hsa0511027 | Oral cavity | LP | Vibrio cholerae infection | 25/2418 | 50/8465 | 1.07e-03 | 4.90e-03 | 3.16e-03 | 25 |
| hsa0019037 | Oral cavity | LP | Oxidative phosphorylation | 81/2418 | 134/8465 | 9.58e-15 | 2.45e-13 | 1.58e-13 | 81 |
| hsa0414536 | Oral cavity | LP | Phagosome | 73/2418 | 152/8465 | 2.37e-07 | 3.29e-06 | 2.12e-06 | 73 |
| hsa0512034 | Oral cavity | LP | Epithelial cell signaling in Helicobacter pylori infection | 38/2418 | 70/8465 | 5.17e-06 | 4.20e-05 | 2.71e-05 | 38 |
| Page: 1 2 3 4 5 |
Top |
Cell-cell communication analysis |
| Identification of potential cell-cell interactions between two cell types and their ligand-receptor pairs for different disease states |
| Ligand | Receptor | LRpair | Pathway | Tissue | Disease Stage |
| Page: 1 |
Top |
Single-cell gene regulatory network inference analysis |
| Find out the significant the regulons (TFs) and the target genes of each regulon across cell types for different disease states |
| TF | Cell Type | Tissue | Disease Stage | Target Gene | RSS | Regulon Activity |
| ∗The dot plots of a searched regulon are shown for all cell subpopulations in each disease state of each tissue based on the regulon specific score inferred using pySCENIC and by calculating the average expression. |
| Page: 1 |
Top |
Somatic mutation of malignant transformation related genes |
| Annotation of somatic variants for genes involved in malignant transformation |
| Hugo Symbol | Variant Class | Variant Classification | dbSNP RS | HGVSc | HGVSp | HGVSp Short | SWISSPROT | BIOTYPE | SIFT | PolyPhen | Tumor Sample Barcode | Tissue | Histology | Sex | Age | Stage | Therapy Types | Drugs | Outcome |
| ATP6V1E1 | SNV | Missense_Mutation | novel | c.640G>T | p.Ala214Ser | p.A214S | P36543 | protein_coding | tolerated(0.12) | benign(0.014) | TCGA-D8-A27M-01 | Breast | breast invasive carcinoma | Female | <65 | I/II | Chemotherapy | methotrexate+5 | SD |
| ATP6V1E1 | SNV | Missense_Mutation | novel | c.562N>T | p.Arg188Cys | p.R188C | P36543 | protein_coding | deleterious(0.03) | benign(0.022) | TCGA-E9-A22G-01 | Breast | breast invasive carcinoma | Female | <65 | I/II | Chemotherapy | doxorubicin | SD |
| ATP6V1E1 | SNV | Missense_Mutation | novel | c.17N>T | p.Ala6Val | p.A6V | P36543 | protein_coding | tolerated(0.22) | benign(0.007) | TCGA-VS-A94Z-01 | Cervix | cervical & endocervical cancer | Female | <65 | I/II | Chemotherapy | cisplatin | CR |
| ATP6V1E1 | SNV | Missense_Mutation | novel | c.562N>T | p.Arg188Cys | p.R188C | P36543 | protein_coding | deleterious(0.03) | benign(0.022) | TCGA-AA-3495-01 | Colorectum | colon adenocarcinoma | Male | >=65 | I/II | Unknown | Unknown | SD |
| ATP6V1E1 | SNV | Missense_Mutation | c.202N>G | p.Lys68Glu | p.K68E | P36543 | protein_coding | deleterious(0) | benign(0.394) | TCGA-AA-A010-01 | Colorectum | colon adenocarcinoma | Female | <65 | I/II | Chemotherapy | folinic | CR | |
| ATP6V1E1 | SNV | Missense_Mutation | novel | c.562N>A | p.Arg188Ser | p.R188S | P36543 | protein_coding | tolerated(0.11) | benign(0.03) | TCGA-D5-6530-01 | Colorectum | colon adenocarcinoma | Male | <65 | I/II | Unknown | Unknown | SD |
| ATP6V1E1 | SNV | Missense_Mutation | c.228G>A | p.Met76Ile | p.M76I | P36543 | protein_coding | tolerated(0.17) | benign(0.012) | TCGA-AJ-A23M-01 | Endometrium | uterine corpus endometrioid carcinoma | Female | <65 | I/II | Chemotherapy | unknown | PD | |
| ATP6V1E1 | SNV | Missense_Mutation | rs144829775 | c.392G>A | p.Arg131Gln | p.R131Q | P36543 | protein_coding | tolerated(0.48) | benign(0) | TCGA-AP-A056-01 | Endometrium | uterine corpus endometrioid carcinoma | Female | <65 | I/II | Unknown | Unknown | SD |
| ATP6V1E1 | SNV | Missense_Mutation | novel | c.545A>T | p.Glu182Val | p.E182V | P36543 | protein_coding | deleterious(0.04) | benign(0.145) | TCGA-AP-A0LM-01 | Endometrium | uterine corpus endometrioid carcinoma | Female | <65 | III/IV | Chemotherapy | cisplatin | SD |
| ATP6V1E1 | SNV | Missense_Mutation | c.27A>C | p.Gln9His | p.Q9H | P36543 | protein_coding | deleterious(0.02) | benign(0.443) | TCGA-AX-A0J0-01 | Endometrium | uterine corpus endometrioid carcinoma | Female | <65 | I/II | Unknown | Unknown | SD |
| Page: 1 2 |
Top |
Related drugs of malignant transformation related genes |
| Identification of chemicals and drugs interact with genes involved in malignant transfromation |
| (DGIdb 4.0) |
| Entrez ID | Symbol | Category | Interaction Types | Drug Claim Name | Drug Name | PMIDs |
| Page: 1 |

Copyright 2023-Present -The University of Texas Health Science Center at Houston |