
|
|||||
|
 | |
| |
| |
| |
| |
| |
|
Gene: ACOX1 |
Gene summary for ACOX1 |
| Gene information | Species | Human | Gene symbol | ACOX1 | Gene ID | 51 |
| Gene name | acyl-CoA oxidase 1 | |
| Gene Alias | ACOX | |
| Cytomap | 17q25.1 | |
| Gene Type | protein-coding | GO ID | GO:0000003 | UniProtAcc | Q15067 |
Top |
Malignant transformation analysis |
| Identification of the aberrant gene expression in precancerous and cancerous lesions by comparing the gene expression of stem-like cells in diseased tissues with normal stem cells |
| Entrez ID | Symbol | Replicates | Species | Organ | Tissue | Adj P-value | Log2FC | Malignancy |
| 51 | ACOX1 | HTA11_2487_2000001011 | Human | Colorectum | SER | 1.13e-06 | 6.12e-01 | -0.1808 |
| 51 | ACOX1 | HTA11_1938_2000001011 | Human | Colorectum | AD | 1.65e-08 | 5.83e-01 | -0.0811 |
| 51 | ACOX1 | HTA11_78_2000001011 | Human | Colorectum | AD | 3.34e-05 | 5.94e-01 | -0.1088 |
| 51 | ACOX1 | HTA11_347_2000001011 | Human | Colorectum | AD | 1.13e-30 | 9.53e-01 | -0.1954 |
| 51 | ACOX1 | HTA11_3361_2000001011 | Human | Colorectum | AD | 6.97e-05 | 6.31e-01 | -0.1207 |
| 51 | ACOX1 | HTA11_83_2000001011 | Human | Colorectum | SER | 7.99e-05 | 6.83e-01 | -0.1526 |
| 51 | ACOX1 | HTA11_696_2000001011 | Human | Colorectum | AD | 3.29e-09 | 5.58e-01 | -0.1464 |
| 51 | ACOX1 | HTA11_866_2000001011 | Human | Colorectum | AD | 2.58e-07 | 5.10e-01 | -0.1001 |
| 51 | ACOX1 | HTA11_1391_2000001011 | Human | Colorectum | AD | 1.68e-05 | 5.52e-01 | -0.059 |
| 51 | ACOX1 | HTA11_5212_2000001011 | Human | Colorectum | AD | 1.14e-04 | 6.24e-01 | -0.2061 |
| 51 | ACOX1 | HTA11_99999971662_82457 | Human | Colorectum | MSS | 3.20e-05 | 4.15e-01 | 0.3859 |
| 51 | ACOX1 | A015-C-203 | Human | Colorectum | FAP | 1.63e-08 | -1.28e-01 | -0.1294 |
| 51 | ACOX1 | A001-C-108 | Human | Colorectum | FAP | 1.21e-02 | -9.49e-02 | -0.0272 |
| 51 | ACOX1 | A002-C-205 | Human | Colorectum | FAP | 7.26e-06 | -1.64e-01 | -0.1236 |
| 51 | ACOX1 | A015-C-006 | Human | Colorectum | FAP | 4.87e-04 | -2.15e-01 | -0.0994 |
| 51 | ACOX1 | A002-C-114 | Human | Colorectum | FAP | 1.51e-03 | -7.93e-02 | -0.1561 |
| 51 | ACOX1 | A015-C-104 | Human | Colorectum | FAP | 2.14e-06 | -1.73e-01 | -0.1899 |
| 51 | ACOX1 | A001-C-014 | Human | Colorectum | FAP | 2.99e-02 | -1.49e-01 | 0.0135 |
| 51 | ACOX1 | A002-C-016 | Human | Colorectum | FAP | 1.18e-07 | -1.16e-01 | 0.0521 |
| 51 | ACOX1 | A015-C-002 | Human | Colorectum | FAP | 3.41e-03 | -2.27e-01 | -0.0763 |
| Page: 1 2 3 4 5 6 |
| Tissue | Expression Dynamics | Abbreviation |
| Colorectum (GSE201348) | 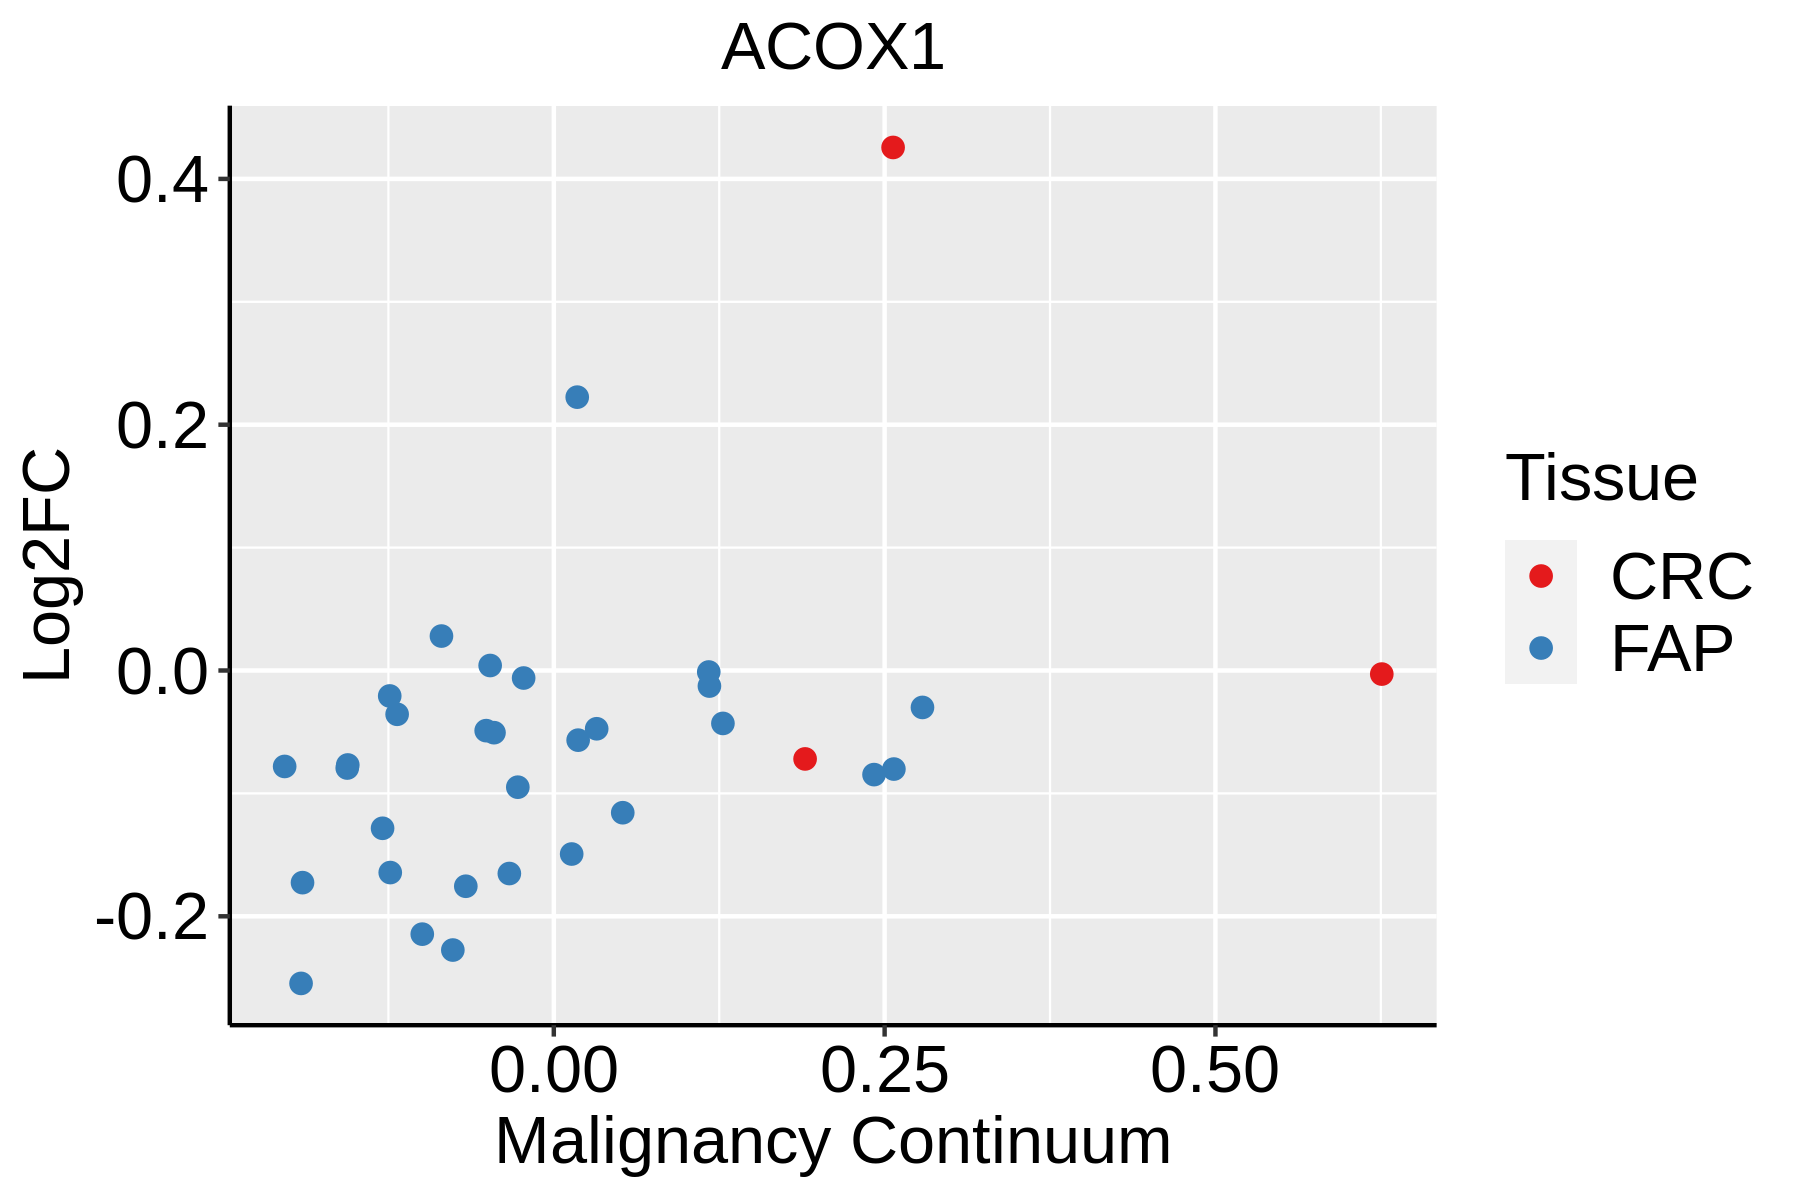 | FAP: Familial adenomatous polyposis |
| CRC: Colorectal cancer | ||
| Colorectum (HTA11) |  | AD: Adenomas |
| SER: Sessile serrated lesions | ||
| MSI-H: Microsatellite-high colorectal cancer | ||
| MSS: Microsatellite stable colorectal cancer | ||
| Esophagus | 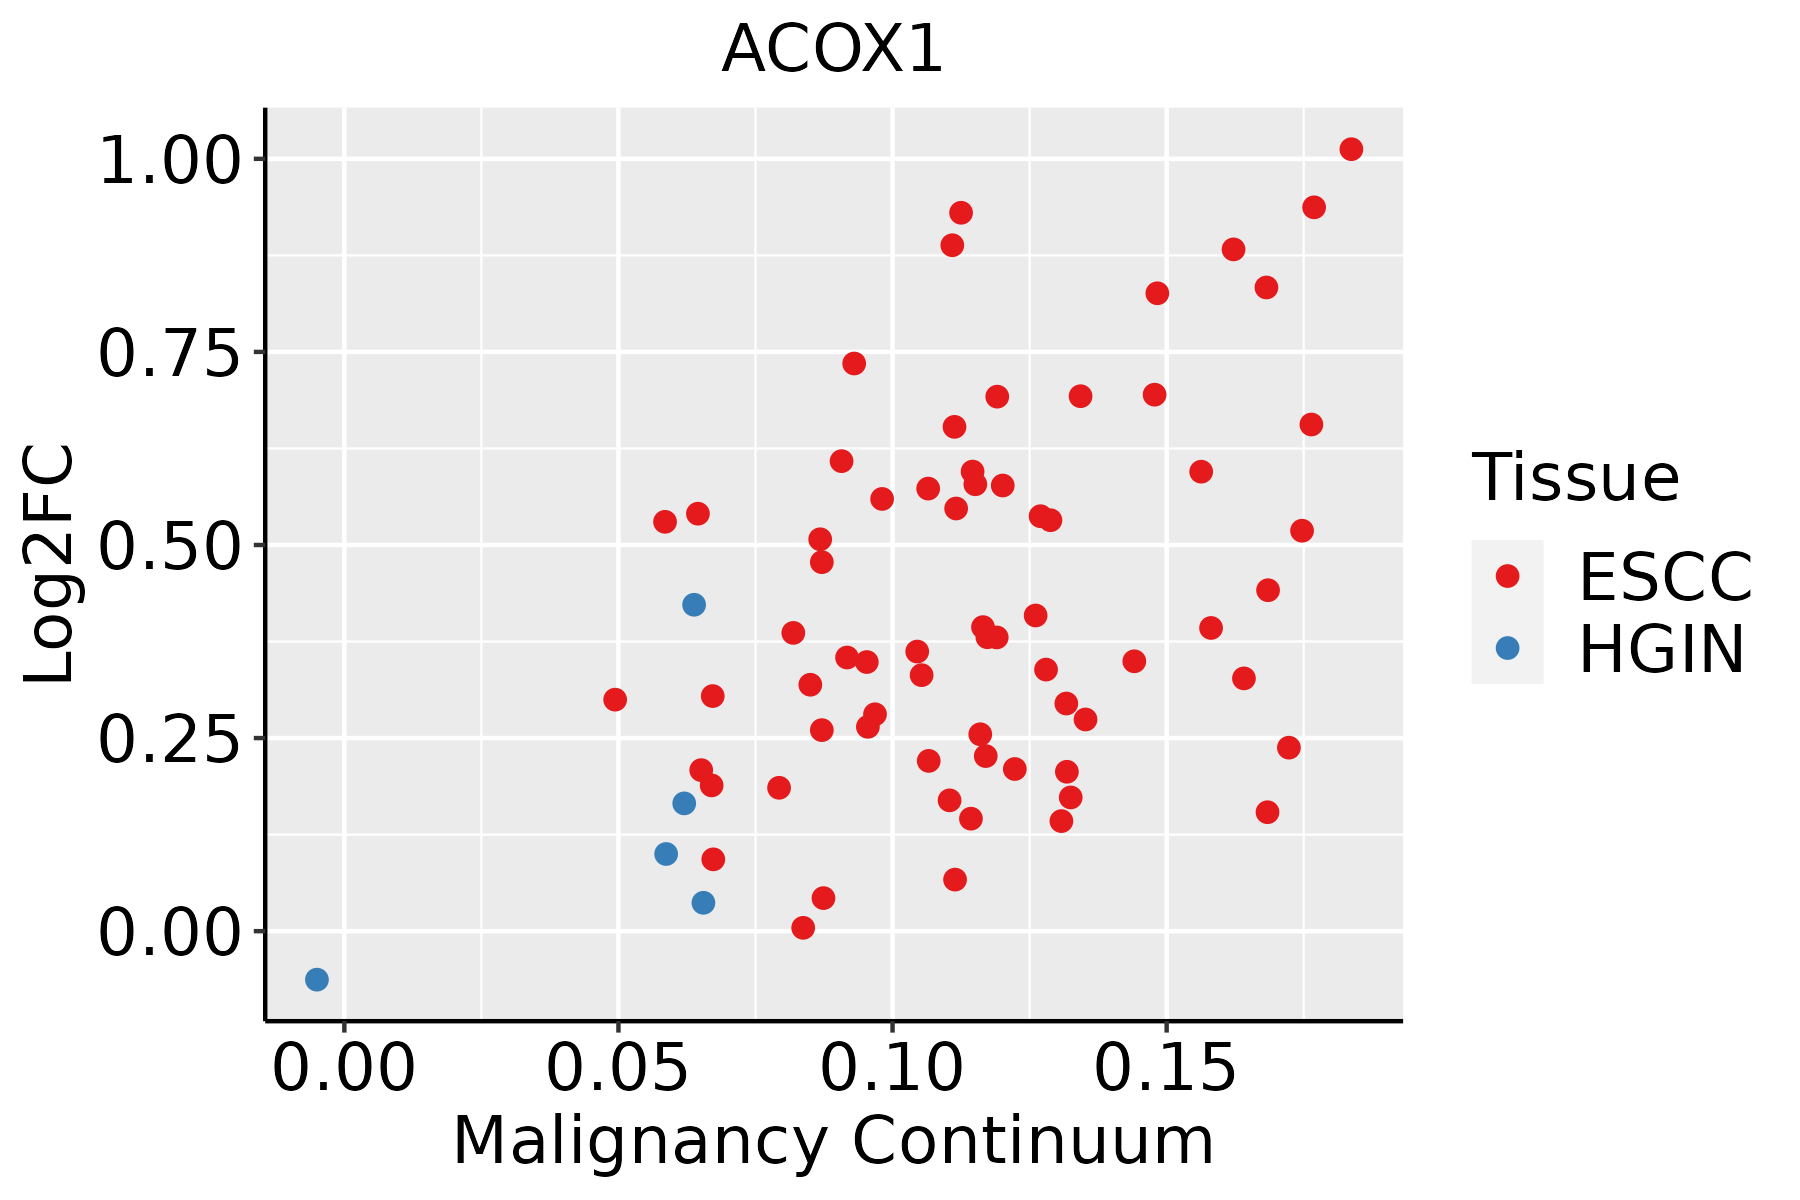 | ESCC: Esophageal squamous cell carcinoma |
| HGIN: High-grade intraepithelial neoplasias | ||
| LGIN: Low-grade intraepithelial neoplasias | ||
| Liver | 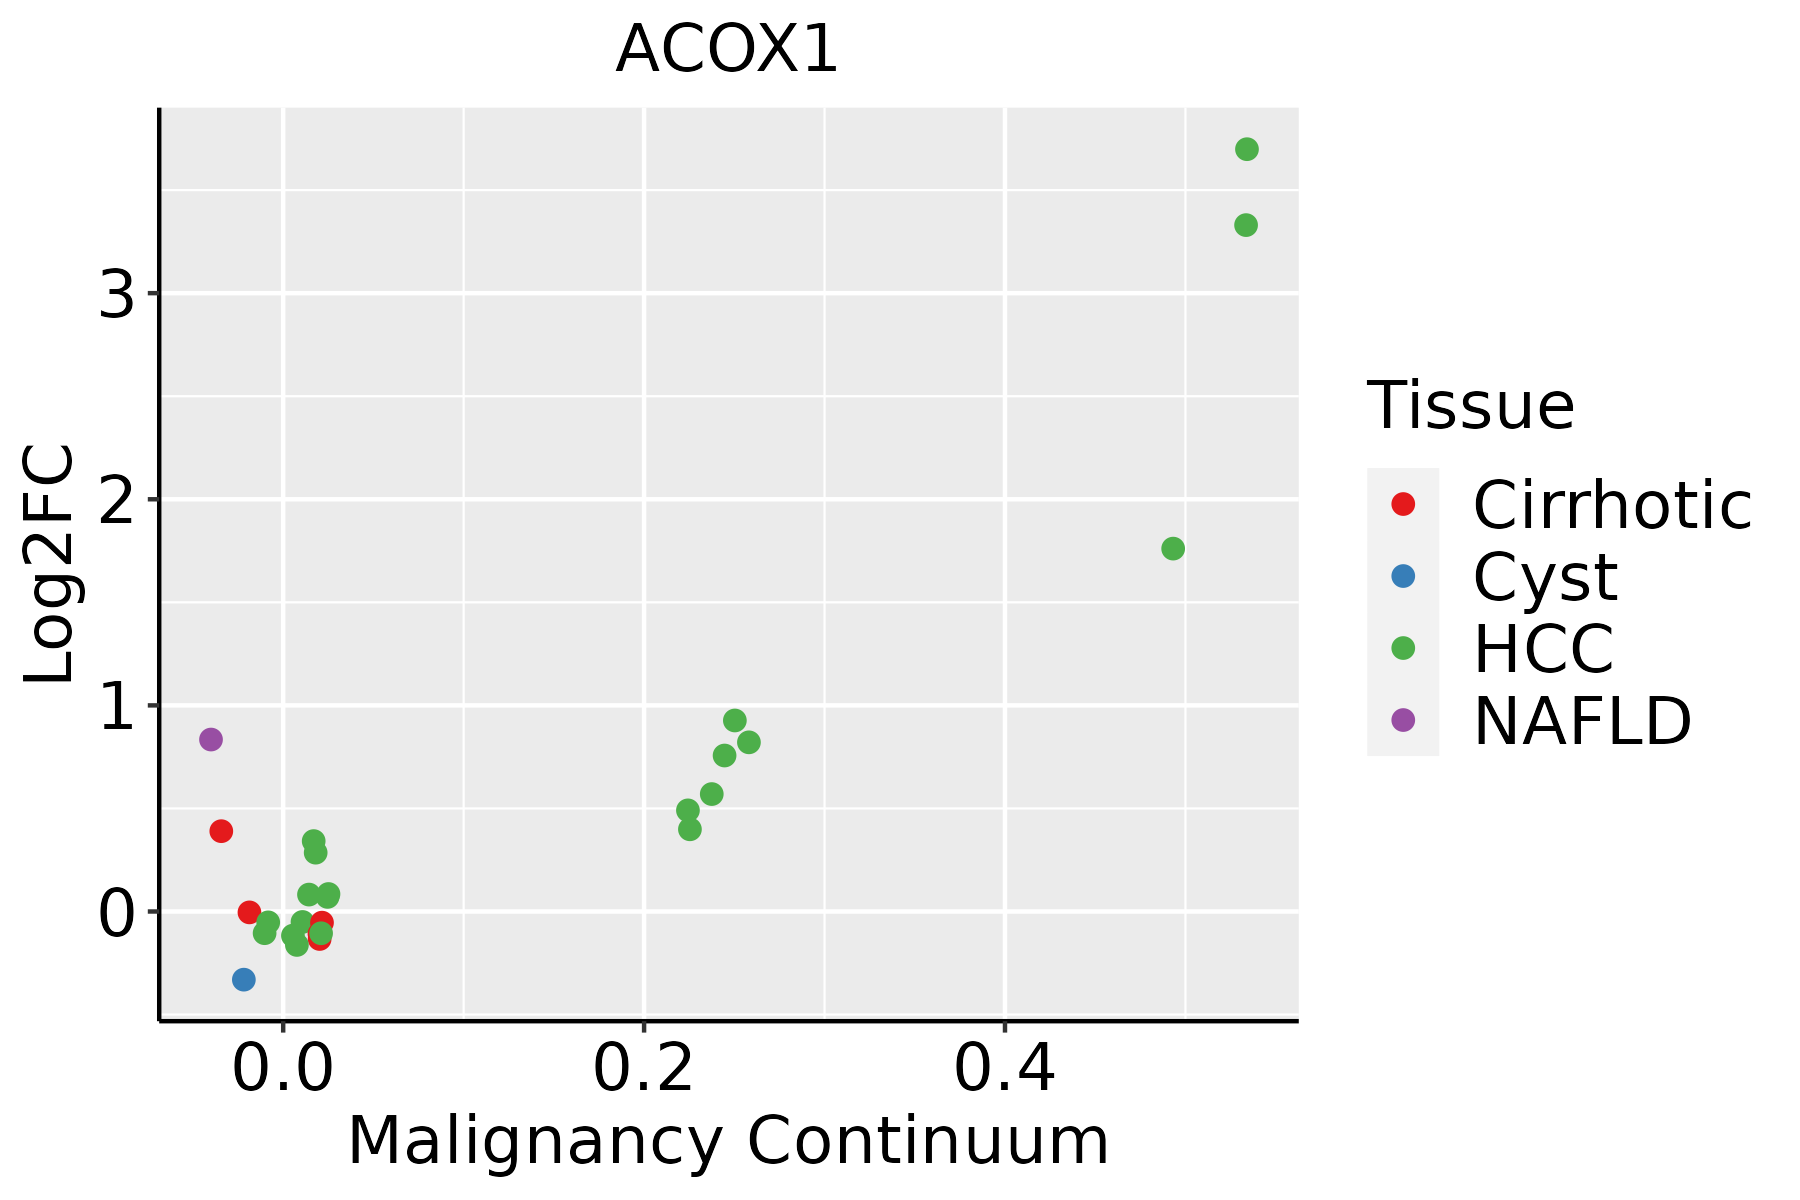 | HCC: Hepatocellular carcinoma |
| NAFLD: Non-alcoholic fatty liver disease | ||
| Prostate | 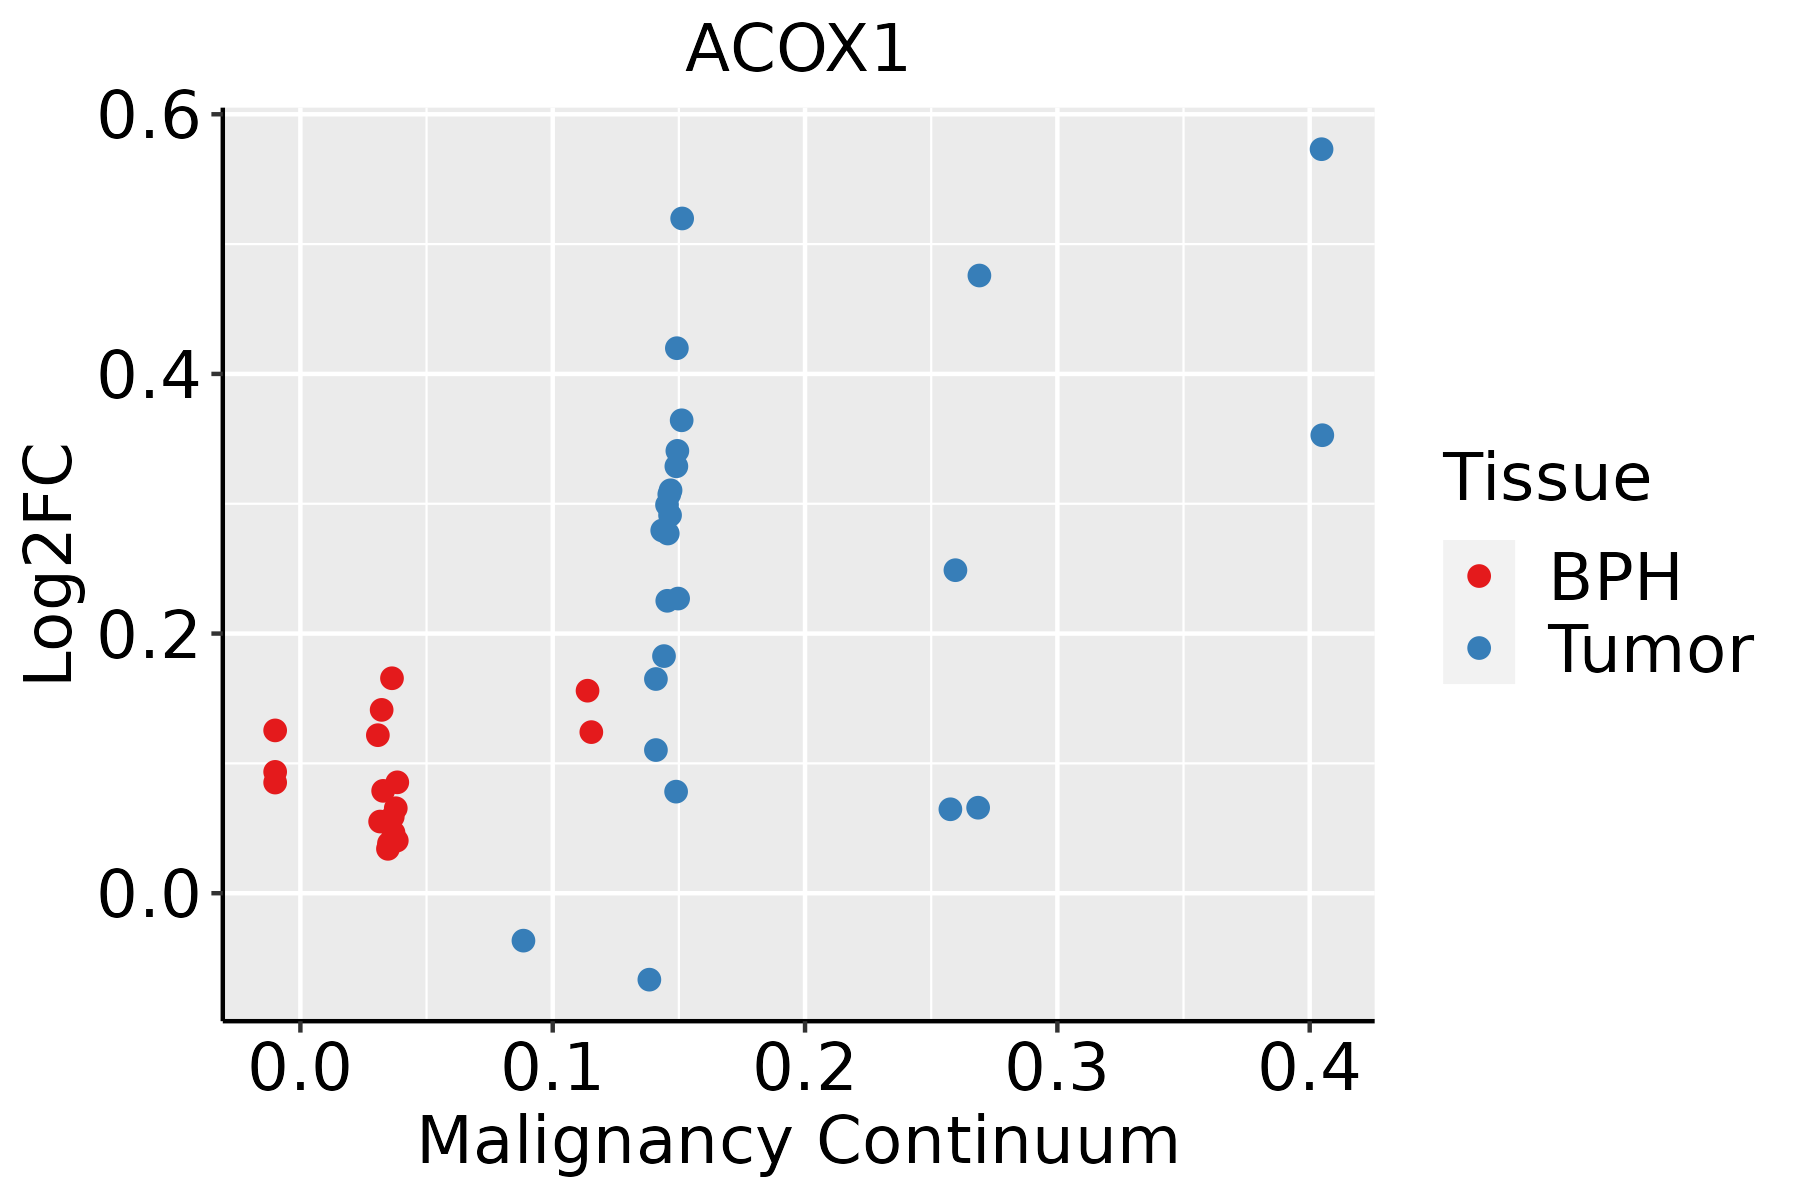 | BPH: Benign Prostatic Hyperplasia |
| Thyroid | 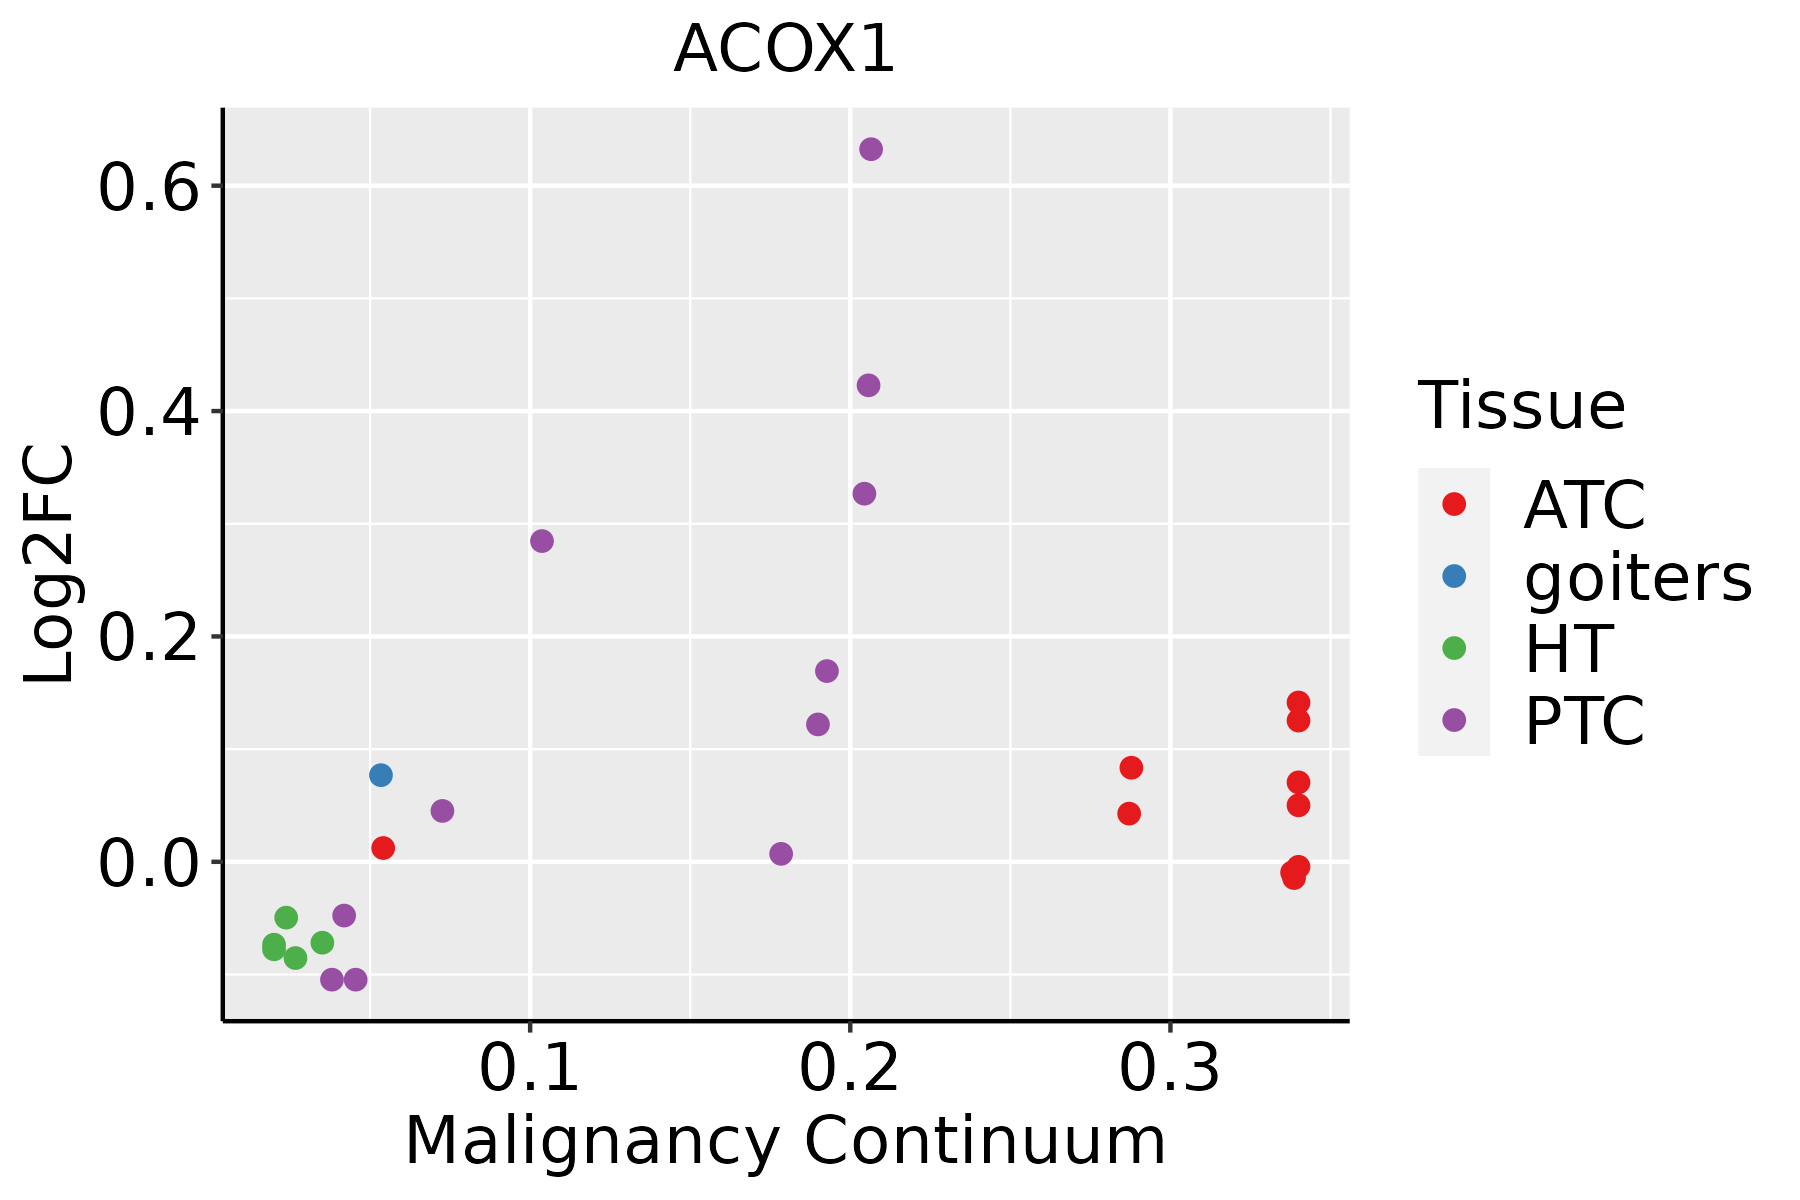 | ATC: Anaplastic thyroid cancer |
| HT: Hashimoto's thyroiditis | ||
| PTC: Papillary thyroid cancer |
| ∗log2FC in expression of this searched gene in stem-like cells from each diseased tissue sample relative to stem-like cells in normal samples in each tissue plotted against the malignancy continuum. Samples are colored based on if they are from different disease stage. |
Top |
Malignant transformation related pathway analysis |
| Find out the enriched GO biological processes and KEGG pathways involved in transition from healthy to precancer to cancer |
| Tissue | Disease Stage | Enriched GO biological Processes |
| Colorectum | AD |  |
| Colorectum | SER |  |
| Colorectum | MSS |  |
| Colorectum | MSI-H |  |
| Colorectum | FAP |  |
| ∗Top 15 enriched GO BP terms are showed in the bar plot of each disease state in each tissue. Each row represents a significant GO biological process which is colored according to the -log10(p.adjust). |
| Page: 1 2 3 4 5 6 7 8 9 |
| GO ID | Tissue | Disease Stage | Description | Gene Ratio | Bg Ratio | pvalue | p.adjust | Count |
| GO:0006091 | Colorectum | AD | generation of precursor metabolites and energy | 209/3918 | 490/18723 | 3.17e-28 | 6.61e-25 | 209 |
| GO:0044282 | Colorectum | AD | small molecule catabolic process | 118/3918 | 376/18723 | 1.05e-06 | 3.55e-05 | 118 |
| GO:0006635 | Colorectum | AD | fatty acid beta-oxidation | 33/3918 | 74/18723 | 3.98e-06 | 1.09e-04 | 33 |
| GO:0009062 | Colorectum | AD | fatty acid catabolic process | 41/3918 | 100/18723 | 4.02e-06 | 1.09e-04 | 41 |
| GO:0019395 | Colorectum | AD | fatty acid oxidation | 40/3918 | 103/18723 | 2.43e-05 | 4.69e-04 | 40 |
| GO:0016042 | Colorectum | AD | lipid catabolic process | 97/3918 | 320/18723 | 4.31e-05 | 7.56e-04 | 97 |
| GO:0006631 | Colorectum | AD | fatty acid metabolic process | 114/3918 | 390/18723 | 5.58e-05 | 9.44e-04 | 114 |
| GO:0072329 | Colorectum | AD | monocarboxylic acid catabolic process | 44/3918 | 122/18723 | 8.05e-05 | 1.28e-03 | 44 |
| GO:0034440 | Colorectum | AD | lipid oxidation | 40/3918 | 108/18723 | 8.52e-05 | 1.32e-03 | 40 |
| GO:0030258 | Colorectum | AD | lipid modification | 67/3918 | 212/18723 | 1.66e-04 | 2.27e-03 | 67 |
| GO:0072593 | Colorectum | AD | reactive oxygen species metabolic process | 73/3918 | 239/18723 | 2.79e-04 | 3.42e-03 | 73 |
| GO:0016054 | Colorectum | AD | organic acid catabolic process | 73/3918 | 240/18723 | 3.20e-04 | 3.81e-03 | 73 |
| GO:0044242 | Colorectum | AD | cellular lipid catabolic process | 66/3918 | 214/18723 | 3.96e-04 | 4.50e-03 | 66 |
| GO:0046395 | Colorectum | AD | carboxylic acid catabolic process | 70/3918 | 236/18723 | 9.06e-04 | 8.71e-03 | 70 |
| GO:00060911 | Colorectum | SER | generation of precursor metabolites and energy | 168/2897 | 490/18723 | 1.39e-25 | 1.70e-22 | 168 |
| GO:00160421 | Colorectum | SER | lipid catabolic process | 77/2897 | 320/18723 | 3.52e-05 | 9.18e-04 | 77 |
| GO:00725931 | Colorectum | SER | reactive oxygen species metabolic process | 61/2897 | 239/18723 | 3.63e-05 | 9.39e-04 | 61 |
| GO:00442821 | Colorectum | SER | small molecule catabolic process | 87/2897 | 376/18723 | 5.31e-05 | 1.27e-03 | 87 |
| GO:00090621 | Colorectum | SER | fatty acid catabolic process | 31/2897 | 100/18723 | 7.09e-05 | 1.61e-03 | 31 |
| GO:00066351 | Colorectum | SER | fatty acid beta-oxidation | 24/2897 | 74/18723 | 2.09e-04 | 3.77e-03 | 24 |
| Page: 1 2 3 4 5 6 7 |
| Pathway ID | Tissue | Disease Stage | Description | Gene Ratio | Bg Ratio | pvalue | p.adjust | qvalue | Count |
| hsa0064031 | Liver | Cirrhotic | Propanoate metabolism | 18/2530 | 32/8465 | 1.66e-03 | 8.01e-03 | 4.94e-03 | 18 |
| hsa041463 | Liver | Cirrhotic | Peroxisome | 36/2530 | 82/8465 | 4.79e-03 | 1.74e-02 | 1.07e-02 | 36 |
| hsa0332031 | Liver | Cirrhotic | PPAR signaling pathway | 32/2530 | 75/8465 | 1.24e-02 | 3.92e-02 | 2.42e-02 | 32 |
| hsa010401 | Liver | Cirrhotic | Biosynthesis of unsaturated fatty acids | 14/2530 | 27/8465 | 1.36e-02 | 4.25e-02 | 2.62e-02 | 14 |
| hsa0120041 | Liver | HCC | Carbon metabolism | 89/4020 | 115/8465 | 3.92e-11 | 6.56e-10 | 3.65e-10 | 89 |
| hsa012124 | Liver | HCC | Fatty acid metabolism | 45/4020 | 57/8465 | 1.05e-06 | 1.10e-05 | 6.09e-06 | 45 |
| hsa041464 | Liver | HCC | Peroxisome | 58/4020 | 82/8465 | 1.57e-05 | 1.05e-04 | 5.85e-05 | 58 |
| hsa0007141 | Liver | HCC | Fatty acid degradation | 33/4020 | 43/8465 | 8.41e-05 | 4.27e-04 | 2.37e-04 | 33 |
| hsa049362 | Liver | HCC | Alcoholic liver disease | 89/4020 | 142/8465 | 1.73e-04 | 8.53e-04 | 4.75e-04 | 89 |
| hsa0064041 | Liver | HCC | Propanoate metabolism | 24/4020 | 32/8465 | 1.42e-03 | 5.07e-03 | 2.82e-03 | 24 |
| hsa033204 | Liver | HCC | PPAR signaling pathway | 48/4020 | 75/8465 | 2.83e-03 | 9.37e-03 | 5.21e-03 | 48 |
| hsa004102 | Liver | HCC | beta-Alanine metabolism | 22/4020 | 31/8465 | 6.93e-03 | 1.92e-02 | 1.07e-02 | 22 |
| hsa010402 | Liver | HCC | Biosynthesis of unsaturated fatty acids | 19/4020 | 27/8465 | 1.37e-02 | 3.33e-02 | 1.85e-02 | 19 |
| hsa0120051 | Liver | HCC | Carbon metabolism | 89/4020 | 115/8465 | 3.92e-11 | 6.56e-10 | 3.65e-10 | 89 |
| hsa012125 | Liver | HCC | Fatty acid metabolism | 45/4020 | 57/8465 | 1.05e-06 | 1.10e-05 | 6.09e-06 | 45 |
| hsa041465 | Liver | HCC | Peroxisome | 58/4020 | 82/8465 | 1.57e-05 | 1.05e-04 | 5.85e-05 | 58 |
| hsa0007151 | Liver | HCC | Fatty acid degradation | 33/4020 | 43/8465 | 8.41e-05 | 4.27e-04 | 2.37e-04 | 33 |
| hsa049363 | Liver | HCC | Alcoholic liver disease | 89/4020 | 142/8465 | 1.73e-04 | 8.53e-04 | 4.75e-04 | 89 |
| hsa0064051 | Liver | HCC | Propanoate metabolism | 24/4020 | 32/8465 | 1.42e-03 | 5.07e-03 | 2.82e-03 | 24 |
| hsa033205 | Liver | HCC | PPAR signaling pathway | 48/4020 | 75/8465 | 2.83e-03 | 9.37e-03 | 5.21e-03 | 48 |
| Page: 1 2 3 4 5 |
Top |
Cell-cell communication analysis |
| Identification of potential cell-cell interactions between two cell types and their ligand-receptor pairs for different disease states |
| Ligand | Receptor | LRpair | Pathway | Tissue | Disease Stage |
| Page: 1 |
Top |
Single-cell gene regulatory network inference analysis |
| Find out the significant the regulons (TFs) and the target genes of each regulon across cell types for different disease states |
| TF | Cell Type | Tissue | Disease Stage | Target Gene | RSS | Regulon Activity |
| ∗The dot plots of a searched regulon are shown for all cell subpopulations in each disease state of each tissue based on the regulon specific score inferred using pySCENIC and by calculating the average expression. |
| Page: 1 |
Top |
Somatic mutation of malignant transformation related genes |
| Annotation of somatic variants for genes involved in malignant transformation |
| Hugo Symbol | Variant Class | Variant Classification | dbSNP RS | HGVSc | HGVSp | HGVSp Short | SWISSPROT | BIOTYPE | SIFT | PolyPhen | Tumor Sample Barcode | Tissue | Histology | Sex | Age | Stage | Therapy Types | Drugs | Outcome |
| ACOX1 | SNV | Missense_Mutation | novel | c.88N>C | p.Thr30Pro | p.T30P | Q15067 | protein_coding | deleterious(0.01) | benign(0.168) | TCGA-AR-A1AQ-01 | Breast | breast invasive carcinoma | Female | <65 | I/II | Chemotherapy | doxorubicin | SD |
| ACOX1 | SNV | Missense_Mutation | c.1693N>C | p.Tyr565His | p.Y565H | Q15067 | protein_coding | tolerated(1) | benign(0.001) | TCGA-BH-A0BZ-01 | Breast | breast invasive carcinoma | Female | <65 | III/IV | Chemotherapy | doxorubicin | CR | |
| ACOX1 | SNV | Missense_Mutation | c.781N>G | p.Pro261Ala | p.P261A | Q15067 | protein_coding | tolerated(0.11) | benign(0) | TCGA-BH-A18V-01 | Breast | breast invasive carcinoma | Female | <65 | I/II | Unknown | Unknown | SD | |
| ACOX1 | SNV | Missense_Mutation | rs752885559 | c.731A>G | p.Asn244Ser | p.N244S | Q15067 | protein_coding | tolerated(0.05) | benign(0.048) | TCGA-D8-A1XK-01 | Breast | breast invasive carcinoma | Female | <65 | I/II | Chemotherapy | doxorubicine+cyclophosphamide | SD |
| ACOX1 | SNV | Missense_Mutation | rs749413865 | c.414N>C | p.Gln138His | p.Q138H | Q15067 | protein_coding | deleterious(0) | probably_damaging(0.995) | TCGA-E2-A14N-01 | Breast | breast invasive carcinoma | Female | <65 | I/II | Chemotherapy | cyclophosphamide | SD |
| ACOX1 | insertion | In_Frame_Ins | novel | c.1115_1116insTAGGCAACAAGAATG | p.Ala372_Leu373insArgGlnGlnGluCys | p.A372_L373insRQQEC | Q15067 | protein_coding | TCGA-A2-A0CT-01 | Breast | breast invasive carcinoma | Female | >=65 | I/II | Chemotherapy | cytoxan | SD | ||
| ACOX1 | insertion | In_Frame_Ins | novel | c.1160_1161insAGAAAAAGCAAGGAG | p.Thr387_Gly388insGluLysAlaArgSer | p.T387_G388insEKARS | Q15067 | protein_coding | TCGA-A8-A07J-01 | Breast | breast invasive carcinoma | Female | <65 | I/II | Chemotherapy | 5-fluorouracil | CR | ||
| ACOX1 | insertion | Frame_Shift_Ins | novel | c.1158_1159insCTTCAAAAAGAAGTGATTC | p.Thr387LeufsTer10 | p.T387Lfs*10 | Q15067 | protein_coding | TCGA-A8-A07J-01 | Breast | breast invasive carcinoma | Female | <65 | I/II | Chemotherapy | 5-fluorouracil | CR | ||
| ACOX1 | insertion | In_Frame_Ins | novel | c.1126_1127insTTCAAGACCAGCTTGATCAACATGGTGAAACCGTGTCTCTAC | p.Gly376delinsValGlnAspGlnLeuAspGlnHisGlyGluThrValSerLeuArg | p.G376delinsVQDQLDQHGETVSLR | Q15067 | protein_coding | TCGA-AN-A03X-01 | Breast | breast invasive carcinoma | Female | >=65 | I/II | Unknown | Unknown | SD | ||
| ACOX1 | insertion | Frame_Shift_Ins | novel | c.1536_1537insAT | p.Glu513MetfsTer3 | p.E513Mfs*3 | Q15067 | protein_coding | TCGA-AR-A0TY-01 | Breast | breast invasive carcinoma | Female | <65 | I/II | Unspecific | Paclitaxel | PD |
| Page: 1 2 3 4 5 6 7 |
Top |
Related drugs of malignant transformation related genes |
| Identification of chemicals and drugs interact with genes involved in malignant transfromation |
| (DGIdb 4.0) |
| Entrez ID | Symbol | Category | Interaction Types | Drug Claim Name | Drug Name | PMIDs |
| Page: 1 |

Copyright 2023-Present -The University of Texas Health Science Center at Houston |