
|
|||||
|
 | |
| |
| |
| |
| |
| |
|
Gene: NDUFAB1 |
Gene summary for NDUFAB1 |
| Gene information | Species | Human | Gene symbol | NDUFAB1 | Gene ID | 4706 |
| Gene name | NADH:ubiquinone oxidoreductase subunit AB1 | |
| Gene Alias | ACP | |
| Cytomap | 16p12.2 | |
| Gene Type | protein-coding | GO ID | GO:0006082 | UniProtAcc | O14561 |
Top |
Malignant transformation analysis |
| Identification of the aberrant gene expression in precancerous and cancerous lesions by comparing the gene expression of stem-like cells in diseased tissues with normal stem cells |
| Entrez ID | Symbol | Replicates | Species | Organ | Tissue | Adj P-value | Log2FC | Malignancy |
| 4706 | NDUFAB1 | GSM4909282 | Human | Breast | IDC | 3.17e-17 | 4.94e-01 | -0.0288 |
| 4706 | NDUFAB1 | GSM4909285 | Human | Breast | IDC | 1.06e-02 | 3.32e-01 | 0.21 |
| 4706 | NDUFAB1 | GSM4909290 | Human | Breast | IDC | 1.47e-05 | 3.34e-01 | 0.2096 |
| 4706 | NDUFAB1 | GSM4909291 | Human | Breast | IDC | 1.02e-02 | 2.29e-01 | 0.1753 |
| 4706 | NDUFAB1 | GSM4909293 | Human | Breast | IDC | 4.66e-05 | 3.12e-01 | 0.1581 |
| 4706 | NDUFAB1 | GSM4909294 | Human | Breast | IDC | 2.35e-08 | 2.88e-01 | 0.2022 |
| 4706 | NDUFAB1 | GSM4909296 | Human | Breast | IDC | 6.52e-13 | 1.77e-01 | 0.1524 |
| 4706 | NDUFAB1 | GSM4909297 | Human | Breast | IDC | 6.05e-11 | -1.08e-01 | 0.1517 |
| 4706 | NDUFAB1 | GSM4909298 | Human | Breast | IDC | 2.92e-03 | 3.03e-01 | 0.1551 |
| 4706 | NDUFAB1 | GSM4909301 | Human | Breast | IDC | 1.45e-03 | 2.27e-01 | 0.1577 |
| 4706 | NDUFAB1 | GSM4909304 | Human | Breast | IDC | 7.12e-04 | 3.82e-01 | 0.1636 |
| 4706 | NDUFAB1 | GSM4909306 | Human | Breast | IDC | 4.03e-29 | 6.71e-01 | 0.1564 |
| 4706 | NDUFAB1 | GSM4909307 | Human | Breast | IDC | 1.63e-04 | 3.02e-01 | 0.1569 |
| 4706 | NDUFAB1 | GSM4909308 | Human | Breast | IDC | 1.87e-15 | 4.27e-01 | 0.158 |
| 4706 | NDUFAB1 | GSM4909309 | Human | Breast | IDC | 2.35e-03 | 5.61e-02 | 0.0483 |
| 4706 | NDUFAB1 | GSM4909311 | Human | Breast | IDC | 5.04e-42 | -1.57e-01 | 0.1534 |
| 4706 | NDUFAB1 | GSM4909312 | Human | Breast | IDC | 1.46e-11 | 2.08e-02 | 0.1552 |
| 4706 | NDUFAB1 | GSM4909316 | Human | Breast | IDC | 3.55e-07 | 2.83e-01 | 0.21 |
| 4706 | NDUFAB1 | GSM4909318 | Human | Breast | IDC | 6.18e-05 | 3.47e-01 | 0.2031 |
| 4706 | NDUFAB1 | GSM4909319 | Human | Breast | IDC | 5.17e-49 | -1.40e-01 | 0.1563 |
| Page: 1 2 3 4 5 6 7 8 9 10 11 12 13 14 |
| Tissue | Expression Dynamics | Abbreviation |
| Breast | 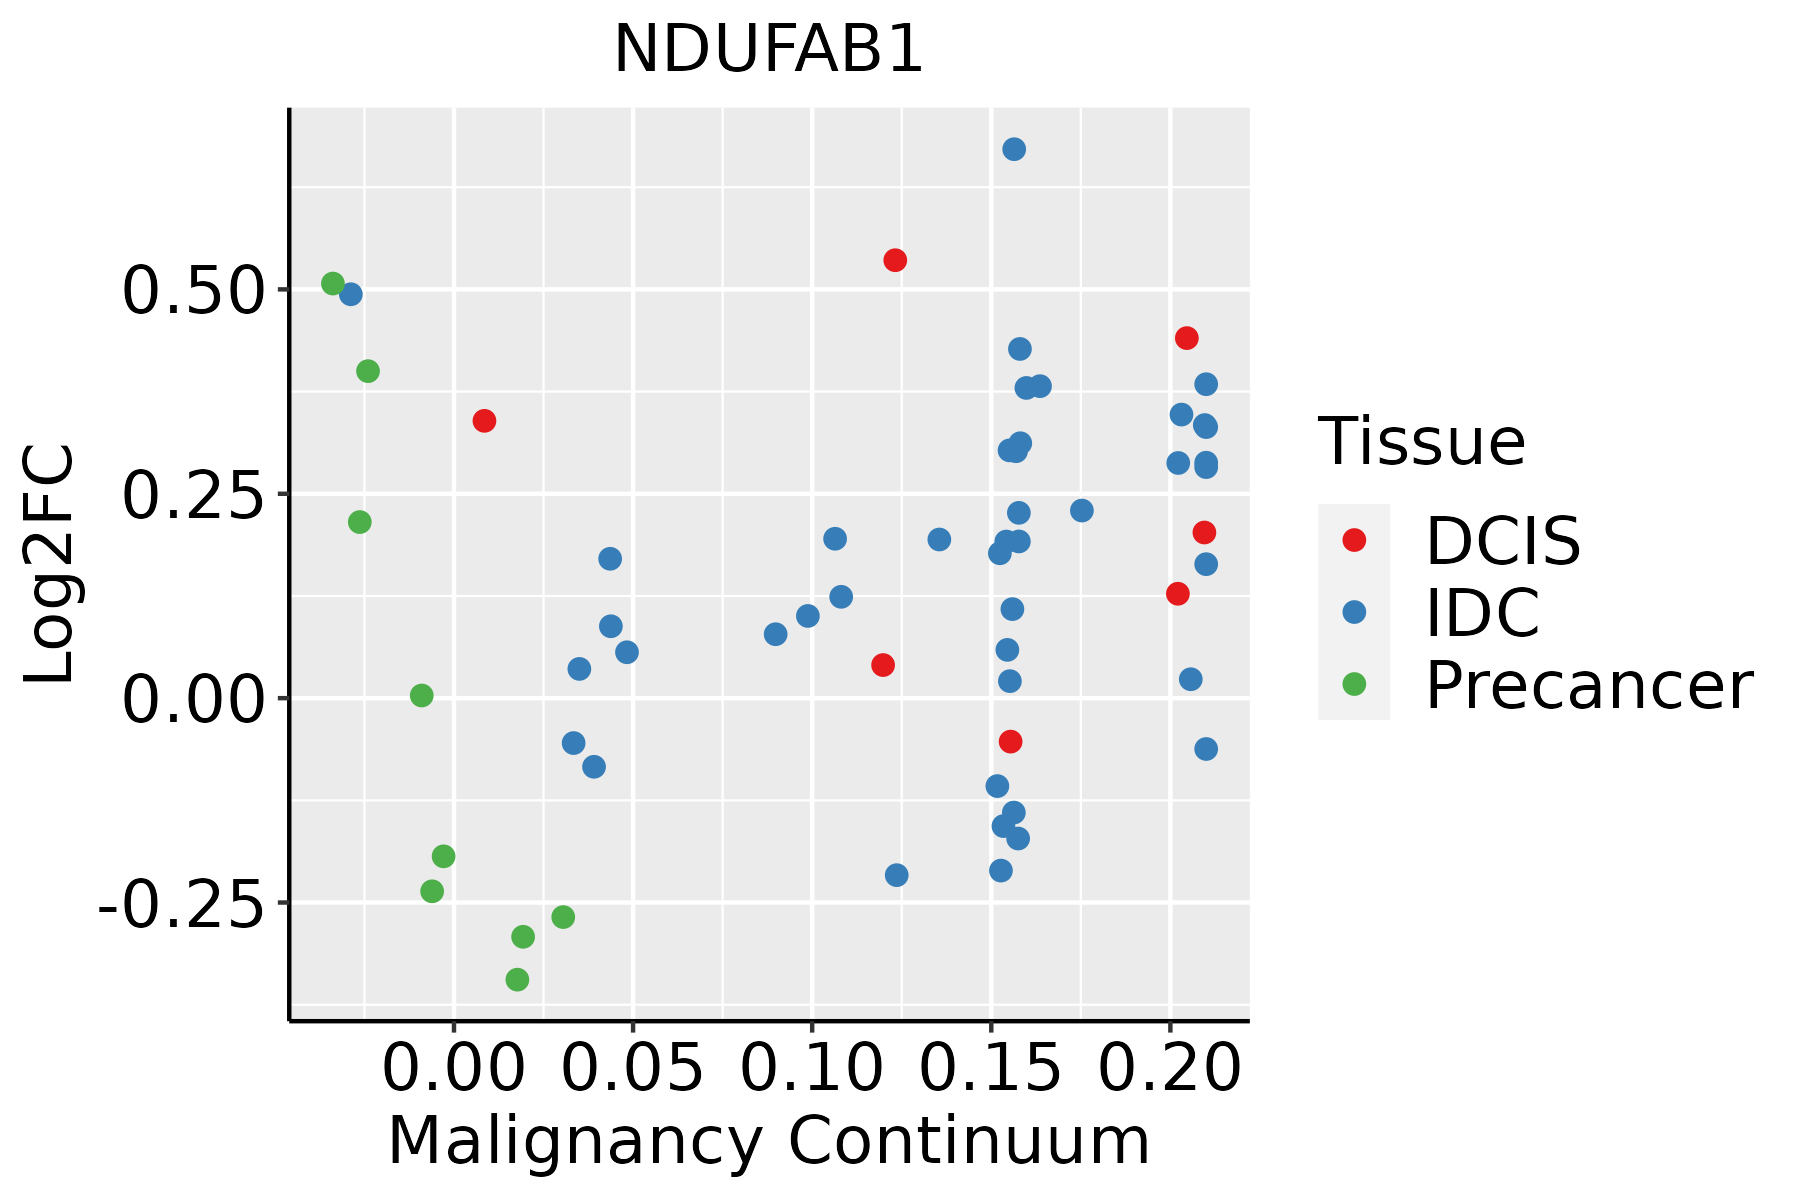 | IDC: Invasive ductal carcinoma |
| DCIS: Ductal carcinoma in situ | ||
| Precancer(BRCA1-mut): Precancerous lesion from BRCA1 mutation carriers | ||
| Cervix | 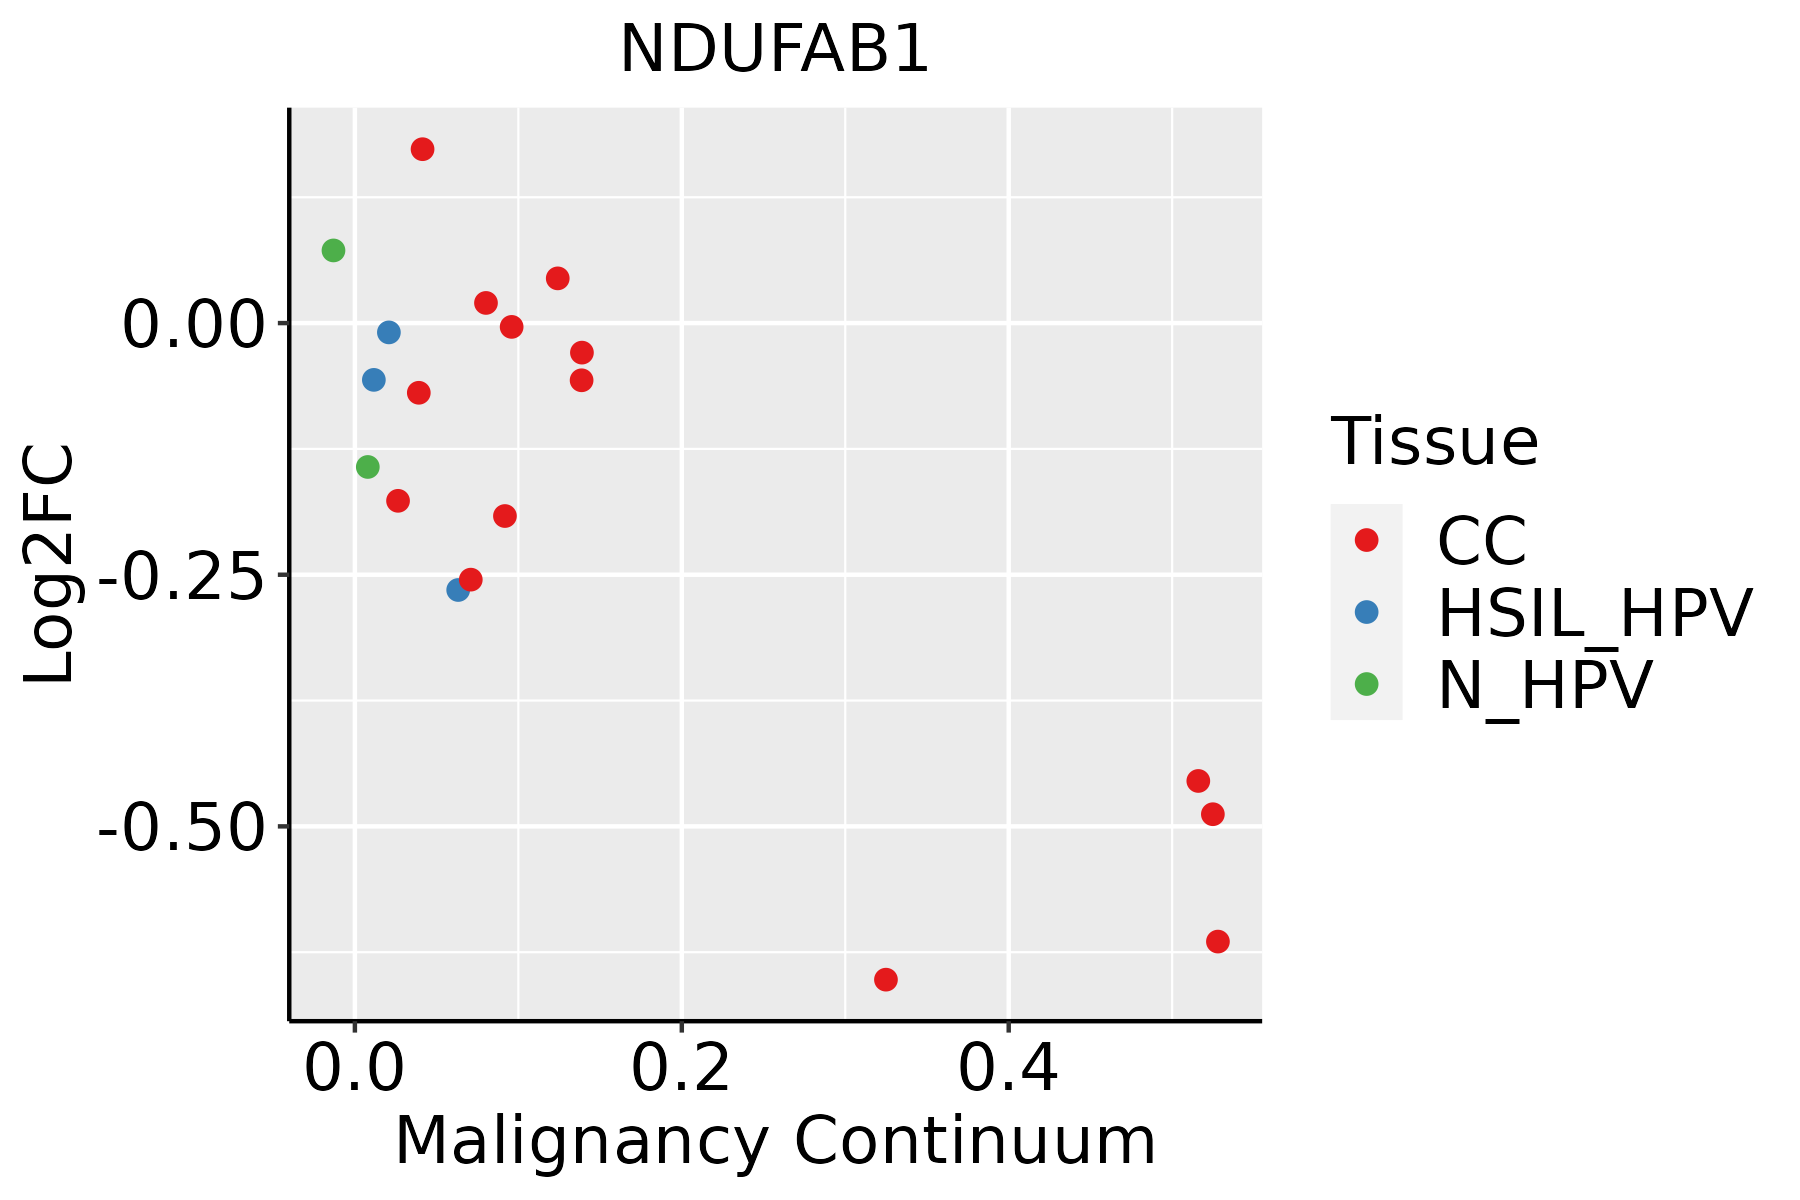 | CC: Cervix cancer |
| HSIL_HPV: HPV-infected high-grade squamous intraepithelial lesions | ||
| N_HPV: HPV-infected normal cervix | ||
| Colorectum (GSE201348) |  | FAP: Familial adenomatous polyposis |
| CRC: Colorectal cancer | ||
| Colorectum (HTA11) |  | AD: Adenomas |
| SER: Sessile serrated lesions | ||
| MSI-H: Microsatellite-high colorectal cancer | ||
| MSS: Microsatellite stable colorectal cancer | ||
| Endometrium | 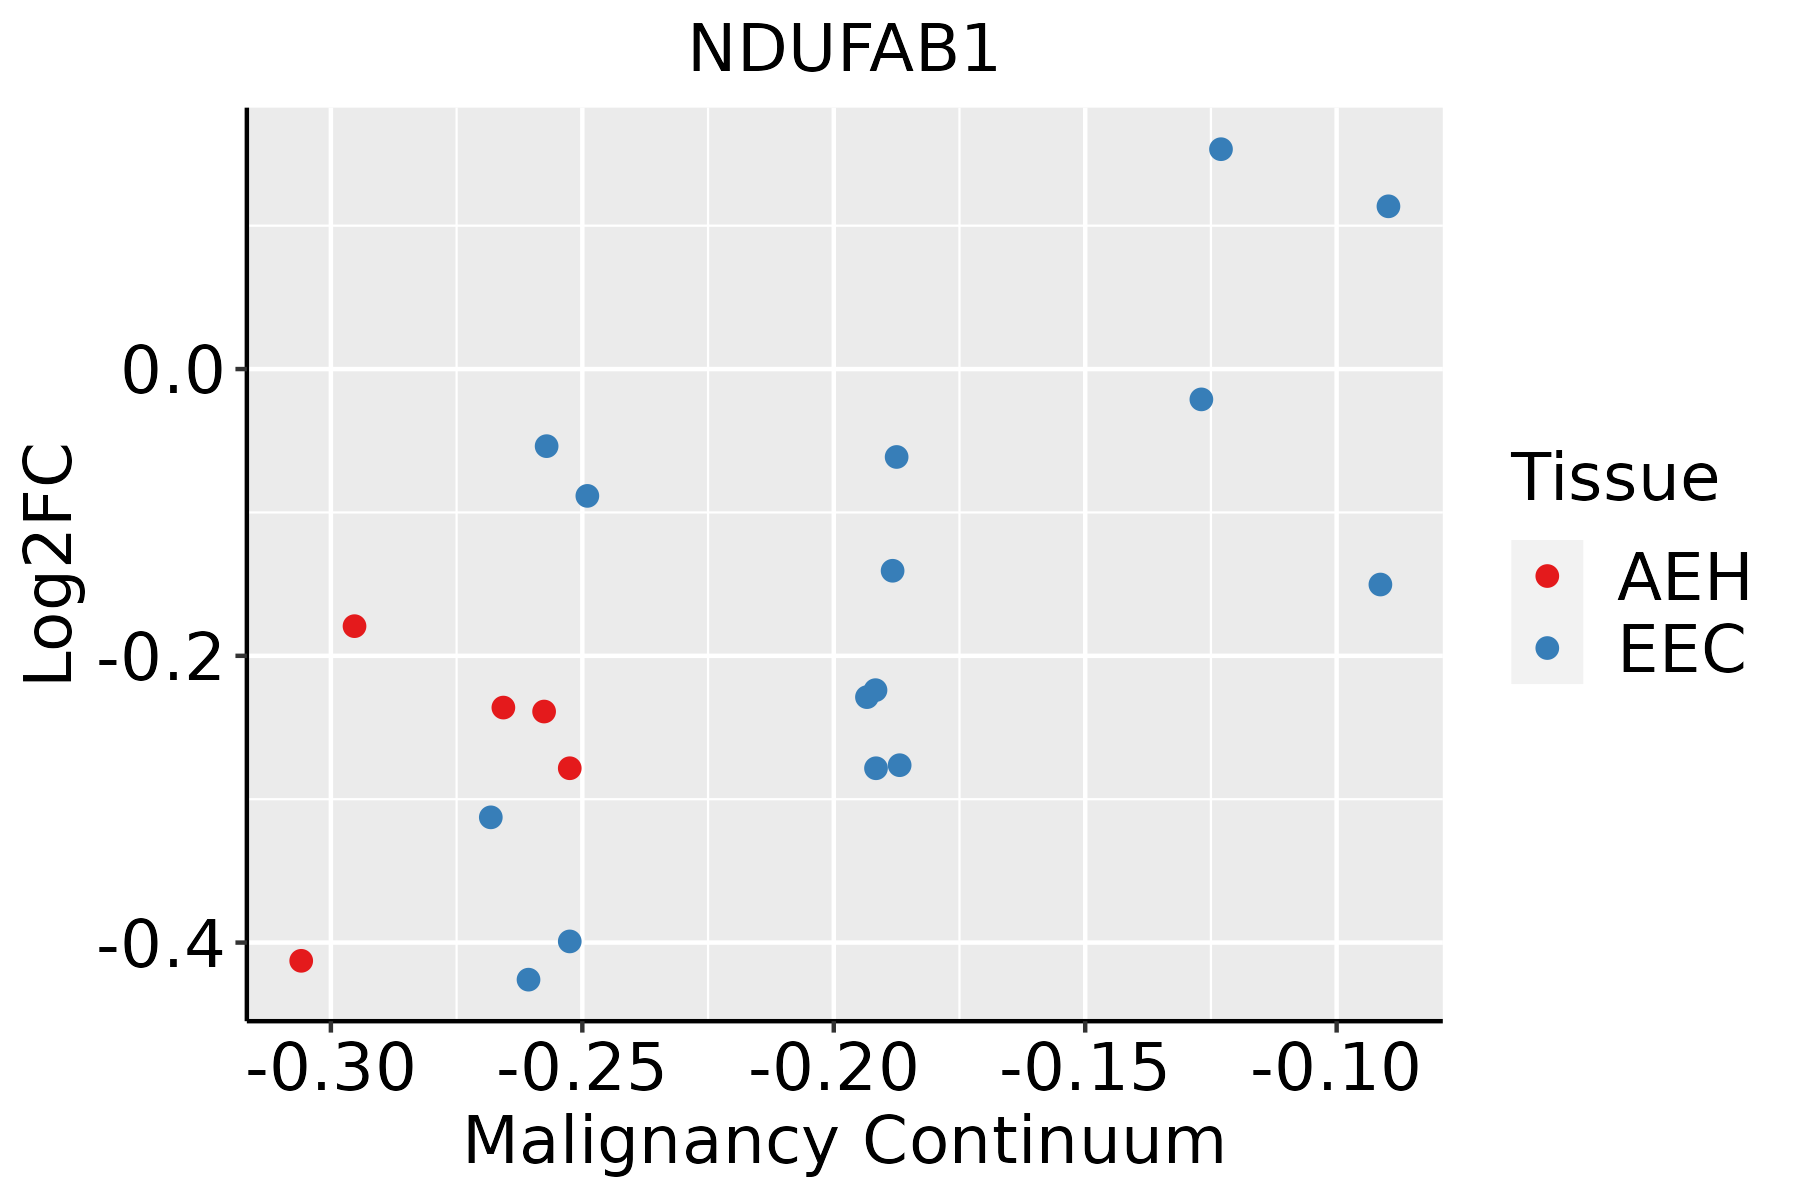 | AEH: Atypical endometrial hyperplasia |
| EEC: Endometrioid Cancer | ||
| Esophagus | 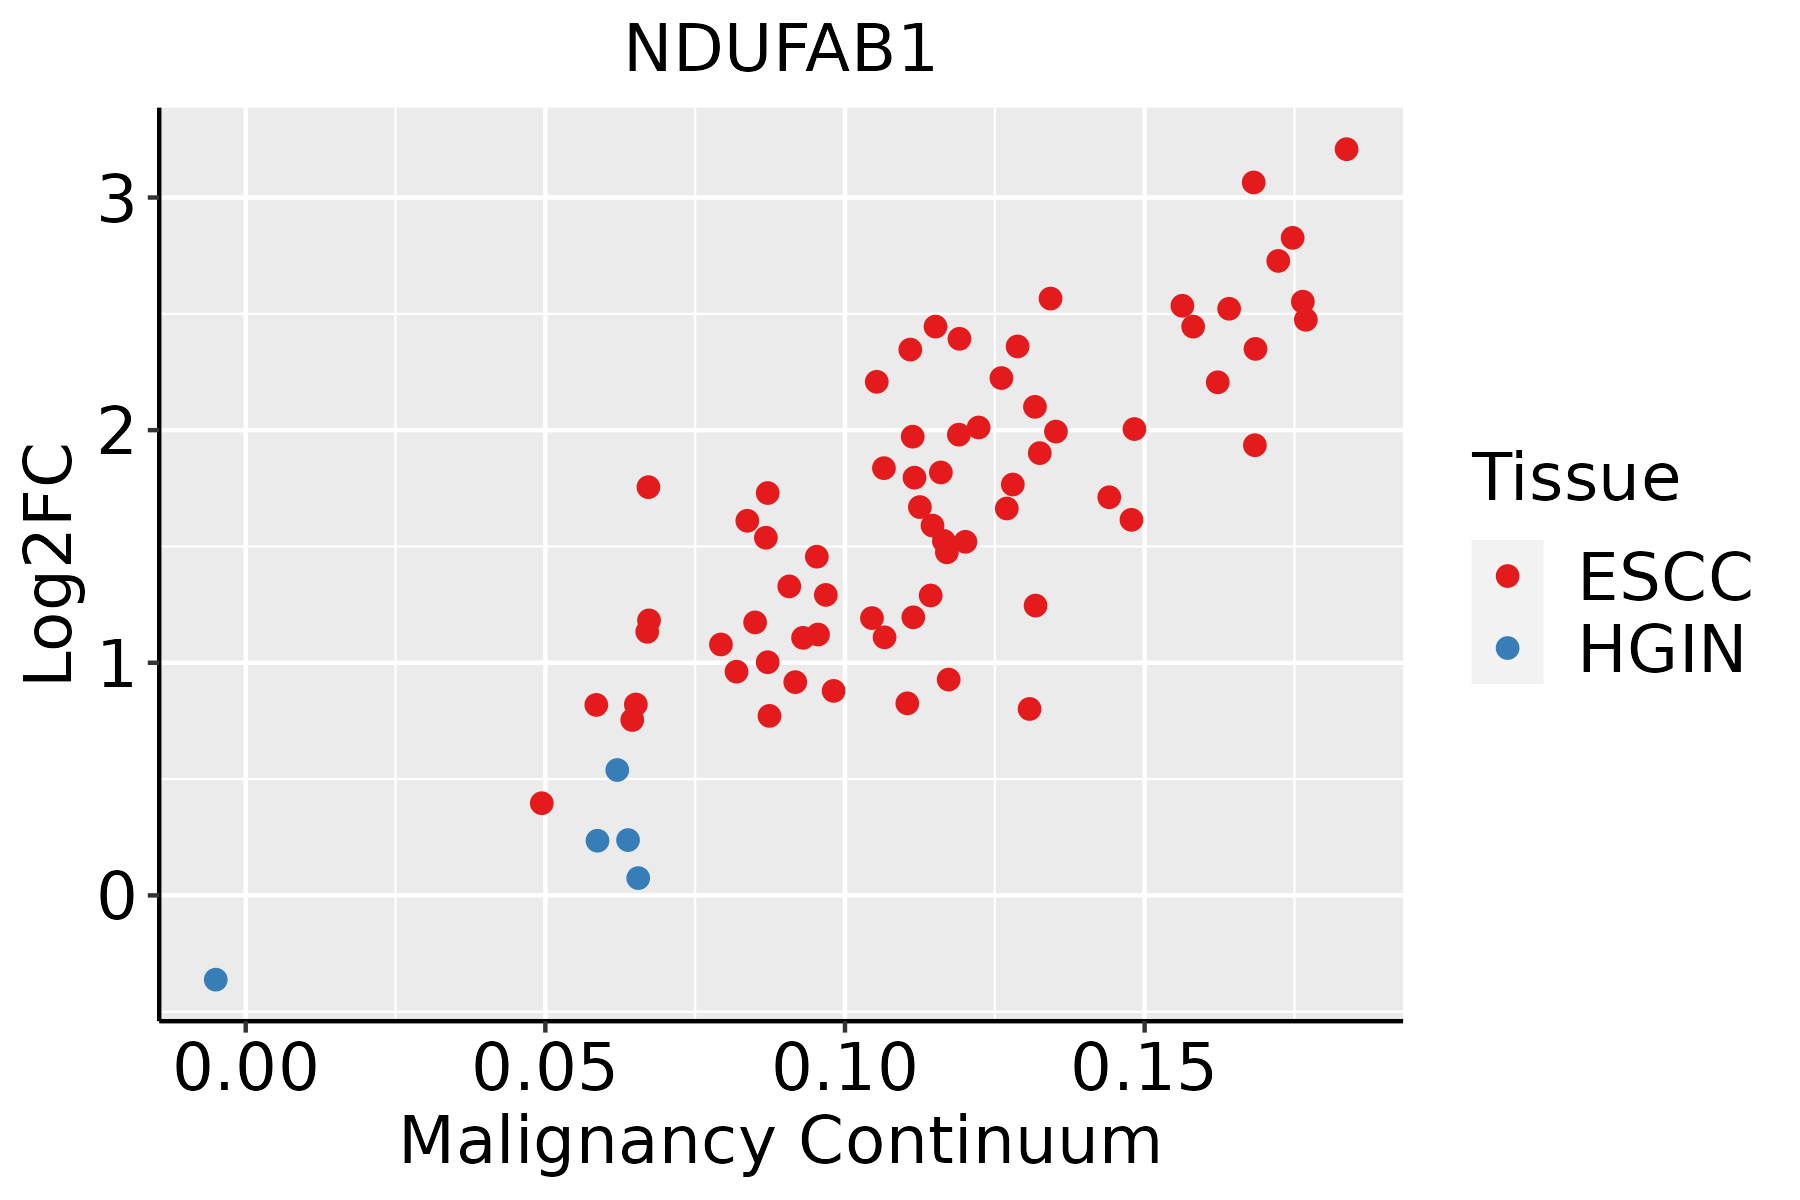 | ESCC: Esophageal squamous cell carcinoma |
| HGIN: High-grade intraepithelial neoplasias | ||
| LGIN: Low-grade intraepithelial neoplasias | ||
| GC | 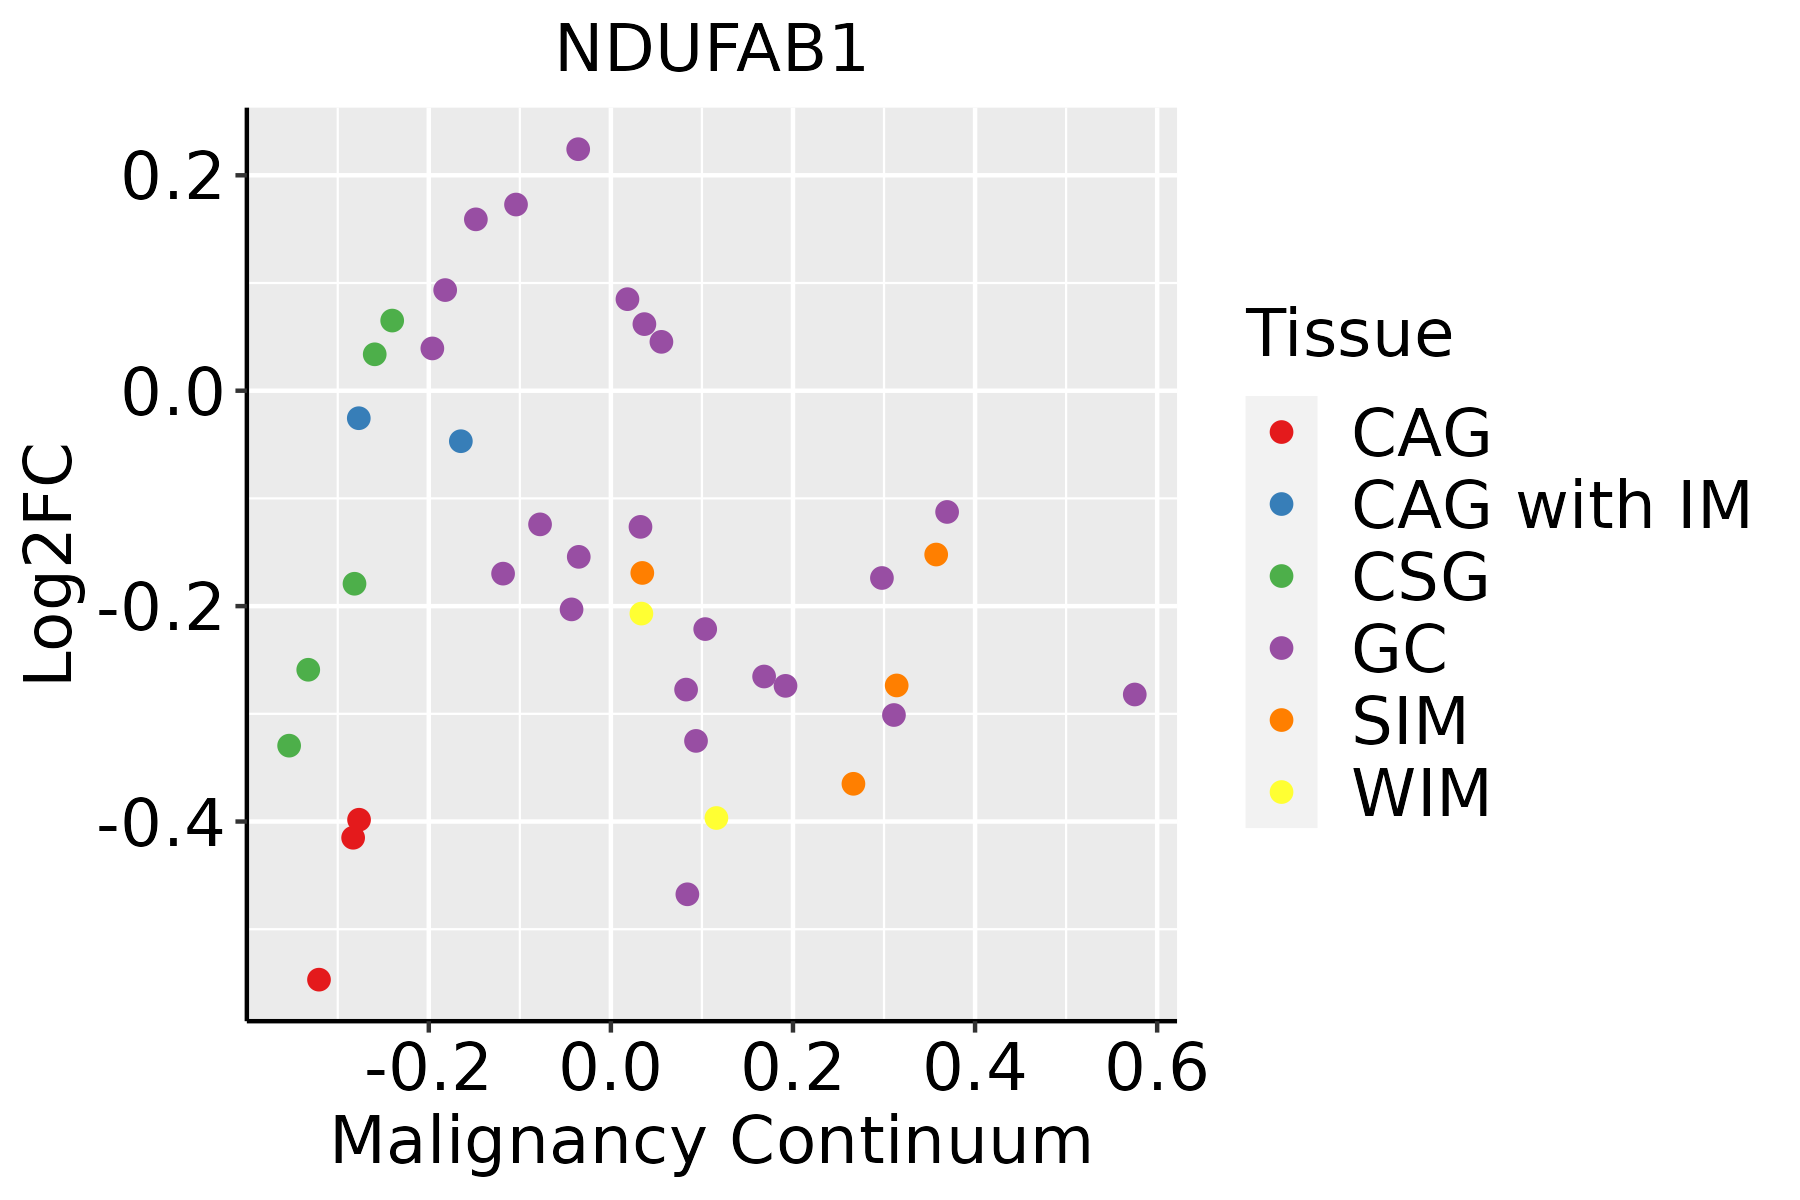 | CAG: Chronic atrophic gastritis |
| CAG with IM: Chronic atrophic gastritis with intestinal metaplasia | ||
| CSG: Chronic superficial gastritis | ||
| GC: Gastric cancer | ||
| SIM: Severe intestinal metaplasia | ||
| WIM: Wild intestinal metaplasia | ||
| Liver | 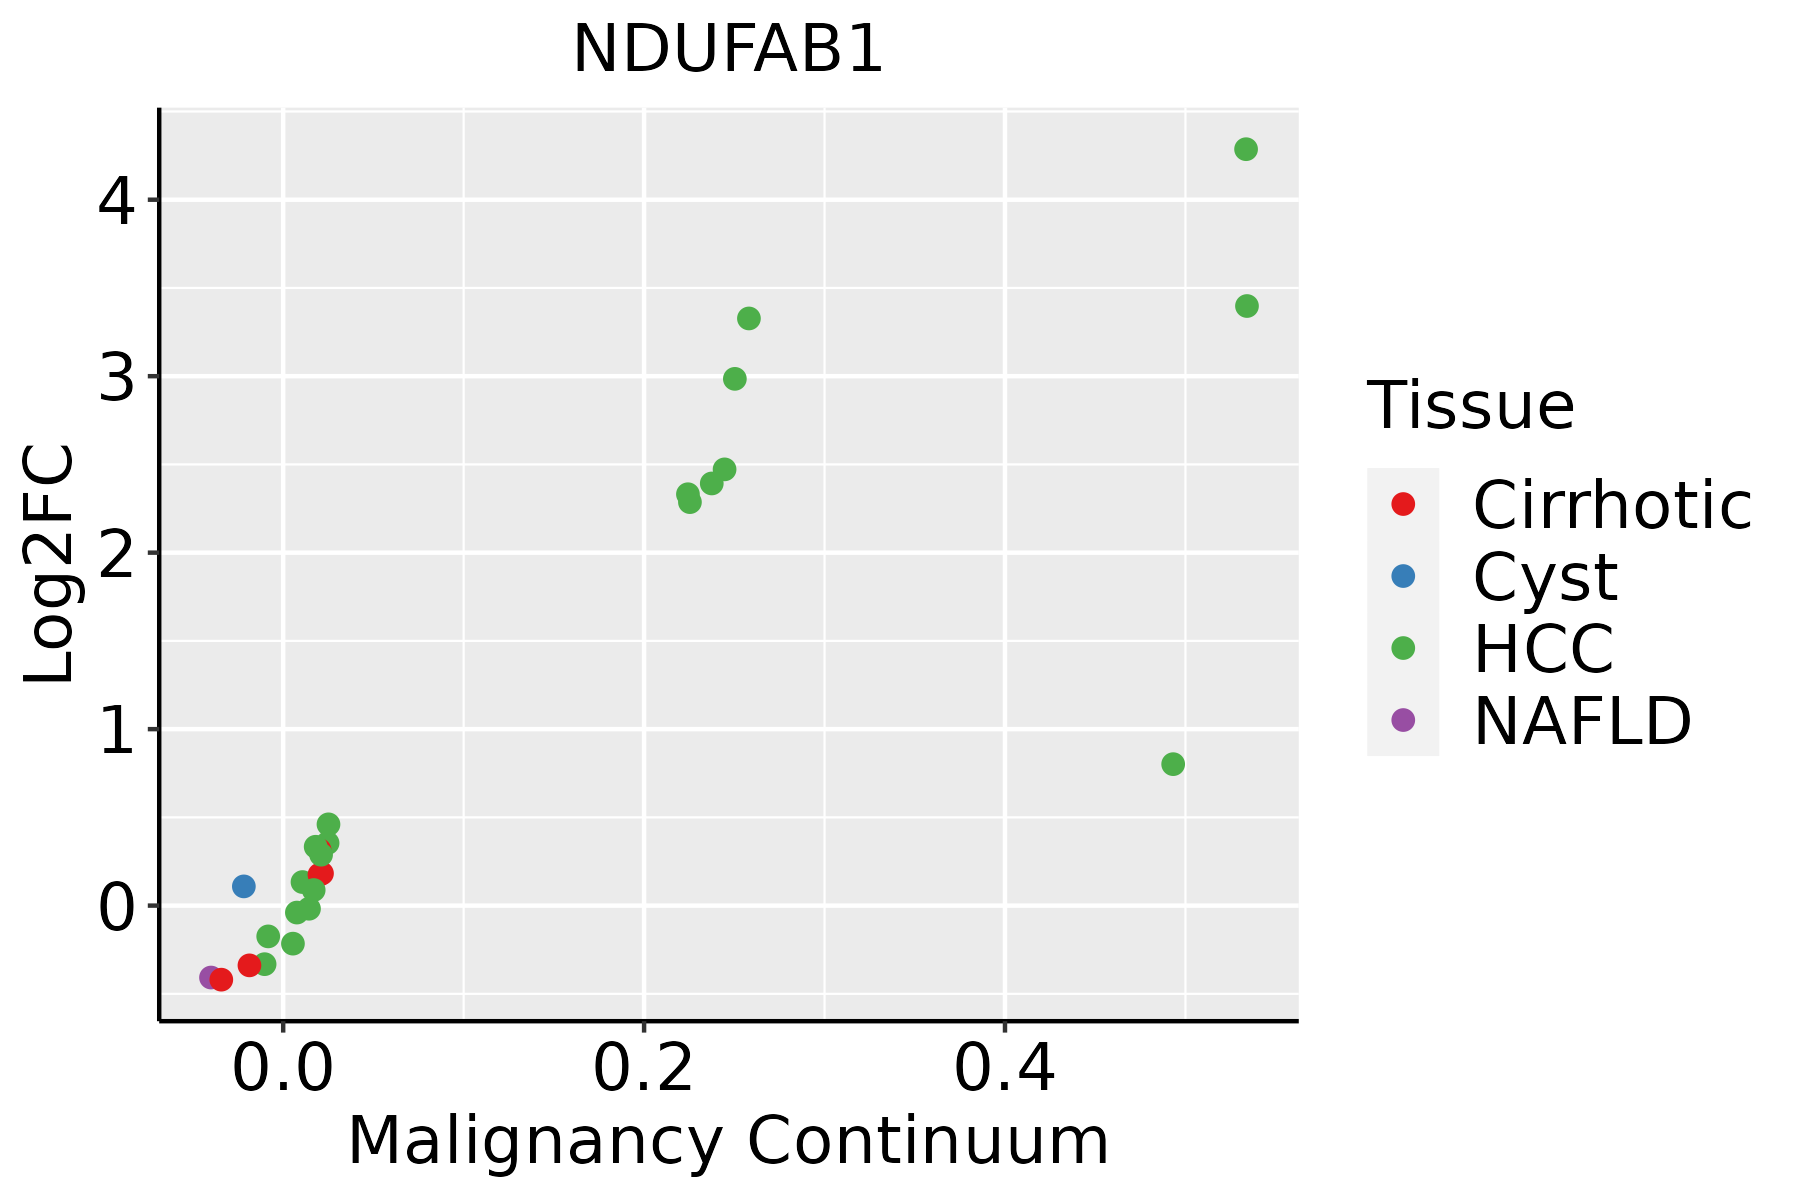 | HCC: Hepatocellular carcinoma |
| NAFLD: Non-alcoholic fatty liver disease | ||
| Oral Cavity | 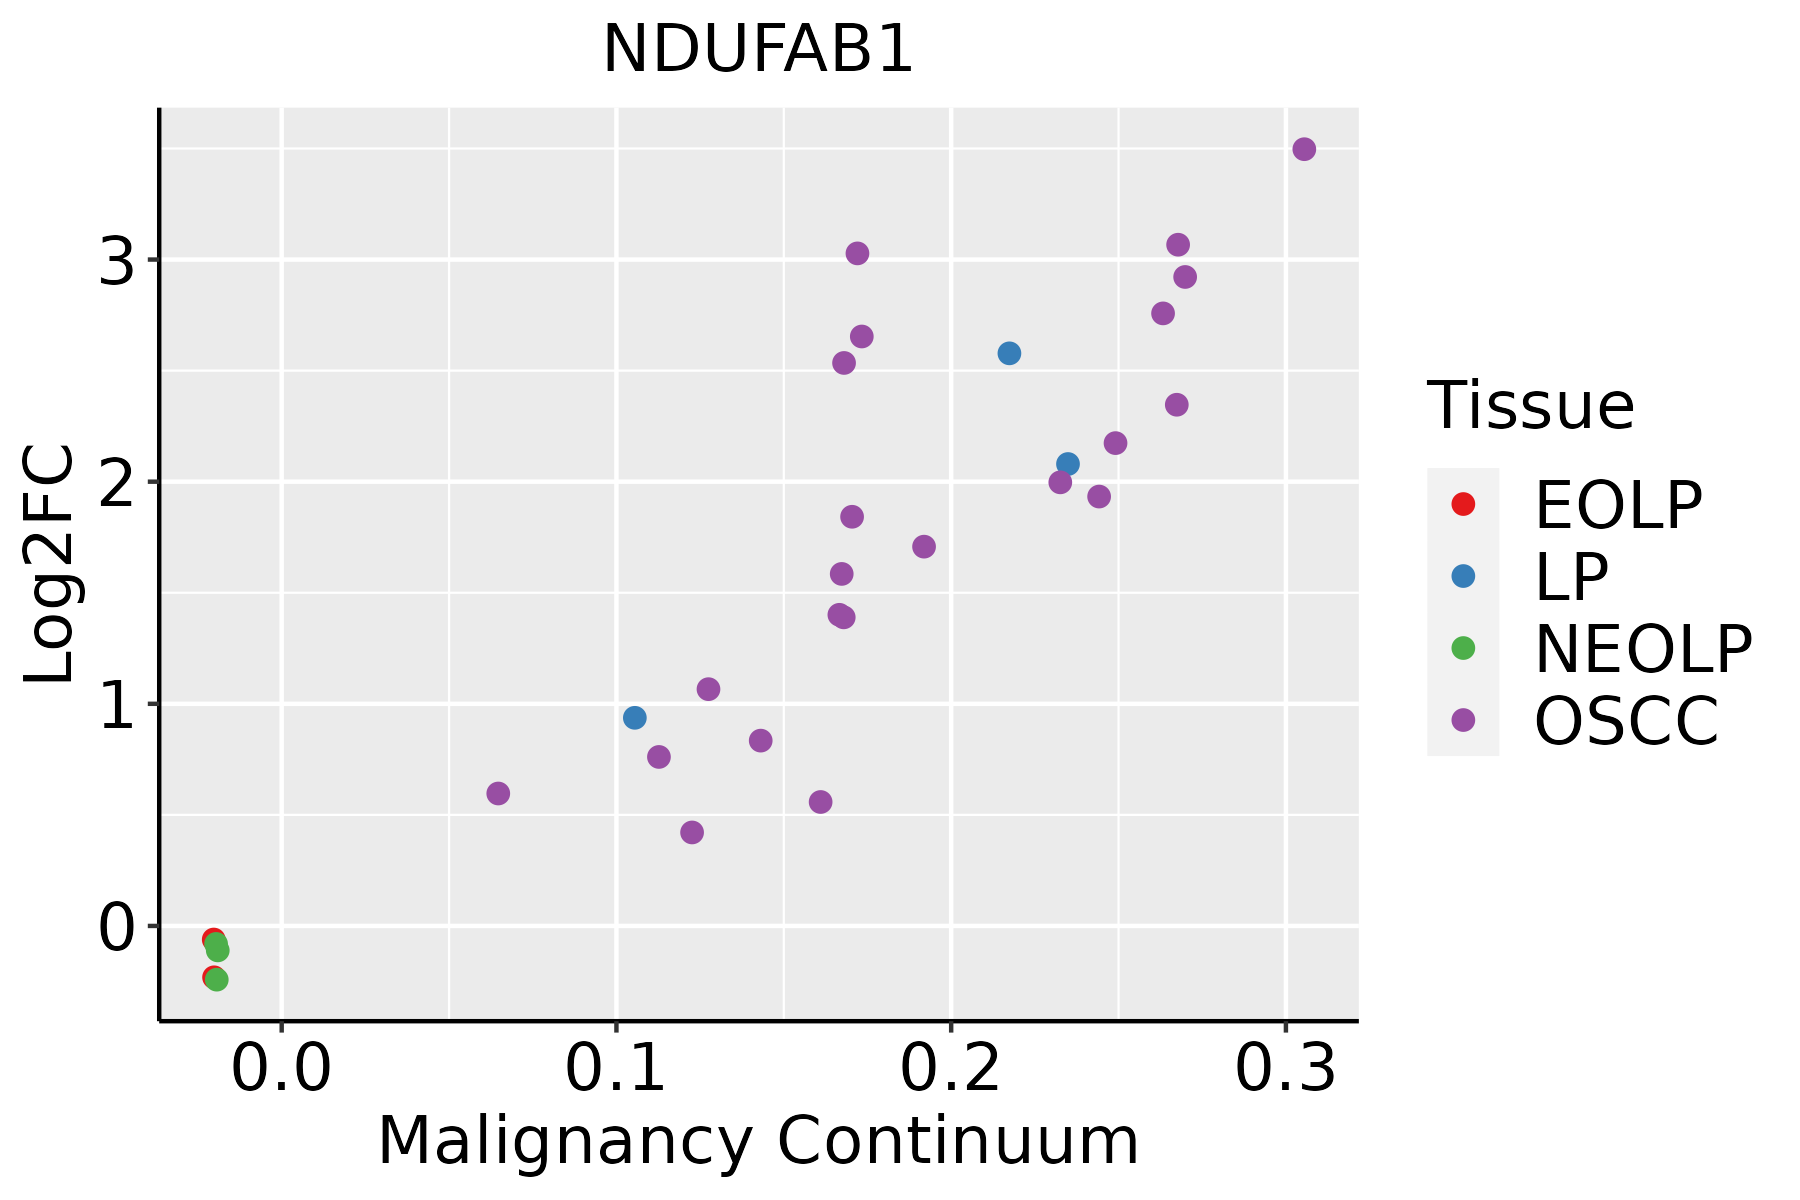 | EOLP: Erosive Oral lichen planus |
| LP: leukoplakia | ||
| NEOLP: Non-erosive oral lichen planus | ||
| OSCC: Oral squamous cell carcinoma | ||
| Prostate | 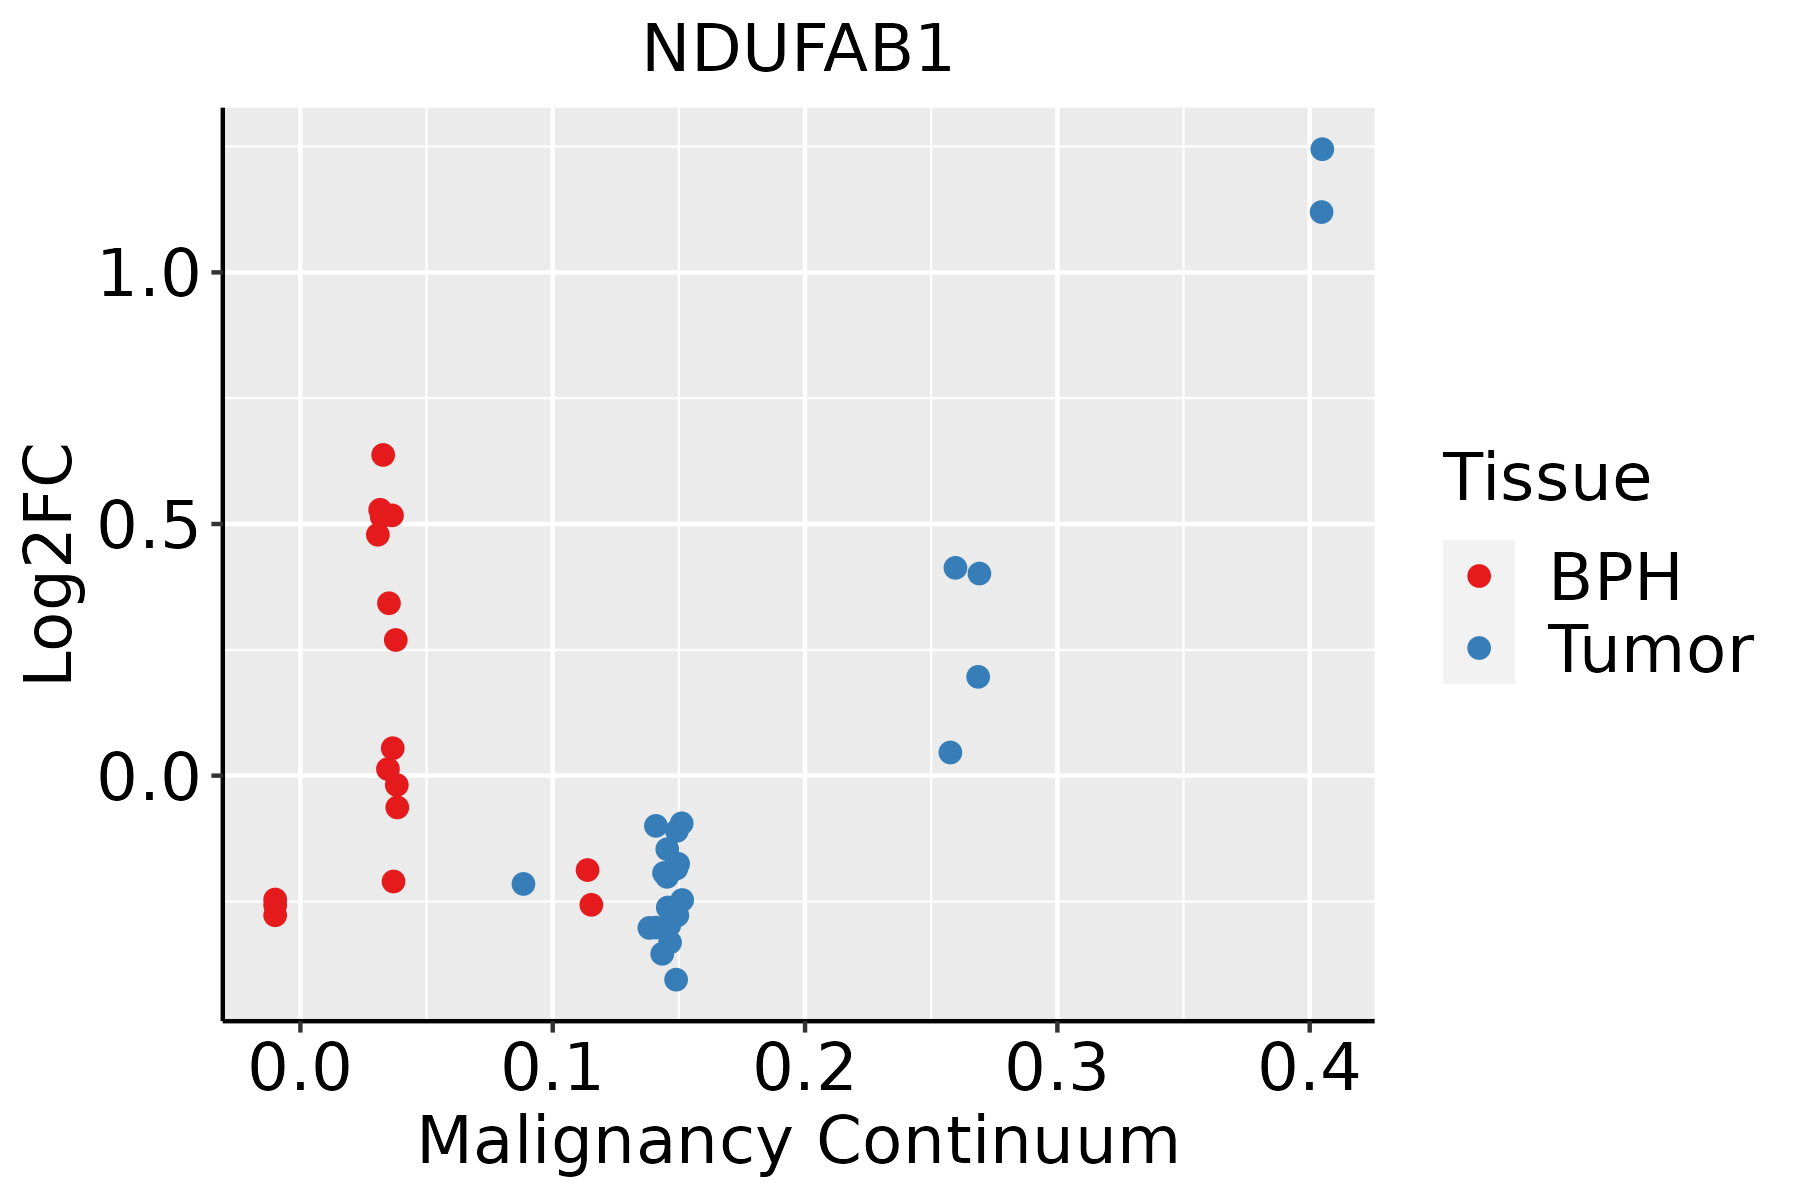 | BPH: Benign Prostatic Hyperplasia |
| Skin | 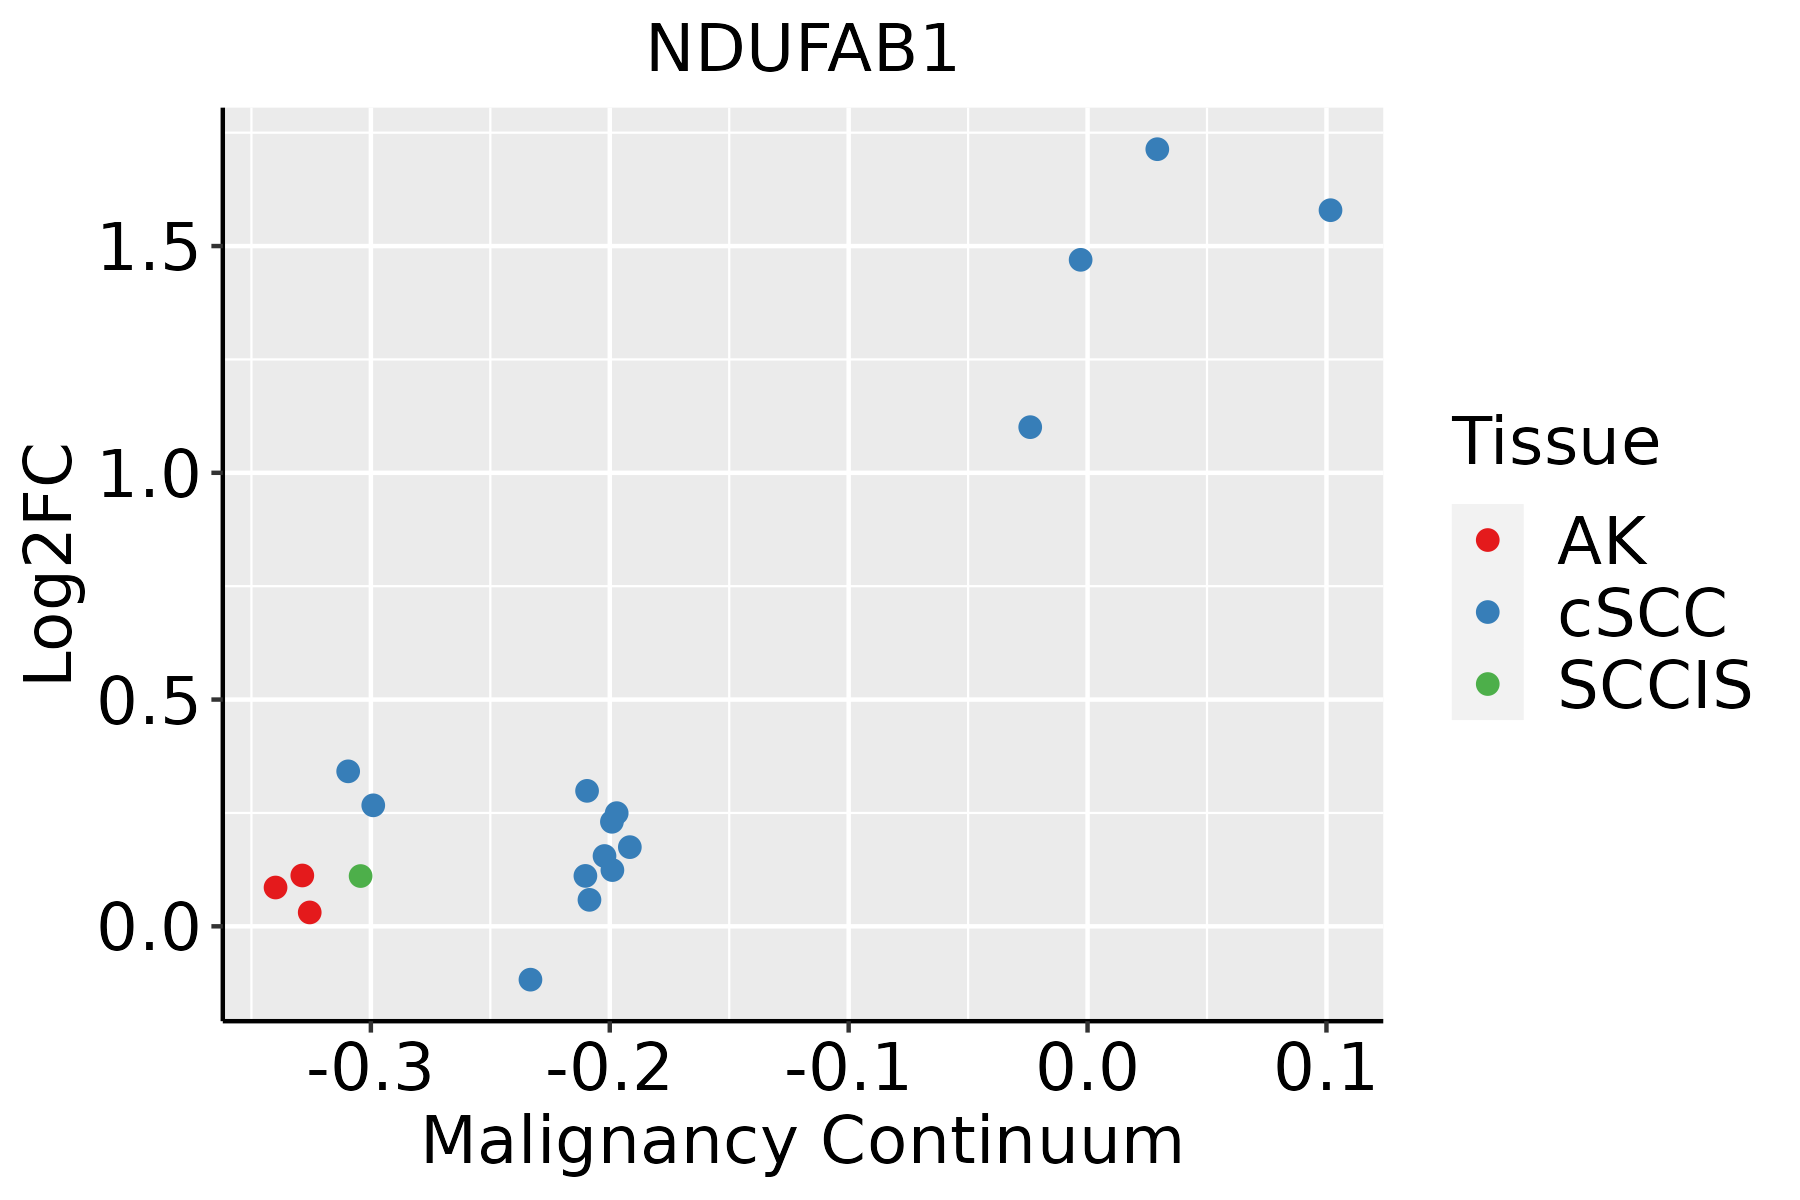 | AK: Actinic keratosis |
| cSCC: Cutaneous squamous cell carcinoma | ||
| SCCIS:squamous cell carcinoma in situ | ||
| Thyroid | 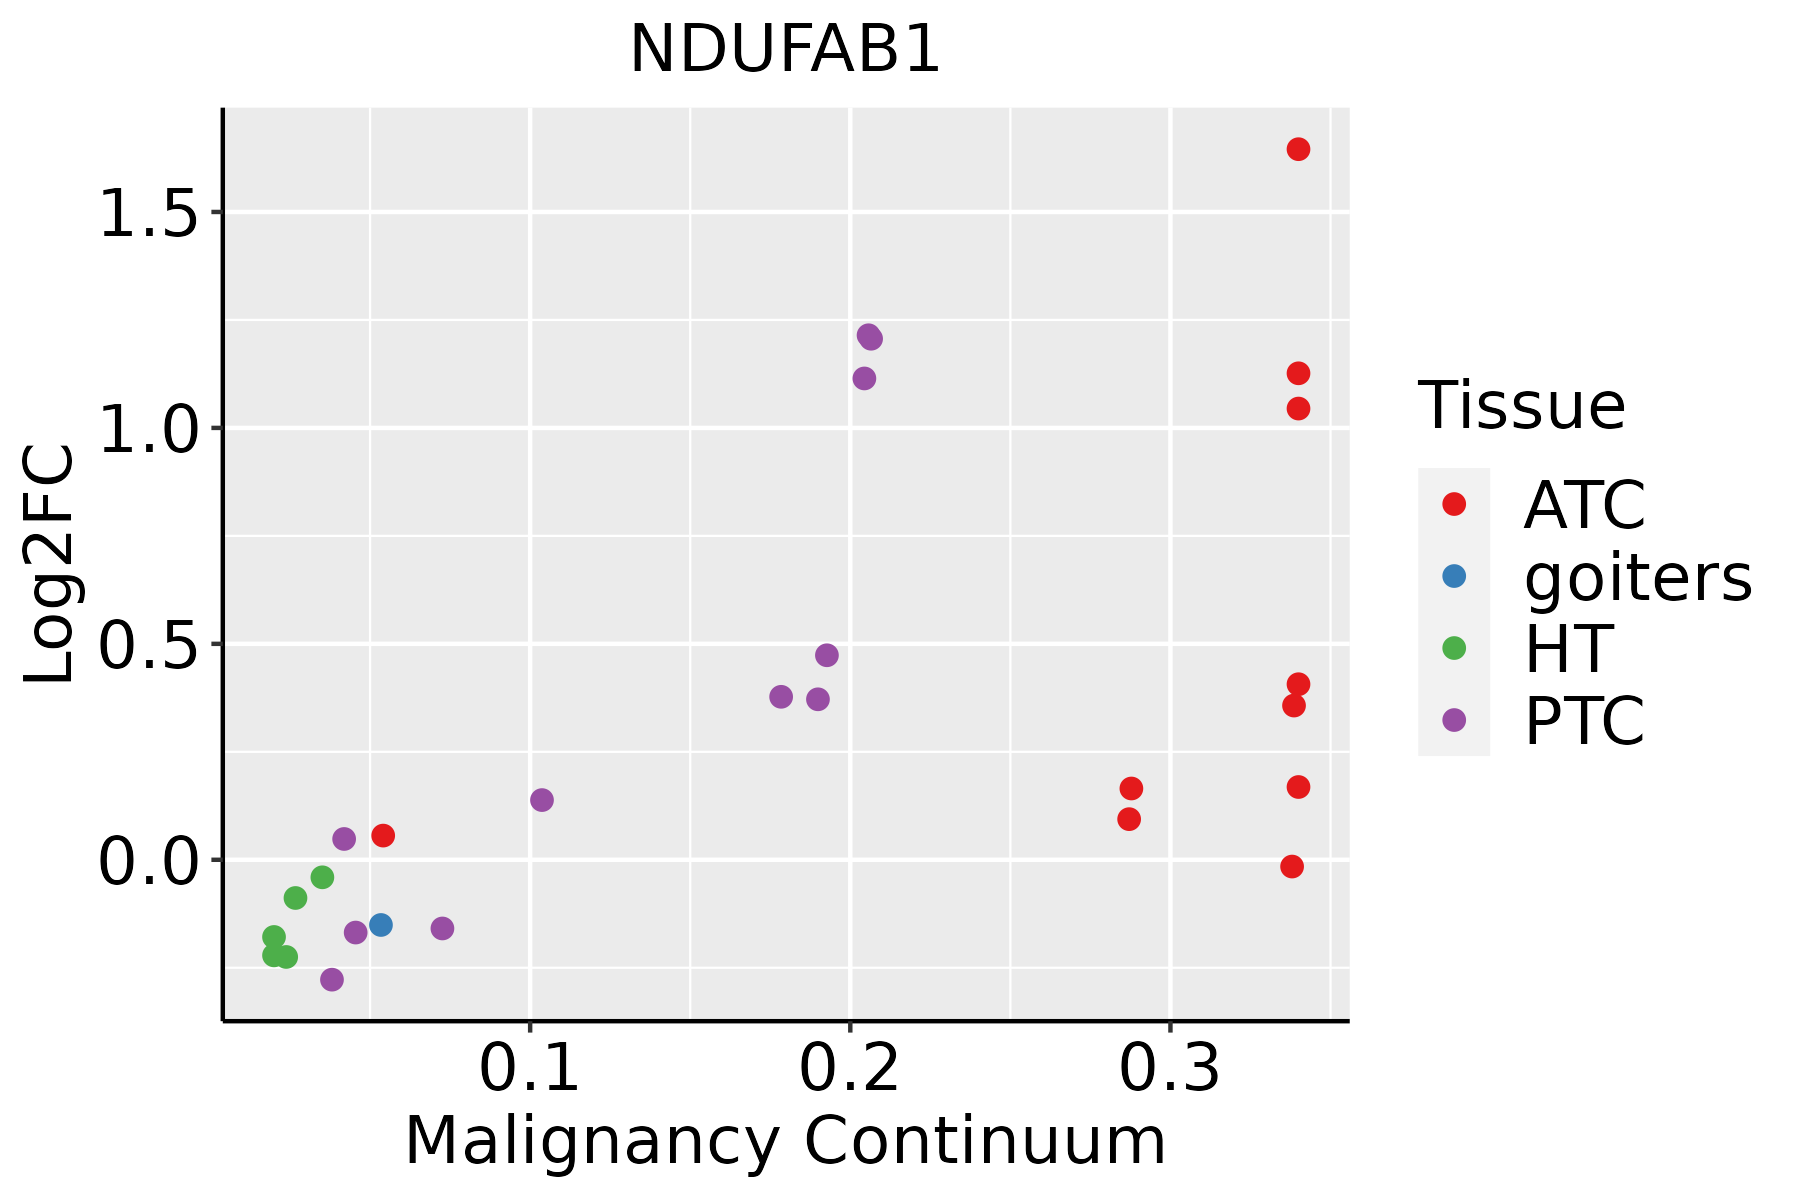 | ATC: Anaplastic thyroid cancer |
| HT: Hashimoto's thyroiditis | ||
| PTC: Papillary thyroid cancer |
| ∗log2FC in expression of this searched gene in stem-like cells from each diseased tissue sample relative to stem-like cells in normal samples in each tissue plotted against the malignancy continuum. Samples are colored based on if they are from different disease stage. |
Top |
Malignant transformation related pathway analysis |
| Find out the enriched GO biological processes and KEGG pathways involved in transition from healthy to precancer to cancer |
| Tissue | Disease Stage | Enriched GO biological Processes |
| Colorectum | AD |  |
| Colorectum | SER |  |
| Colorectum | MSS |  |
| Colorectum | MSI-H |  |
| Colorectum | FAP |  |
| ∗Top 15 enriched GO BP terms are showed in the bar plot of each disease state in each tissue. Each row represents a significant GO biological process which is colored according to the -log10(p.adjust). |
| Page: 1 2 3 4 5 6 7 8 9 |
| GO ID | Tissue | Disease Stage | Description | Gene Ratio | Bg Ratio | pvalue | p.adjust | Count |
| GO:00460349 | Breast | Precancer | ATP metabolic process | 82/1080 | 277/18723 | 1.94e-36 | 5.19e-33 | 82 |
| GO:00061199 | Breast | Precancer | oxidative phosphorylation | 53/1080 | 141/18723 | 1.15e-29 | 2.04e-26 | 53 |
| GO:00090608 | Breast | Precancer | aerobic respiration | 58/1080 | 189/18723 | 5.69e-27 | 7.62e-24 | 58 |
| GO:00060918 | Breast | Precancer | generation of precursor metabolites and energy | 94/1080 | 490/18723 | 1.54e-25 | 1.64e-22 | 94 |
| GO:00453338 | Breast | Precancer | cellular respiration | 59/1080 | 230/18723 | 5.97e-23 | 5.32e-20 | 59 |
| GO:00159808 | Breast | Precancer | energy derivation by oxidation of organic compounds | 70/1080 | 318/18723 | 8.33e-23 | 6.37e-20 | 70 |
| GO:00196468 | Breast | Precancer | aerobic electron transport chain | 34/1080 | 87/18723 | 3.95e-20 | 2.64e-17 | 34 |
| GO:00427738 | Breast | Precancer | ATP synthesis coupled electron transport | 35/1080 | 95/18723 | 1.08e-19 | 5.76e-17 | 35 |
| GO:00427758 | Breast | Precancer | mitochondrial ATP synthesis coupled electron transport | 35/1080 | 95/18723 | 1.08e-19 | 5.76e-17 | 35 |
| GO:00229048 | Breast | Precancer | respiratory electron transport chain | 35/1080 | 114/18723 | 8.51e-17 | 3.26e-14 | 35 |
| GO:00229008 | Breast | Precancer | electron transport chain | 42/1080 | 175/18723 | 1.37e-15 | 4.59e-13 | 42 |
| GO:00061208 | Breast | Precancer | mitochondrial electron transport, NADH to ubiquinone | 19/1080 | 51/18723 | 2.05e-11 | 2.49e-09 | 19 |
| GO:00102578 | Breast | Precancer | NADH dehydrogenase complex assembly | 19/1080 | 57/18723 | 1.93e-10 | 1.92e-08 | 19 |
| GO:00329818 | Breast | Precancer | mitochondrial respiratory chain complex I assembly | 19/1080 | 57/18723 | 1.93e-10 | 1.92e-08 | 19 |
| GO:00331088 | Breast | Precancer | mitochondrial respiratory chain complex assembly | 24/1080 | 93/18723 | 3.39e-10 | 3.16e-08 | 24 |
| GO:00463946 | Breast | Precancer | carboxylic acid biosynthetic process | 32/1080 | 314/18723 | 1.30e-03 | 1.38e-02 | 32 |
| GO:00723304 | Breast | Precancer | monocarboxylic acid biosynthetic process | 24/1080 | 214/18723 | 1.41e-03 | 1.48e-02 | 24 |
| GO:00160536 | Breast | Precancer | organic acid biosynthetic process | 32/1080 | 316/18723 | 1.44e-03 | 1.50e-02 | 32 |
| GO:00066335 | Breast | Precancer | fatty acid biosynthetic process | 19/1080 | 163/18723 | 2.74e-03 | 2.42e-02 | 19 |
| GO:00516047 | Breast | Precancer | protein maturation | 28/1080 | 294/18723 | 6.45e-03 | 4.50e-02 | 28 |
| Page: 1 2 3 4 5 6 7 8 9 10 11 12 13 14 15 16 17 18 19 20 21 22 23 24 25 26 27 |
| Pathway ID | Tissue | Disease Stage | Description | Gene Ratio | Bg Ratio | pvalue | p.adjust | qvalue | Count |
| hsa0501471 | Stomach | CAG | Amyotrophic lateral sclerosis | 46/368 | 364/8465 | 3.68e-11 | 1.06e-09 | 8.52e-10 | 46 |
| hsa0501671 | Stomach | CAG | Huntington disease | 41/368 | 306/8465 | 7.51e-11 | 1.97e-09 | 1.58e-09 | 41 |
| hsa0502271 | Stomach | CAG | Pathways of neurodegeneration - multiple diseases | 46/368 | 476/8465 | 2.08e-07 | 3.75e-06 | 3.01e-06 | 46 |
| hsa0471471 | Stomach | CAG | Thermogenesis | 29/368 | 232/8465 | 2.41e-07 | 4.10e-06 | 3.28e-06 | 29 |
| hsa0501071 | Stomach | CAG | Alzheimer disease | 38/368 | 384/8465 | 1.45e-06 | 2.10e-05 | 1.68e-05 | 38 |
| hsa0472371 | Stomach | CAG | Retrograde endocannabinoid signaling | 16/368 | 148/8465 | 6.75e-04 | 5.74e-03 | 4.60e-03 | 16 |
| hsa05208101 | Stomach | SIM | Chemical carcinogenesis - reactive oxygen species | 48/465 | 223/8465 | 8.30e-17 | 8.41e-15 | 6.75e-15 | 48 |
| hsa0501210 | Stomach | SIM | Parkinson disease | 52/465 | 266/8465 | 3.04e-16 | 2.31e-14 | 1.86e-14 | 52 |
| hsa0493210 | Stomach | SIM | Non-alcoholic fatty liver disease | 38/465 | 155/8465 | 1.79e-15 | 1.09e-13 | 8.74e-14 | 38 |
| hsa0502010 | Stomach | SIM | Prion disease | 50/465 | 273/8465 | 1.83e-14 | 9.28e-13 | 7.45e-13 | 50 |
| hsa0019010 | Stomach | SIM | Oxidative phosphorylation | 32/465 | 134/8465 | 7.12e-13 | 3.09e-11 | 2.49e-11 | 32 |
| hsa0501610 | Stomach | SIM | Huntington disease | 50/465 | 306/8465 | 1.79e-12 | 6.79e-11 | 5.45e-11 | 50 |
| hsa0541510 | Stomach | SIM | Diabetic cardiomyopathy | 38/465 | 203/8465 | 1.53e-11 | 4.64e-10 | 3.72e-10 | 38 |
| hsa0501410 | Stomach | SIM | Amyotrophic lateral sclerosis | 53/465 | 364/8465 | 3.68e-11 | 1.02e-09 | 8.16e-10 | 53 |
| hsa0471410 | Stomach | SIM | Thermogenesis | 36/465 | 232/8465 | 1.13e-08 | 2.85e-07 | 2.29e-07 | 36 |
| hsa0502210 | Stomach | SIM | Pathways of neurodegeneration - multiple diseases | 55/465 | 476/8465 | 8.30e-08 | 1.66e-06 | 1.34e-06 | 55 |
| hsa0501010 | Stomach | SIM | Alzheimer disease | 47/465 | 384/8465 | 1.42e-07 | 2.40e-06 | 1.93e-06 | 47 |
| hsa0472310 | Stomach | SIM | Retrograde endocannabinoid signaling | 19/465 | 148/8465 | 4.53e-04 | 4.05e-03 | 3.25e-03 | 19 |
| hsa05208111 | Stomach | SIM | Chemical carcinogenesis - reactive oxygen species | 48/465 | 223/8465 | 8.30e-17 | 8.41e-15 | 6.75e-15 | 48 |
| hsa0501211 | Stomach | SIM | Parkinson disease | 52/465 | 266/8465 | 3.04e-16 | 2.31e-14 | 1.86e-14 | 52 |
| Page: 1 2 3 4 5 6 7 8 9 10 11 12 13 14 15 16 17 18 19 20 21 22 23 24 25 26 27 28 29 30 31 |
Top |
Cell-cell communication analysis |
| Identification of potential cell-cell interactions between two cell types and their ligand-receptor pairs for different disease states |
| Ligand | Receptor | LRpair | Pathway | Tissue | Disease Stage |
| Page: 1 |
Top |
Single-cell gene regulatory network inference analysis |
| Find out the significant the regulons (TFs) and the target genes of each regulon across cell types for different disease states |
| TF | Cell Type | Tissue | Disease Stage | Target Gene | RSS | Regulon Activity |
| ∗The dot plots of a searched regulon are shown for all cell subpopulations in each disease state of each tissue based on the regulon specific score inferred using pySCENIC and by calculating the average expression. |
| Page: 1 |
Top |
Somatic mutation of malignant transformation related genes |
| Annotation of somatic variants for genes involved in malignant transformation |
| Hugo Symbol | Variant Class | Variant Classification | dbSNP RS | HGVSc | HGVSp | HGVSp Short | SWISSPROT | BIOTYPE | SIFT | PolyPhen | Tumor Sample Barcode | Tissue | Histology | Sex | Age | Stage | Therapy Types | Drugs | Outcome |
| NDUFAB1 | SNV | Missense_Mutation | c.286G>A | p.Glu96Lys | p.E96K | O14561 | protein_coding | tolerated(0.06) | benign(0.1) | TCGA-A8-A095-01 | Breast | breast invasive carcinoma | Female | <65 | I/II | Chemotherapy | 5-fluorouracil | CR | |
| NDUFAB1 | SNV | Missense_Mutation | novel | c.194N>A | p.Cys65Tyr | p.C65Y | O14561 | protein_coding | tolerated(0.15) | benign(0.009) | TCGA-AR-A0TS-01 | Breast | breast invasive carcinoma | Female | <65 | I/II | Chemotherapy | doxorubicin | SD |
| NDUFAB1 | SNV | Missense_Mutation | c.231G>C | p.Glu77Asp | p.E77D | O14561 | protein_coding | tolerated(0.3) | benign(0.005) | TCGA-AR-A24H-01 | Breast | breast invasive carcinoma | Female | >=65 | I/II | Hormone Therapy | tamoxiphen | SD | |
| NDUFAB1 | SNV | Missense_Mutation | novel | c.461T>C | p.Val154Ala | p.V154A | O14561 | protein_coding | deleterious(0.04) | probably_damaging(0.987) | TCGA-CA-6717-01 | Colorectum | colon adenocarcinoma | Male | <65 | I/II | Chemotherapy | oxaliplatin | CR |
| NDUFAB1 | SNV | Missense_Mutation | c.136G>A | p.Gly46Arg | p.G46R | O14561 | protein_coding | tolerated(0.26) | benign(0.001) | TCGA-CK-6746-01 | Colorectum | colon adenocarcinoma | Female | >=65 | I/II | Unknown | Unknown | SD | |
| NDUFAB1 | SNV | Missense_Mutation | rs776920868 | c.256N>A | p.Val86Ile | p.V86I | O14561 | protein_coding | tolerated(0.08) | possibly_damaging(0.647) | TCGA-F5-6814-01 | Colorectum | rectum adenocarcinoma | Male | <65 | I/II | Unknown | Unknown | SD |
| NDUFAB1 | SNV | Missense_Mutation | rs75847980 | c.301N>G | p.Asn101Asp | p.N101D | O14561 | protein_coding | tolerated(0.38) | benign(0.001) | TCGA-AP-A0LM-01 | Endometrium | uterine corpus endometrioid carcinoma | Female | <65 | III/IV | Chemotherapy | cisplatin | SD |
| NDUFAB1 | SNV | Missense_Mutation | novel | c.218N>A | p.Pro73His | p.P73H | O14561 | protein_coding | deleterious(0) | benign(0.336) | TCGA-AX-A06F-01 | Endometrium | uterine corpus endometrioid carcinoma | Female | <65 | III/IV | Chemotherapy | carboplatin | SD |
| NDUFAB1 | SNV | Missense_Mutation | novel | c.212T>C | p.Met71Thr | p.M71T | O14561 | protein_coding | tolerated(0.48) | benign(0) | TCGA-AX-A3FT-01 | Endometrium | uterine corpus endometrioid carcinoma | Female | <65 | I/II | Unknown | Unknown | SD |
| NDUFAB1 | SNV | Missense_Mutation | c.322N>A | p.Leu108Met | p.L108M | O14561 | protein_coding | deleterious(0.02) | probably_damaging(0.996) | TCGA-B5-A11E-01 | Endometrium | uterine corpus endometrioid carcinoma | Female | <65 | I/II | Unknown | Unknown | SD |
| Page: 1 2 |
Top |
Related drugs of malignant transformation related genes |
| Identification of chemicals and drugs interact with genes involved in malignant transfromation |
| (DGIdb 4.0) |
| Entrez ID | Symbol | Category | Interaction Types | Drug Claim Name | Drug Name | PMIDs |
| 4706 | NDUFAB1 | NA | inhibitor | CHEMBL3545320 | ME-344 | |
| 4706 | NDUFAB1 | NA | inhibitor | CHEMBL1703 | METFORMIN HYDROCHLORIDE | |
| 4706 | NDUFAB1 | NA | inhibitor | CHEMBL3545135 | NV-128 |
| Page: 1 |

Copyright 2023-Present -The University of Texas Health Science Center at Houston |