| Tissue | Expression Dynamics | Abbreviation |
| Cervix |  | CC: Cervix cancer |
| HSIL_HPV: HPV-infected high-grade squamous intraepithelial lesions |
| N_HPV: HPV-infected normal cervix |
| Esophagus | 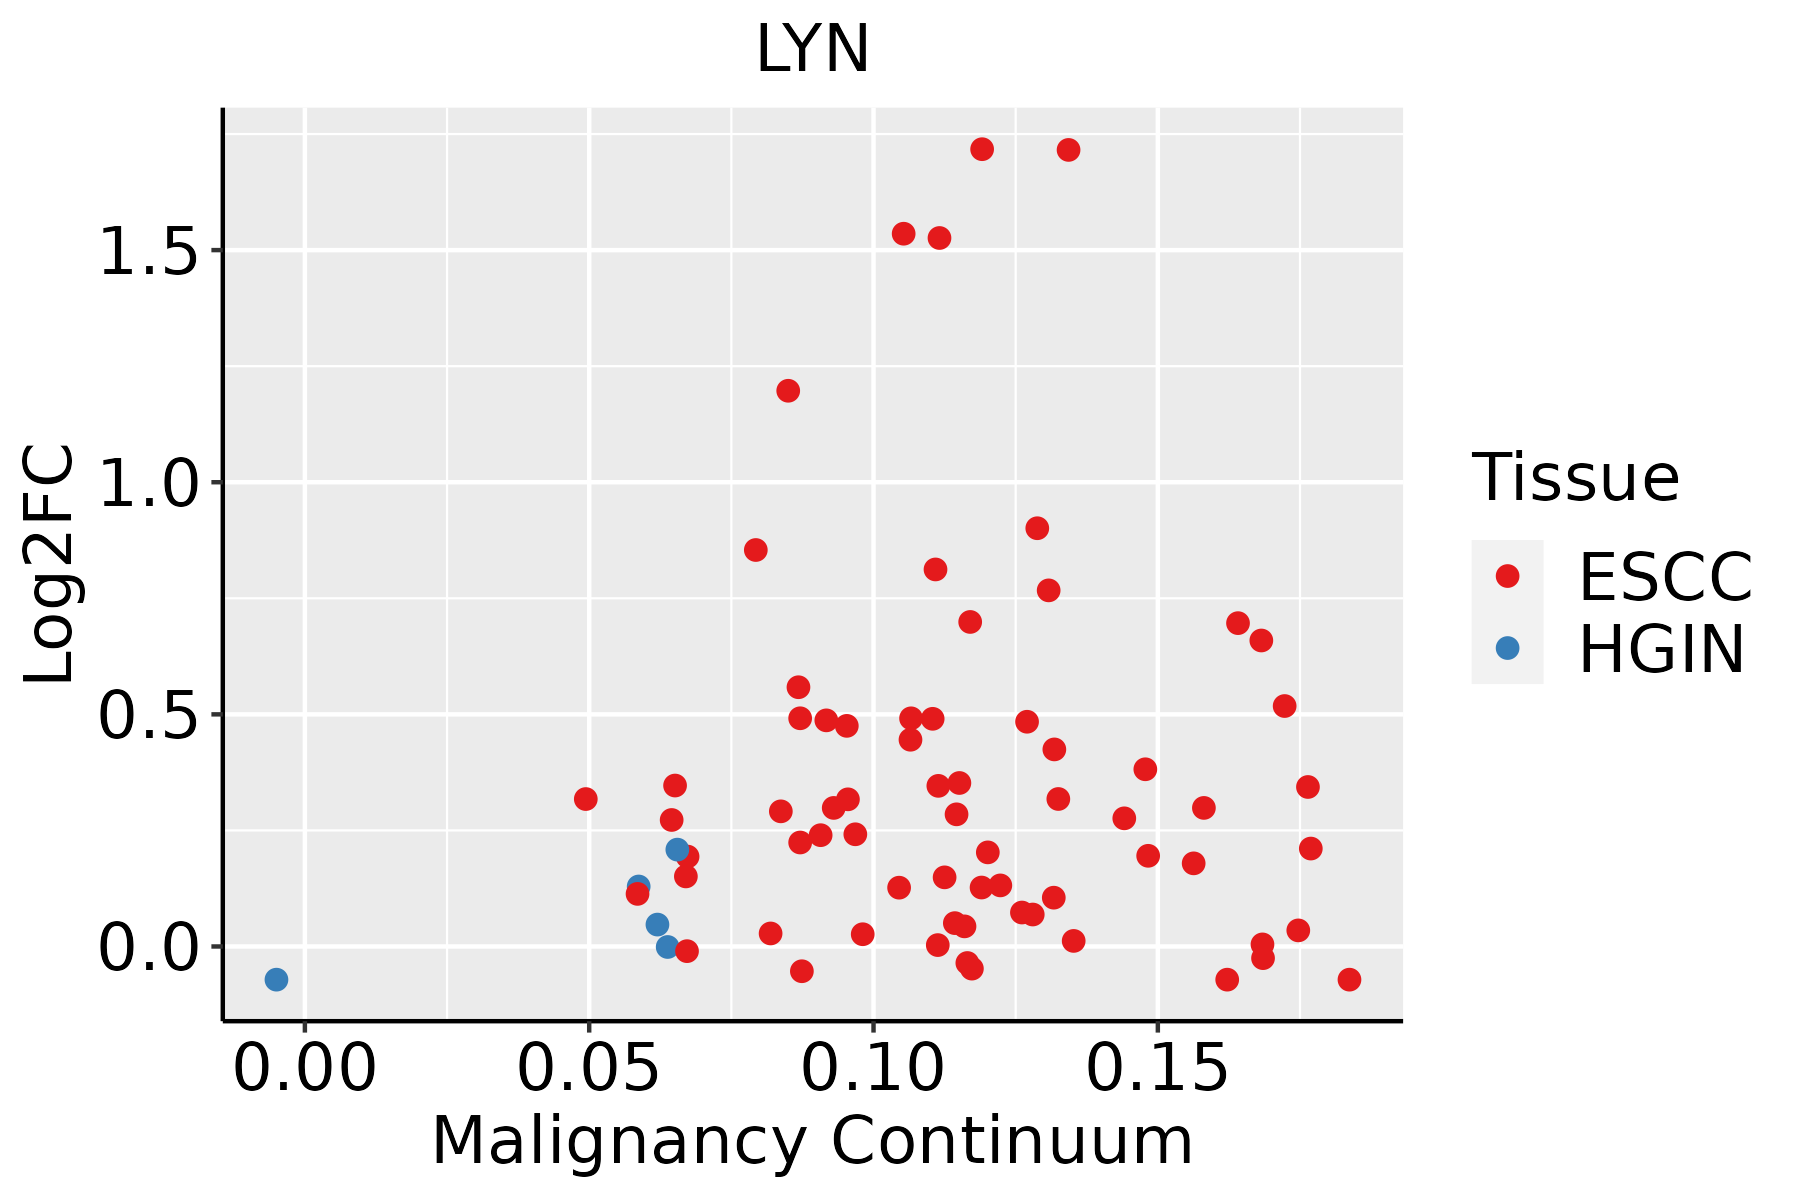 | ESCC: Esophageal squamous cell carcinoma |
| HGIN: High-grade intraepithelial neoplasias |
| LGIN: Low-grade intraepithelial neoplasias |
| Liver |  | HCC: Hepatocellular carcinoma |
| NAFLD: Non-alcoholic fatty liver disease |
| Lung | 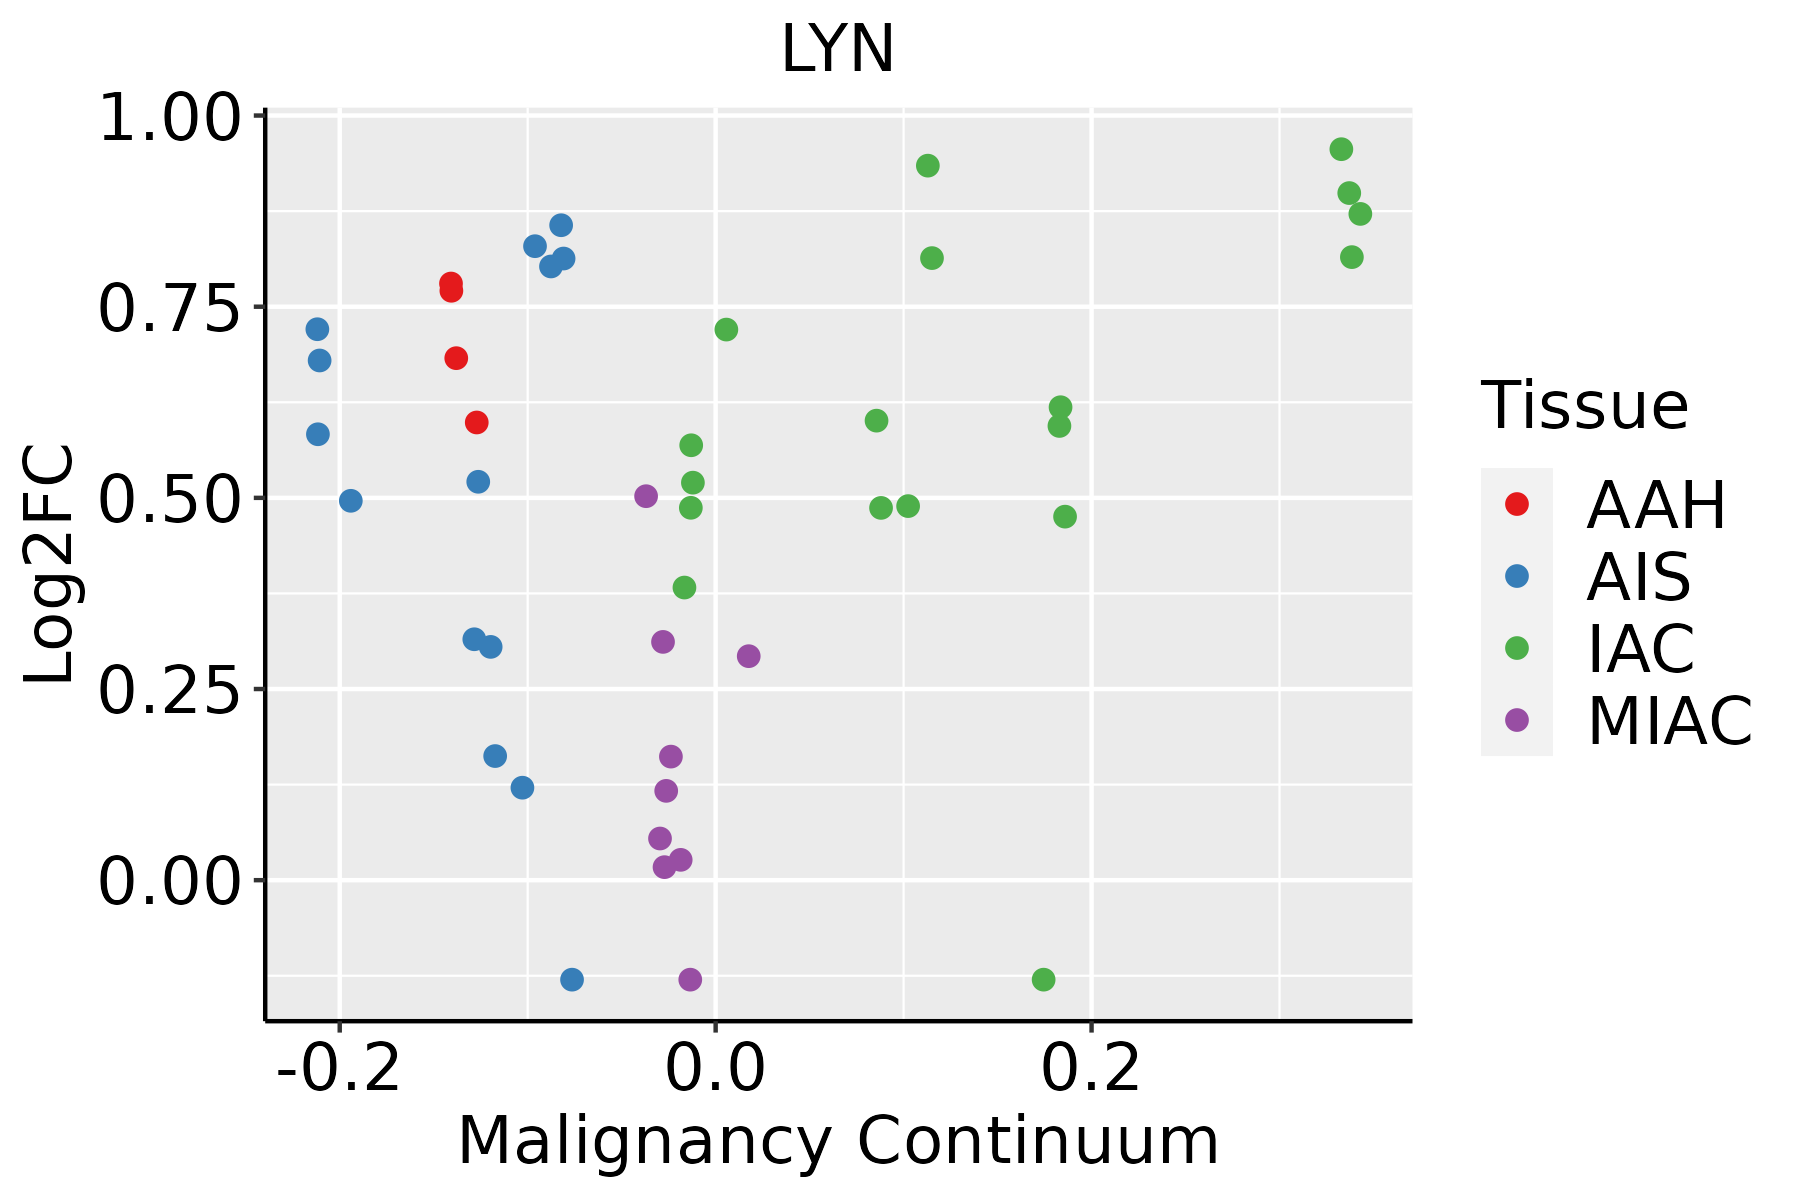 | AAH: Atypical adenomatous hyperplasia |
| AIS: Adenocarcinoma in situ |
| IAC: Invasive lung adenocarcinoma |
| MIA: Minimally invasive adenocarcinoma |
| Oral Cavity | 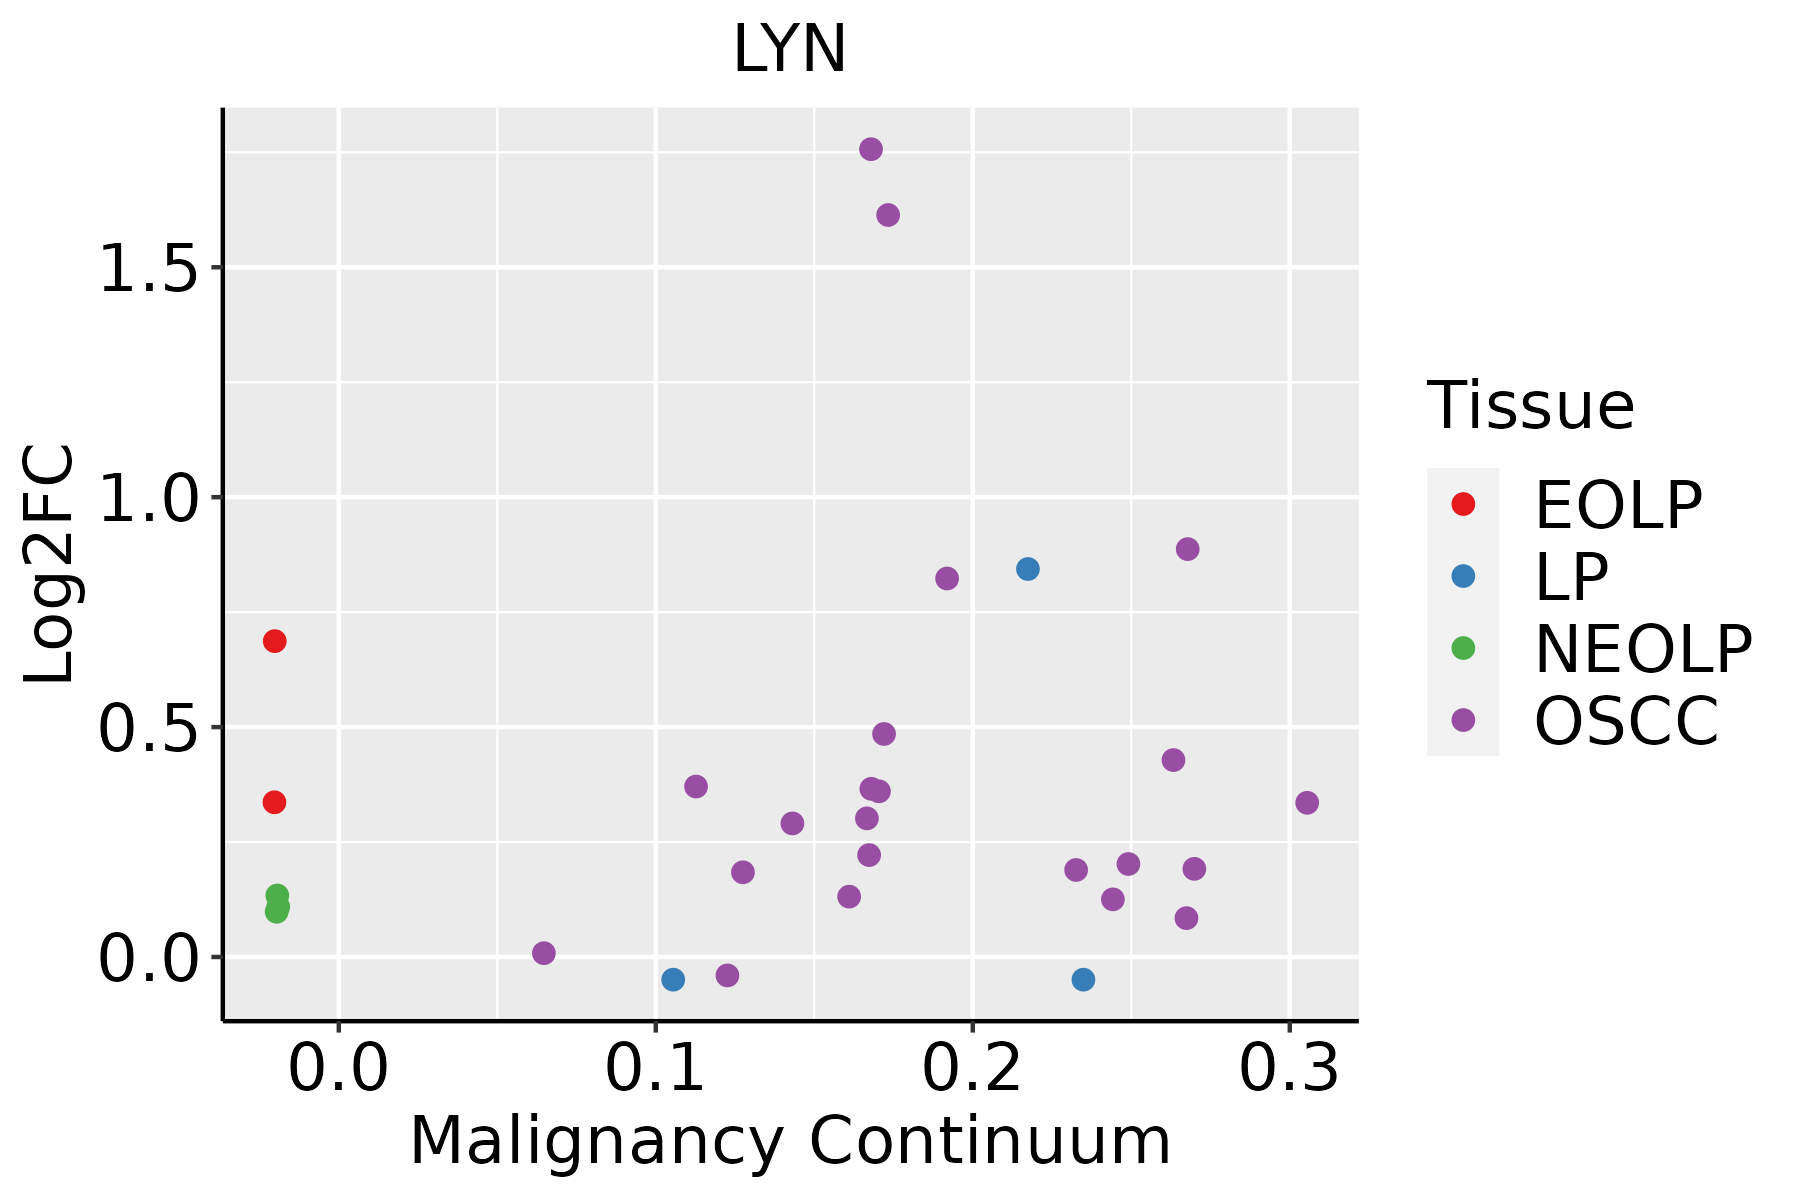 | EOLP: Erosive Oral lichen planus |
| LP: leukoplakia |
| NEOLP: Non-erosive oral lichen planus |
| OSCC: Oral squamous cell carcinoma |
| GO ID | Tissue | Disease Stage | Description | Gene Ratio | Bg Ratio | pvalue | p.adjust | Count |
| GO:004206010 | Cervix | CC | wound healing | 109/2311 | 422/18723 | 1.84e-14 | 1.57e-11 | 109 |
| GO:005254710 | Cervix | CC | regulation of peptidase activity | 112/2311 | 461/18723 | 6.70e-13 | 3.08e-10 | 112 |
| GO:004586210 | Cervix | CC | positive regulation of proteolysis | 95/2311 | 372/18723 | 1.84e-12 | 6.86e-10 | 95 |
| GO:005254810 | Cervix | CC | regulation of endopeptidase activity | 103/2311 | 432/18723 | 1.89e-11 | 5.14e-09 | 103 |
| GO:002240710 | Cervix | CC | regulation of cell-cell adhesion | 103/2311 | 448/18723 | 1.78e-10 | 2.87e-08 | 103 |
| GO:004578510 | Cervix | CC | positive regulation of cell adhesion | 101/2311 | 437/18723 | 1.96e-10 | 3.08e-08 | 101 |
| GO:00421108 | Cervix | CC | T cell activation | 107/2311 | 487/18723 | 1.24e-09 | 1.46e-07 | 107 |
| GO:00508638 | Cervix | CC | regulation of T cell activation | 80/2311 | 329/18723 | 1.28e-09 | 1.47e-07 | 80 |
| GO:007149610 | Cervix | CC | cellular response to external stimulus | 78/2311 | 320/18723 | 1.82e-09 | 1.98e-07 | 78 |
| GO:00512359 | Cervix | CC | maintenance of location | 78/2311 | 327/18723 | 5.18e-09 | 4.92e-07 | 78 |
| GO:00321035 | Cervix | CC | positive regulation of response to external stimulus | 95/2311 | 427/18723 | 5.44e-09 | 5.03e-07 | 95 |
| GO:001095210 | Cervix | CC | positive regulation of peptidase activity | 54/2311 | 197/18723 | 8.06e-09 | 6.99e-07 | 54 |
| GO:00071598 | Cervix | CC | leukocyte cell-cell adhesion | 85/2311 | 371/18723 | 8.27e-09 | 7.07e-07 | 85 |
| GO:003367410 | Cervix | CC | positive regulation of kinase activity | 101/2311 | 467/18723 | 8.66e-09 | 7.22e-07 | 101 |
| GO:00026837 | Cervix | CC | negative regulation of immune system process | 94/2311 | 434/18723 | 2.63e-08 | 1.87e-06 | 94 |
| GO:00603267 | Cervix | CC | cell chemotaxis | 73/2311 | 310/18723 | 2.82e-08 | 1.96e-06 | 73 |
| GO:19030378 | Cervix | CC | regulation of leukocyte cell-cell adhesion | 77/2311 | 336/18723 | 4.08e-08 | 2.54e-06 | 77 |
| GO:005165110 | Cervix | CC | maintenance of location in cell | 55/2311 | 214/18723 | 6.63e-08 | 3.85e-06 | 55 |
| GO:00975298 | Cervix | CC | myeloid leukocyte migration | 56/2311 | 220/18723 | 7.21e-08 | 4.15e-06 | 56 |
| GO:001095010 | Cervix | CC | positive regulation of endopeptidase activity | 48/2311 | 179/18723 | 1.12e-07 | 5.71e-06 | 48 |
| Pathway ID | Tissue | Disease Stage | Description | Gene Ratio | Bg Ratio | pvalue | p.adjust | qvalue | Count |
| hsa0466610 | Liver | HCC | Fc gamma R-mediated phagocytosis | 58/4020 | 97/8465 | 9.65e-03 | 2.52e-02 | 1.40e-02 | 58 |
| hsa0541742 | Liver | HCC | Lipid and atherosclerosis | 118/4020 | 215/8465 | 1.66e-02 | 3.92e-02 | 2.18e-02 | 118 |
| hsa046112 | Liver | HCC | Platelet activation | 71/4020 | 124/8465 | 1.77e-02 | 4.15e-02 | 2.31e-02 | 71 |
| hsa0516931 | Liver | HCC | Epstein-Barr virus infection | 128/4020 | 202/8465 | 3.17e-06 | 2.79e-05 | 1.55e-05 | 128 |
| hsa051203 | Liver | HCC | Epithelial cell signaling in Helicobacter pylori infection | 50/4020 | 70/8465 | 3.96e-05 | 2.16e-04 | 1.20e-04 | 50 |
| hsa052033 | Liver | HCC | Viral carcinogenesis | 117/4020 | 204/8465 | 2.68e-03 | 8.98e-03 | 5.00e-03 | 117 |
| hsa0516731 | Liver | HCC | Kaposi sarcoma-associated herpesvirus infection | 111/4020 | 194/8465 | 3.78e-03 | 1.16e-02 | 6.45e-03 | 111 |
| hsa0466611 | Liver | HCC | Fc gamma R-mediated phagocytosis | 58/4020 | 97/8465 | 9.65e-03 | 2.52e-02 | 1.40e-02 | 58 |
| hsa0541752 | Liver | HCC | Lipid and atherosclerosis | 118/4020 | 215/8465 | 1.66e-02 | 3.92e-02 | 2.18e-02 | 118 |
| hsa0461111 | Liver | HCC | Platelet activation | 71/4020 | 124/8465 | 1.77e-02 | 4.15e-02 | 2.31e-02 | 71 |
| hsa0516716 | Lung | IAC | Kaposi sarcoma-associated herpesvirus infection | 46/1053 | 194/8465 | 8.58e-06 | 2.14e-04 | 1.42e-04 | 46 |
| hsa0541716 | Lung | IAC | Lipid and atherosclerosis | 48/1053 | 215/8465 | 3.02e-05 | 6.14e-04 | 4.08e-04 | 48 |
| hsa051205 | Lung | IAC | Epithelial cell signaling in Helicobacter pylori infection | 20/1053 | 70/8465 | 2.31e-04 | 2.54e-03 | 1.68e-03 | 20 |
| hsa052034 | Lung | IAC | Viral carcinogenesis | 43/1053 | 204/8465 | 3.02e-04 | 3.07e-03 | 2.04e-03 | 43 |
| hsa0516916 | Lung | IAC | Epstein-Barr virus infection | 40/1053 | 202/8465 | 1.72e-03 | 9.66e-03 | 6.41e-03 | 40 |
| hsa046114 | Lung | IAC | Platelet activation | 27/1053 | 124/8465 | 2.34e-03 | 1.23e-02 | 8.14e-03 | 27 |
| hsa0516717 | Lung | IAC | Kaposi sarcoma-associated herpesvirus infection | 46/1053 | 194/8465 | 8.58e-06 | 2.14e-04 | 1.42e-04 | 46 |
| hsa0541717 | Lung | IAC | Lipid and atherosclerosis | 48/1053 | 215/8465 | 3.02e-05 | 6.14e-04 | 4.08e-04 | 48 |
| hsa0512012 | Lung | IAC | Epithelial cell signaling in Helicobacter pylori infection | 20/1053 | 70/8465 | 2.31e-04 | 2.54e-03 | 1.68e-03 | 20 |
| hsa0520311 | Lung | IAC | Viral carcinogenesis | 43/1053 | 204/8465 | 3.02e-04 | 3.07e-03 | 2.04e-03 | 43 |
| Hugo Symbol | Variant Class | Variant Classification | dbSNP RS | HGVSc | HGVSp | HGVSp Short | SWISSPROT | BIOTYPE | SIFT | PolyPhen | Tumor Sample Barcode | Tissue | Histology | Sex | Age | Stage | Therapy Types | Drugs | Outcome |
| LYN | SNV | Missense_Mutation | | c.475N>A | p.Glu159Lys | p.E159K | P07948 | protein_coding | deleterious(0.01) | probably_damaging(0.987) | TCGA-A1-A0SO-01 | Breast | breast invasive carcinoma | Female | >=65 | I/II | Chemotherapy | | SD |
| LYN | SNV | Missense_Mutation | | c.627N>T | p.Lys209Asn | p.K209N | P07948 | protein_coding | tolerated(0.16) | benign(0.056) | TCGA-A2-A0CT-01 | Breast | breast invasive carcinoma | Female | >=65 | I/II | Chemotherapy | cytoxan | SD |
| LYN | SNV | Missense_Mutation | | c.57N>C | p.Leu19Phe | p.L19F | P07948 | protein_coding | tolerated(0.72) | benign(0.013) | TCGA-AC-A23H-01 | Breast | breast invasive carcinoma | Female | >=65 | I/II | Unknown | Unknown | PD |
| LYN | SNV | Missense_Mutation | novel | c.1096N>T | p.Arg366Trp | p.R366W | P07948 | protein_coding | deleterious(0.01) | probably_damaging(1) | TCGA-AC-A2FM-01 | Breast | breast invasive carcinoma | Female | >=65 | I/II | Unknown | Unknown | PD |
| LYN | SNV | Missense_Mutation | novel | c.1442N>C | p.Lys481Thr | p.K481T | P07948 | protein_coding | deleterious(0.01) | benign(0.432) | TCGA-AN-A046-01 | Breast | breast invasive carcinoma | Female | >=65 | I/II | Unknown | Unknown | SD |
| LYN | SNV | Missense_Mutation | | c.1508N>A | p.Ala503Asp | p.A503D | P07948 | protein_coding | deleterious(0) | probably_damaging(0.949) | TCGA-B6-A0I9-01 | Breast | breast invasive carcinoma | Female | <65 | III/IV | Unknown | Unknown | PD |
| LYN | SNV | Missense_Mutation | | c.1252N>A | p.Gly418Arg | p.G418R | P07948 | protein_coding | deleterious(0) | probably_damaging(0.999) | TCGA-E2-A155-01 | Breast | breast invasive carcinoma | Female | <65 | I/II | Chemotherapy | cytoxan | SD |
| LYN | SNV | Missense_Mutation | novel | c.905N>C | p.Leu302Pro | p.L302P | P07948 | protein_coding | deleterious(0) | probably_damaging(1) | TCGA-2W-A8YY-01 | Cervix | cervical & endocervical cancer | Female | <65 | I/II | Chemotherapy | cisplatin | CR |
| LYN | SNV | Missense_Mutation | | c.20A>T | p.Lys7Ile | p.K7I | P07948 | protein_coding | deleterious(0.01) | possibly_damaging(0.482) | TCGA-DS-A1OC-01 | Cervix | cervical & endocervical cancer | Female | <65 | I/II | Chemotherapy | gemcitabine | SD |
| LYN | SNV | Missense_Mutation | | c.907G>A | p.Val303Met | p.V303M | P07948 | protein_coding | deleterious(0) | probably_damaging(0.945) | TCGA-MA-AA42-01 | Cervix | cervical & endocervical cancer | Female | >=65 | I/II | Unknown | Unknown | SD |
| Entrez ID | Symbol | Category | Interaction Types | Drug Claim Name | Drug Name | PMIDs |
| 4067 | LYN | DRUGGABLE GENOME, KINASE, TYROSINE KINASE, ENZYME, CLINICALLY ACTIONABLE, DRUG RESISTANCE | | CYC-116 | CYC-116 | |
| 4067 | LYN | DRUGGABLE GENOME, KINASE, TYROSINE KINASE, ENZYME, CLINICALLY ACTIONABLE, DRUG RESISTANCE | | ILORASERTIB | ILORASERTIB | |
| 4067 | LYN | DRUGGABLE GENOME, KINASE, TYROSINE KINASE, ENZYME, CLINICALLY ACTIONABLE, DRUG RESISTANCE | | SORAFENIB | SORAFENIB | |
| 4067 | LYN | DRUGGABLE GENOME, KINASE, TYROSINE KINASE, ENZYME, CLINICALLY ACTIONABLE, DRUG RESISTANCE | inhibitor | 178102666 | | |
| 4067 | LYN | DRUGGABLE GENOME, KINASE, TYROSINE KINASE, ENZYME, CLINICALLY ACTIONABLE, DRUG RESISTANCE | | GW459057A | GW459057A | 16890436 |
| 4067 | LYN | DRUGGABLE GENOME, KINASE, TYROSINE KINASE, ENZYME, CLINICALLY ACTIONABLE, DRUG RESISTANCE | inhibitor | NINTEDANIB | NINTEDANIB | |
| 4067 | LYN | DRUGGABLE GENOME, KINASE, TYROSINE KINASE, ENZYME, CLINICALLY ACTIONABLE, DRUG RESISTANCE | | NILOTINIB | NILOTINIB | 18191450 |
| 4067 | LYN | DRUGGABLE GENOME, KINASE, TYROSINE KINASE, ENZYME, CLINICALLY ACTIONABLE, DRUG RESISTANCE | inhibitor | MASITINIB | MASITINIB | |
| 4067 | LYN | DRUGGABLE GENOME, KINASE, TYROSINE KINASE, ENZYME, CLINICALLY ACTIONABLE, DRUG RESISTANCE | | Bafetinib | BAFETINIB | |
| 4067 | LYN | DRUGGABLE GENOME, KINASE, TYROSINE KINASE, ENZYME, CLINICALLY ACTIONABLE, DRUG RESISTANCE | inhibitor | 178103494 | IBRUTINIB | |


