
|
|||||
|
 | |
| |
| |
| |
| |
| |
|
Gene: LAMB1 |
Gene summary for LAMB1 |
| Gene information | Species | Human | Gene symbol | LAMB1 | Gene ID | 3912 |
| Gene name | laminin subunit beta 1 | |
| Gene Alias | CLM | |
| Cytomap | 7q31.1 | |
| Gene Type | protein-coding | GO ID | GO:0000902 | UniProtAcc | P07942 |
Top |
Malignant transformation analysis |
| Identification of the aberrant gene expression in precancerous and cancerous lesions by comparing the gene expression of stem-like cells in diseased tissues with normal stem cells |
| Entrez ID | Symbol | Replicates | Species | Organ | Tissue | Adj P-value | Log2FC | Malignancy |
| 3912 | LAMB1 | HTA11_3410_2000001011 | Human | Colorectum | AD | 8.97e-06 | -4.33e-01 | 0.0155 |
| 3912 | LAMB1 | HTA11_3361_2000001011 | Human | Colorectum | AD | 4.41e-04 | -5.59e-01 | -0.1207 |
| 3912 | LAMB1 | HTA11_696_2000001011 | Human | Colorectum | AD | 5.97e-03 | -3.00e-01 | -0.1464 |
| 3912 | LAMB1 | HTA11_866_2000001011 | Human | Colorectum | AD | 2.41e-07 | -4.43e-01 | -0.1001 |
| 3912 | LAMB1 | HTA11_5212_2000001011 | Human | Colorectum | AD | 1.51e-03 | -7.03e-01 | -0.2061 |
| 3912 | LAMB1 | HTA11_866_3004761011 | Human | Colorectum | AD | 2.82e-02 | -3.92e-01 | 0.096 |
| 3912 | LAMB1 | HTA11_99999973899_84307 | Human | Colorectum | MSS | 4.29e-08 | -7.31e-01 | 0.2585 |
| 3912 | LAMB1 | HTA11_99999974143_84620 | Human | Colorectum | MSS | 8.28e-16 | -5.38e-01 | 0.3005 |
| 3912 | LAMB1 | A001-C-207 | Human | Colorectum | FAP | 3.10e-05 | -2.43e-01 | 0.1278 |
| 3912 | LAMB1 | A015-C-203 | Human | Colorectum | FAP | 2.57e-28 | -5.18e-01 | -0.1294 |
| 3912 | LAMB1 | A015-C-204 | Human | Colorectum | FAP | 1.03e-05 | -2.32e-01 | -0.0228 |
| 3912 | LAMB1 | A002-C-201 | Human | Colorectum | FAP | 1.71e-14 | -3.77e-01 | 0.0324 |
| 3912 | LAMB1 | A002-C-203 | Human | Colorectum | FAP | 6.76e-04 | 2.59e-01 | 0.2786 |
| 3912 | LAMB1 | A001-C-119 | Human | Colorectum | FAP | 7.51e-06 | -2.74e-01 | -0.1557 |
| 3912 | LAMB1 | A001-C-108 | Human | Colorectum | FAP | 6.71e-12 | -5.28e-02 | -0.0272 |
| 3912 | LAMB1 | A002-C-205 | Human | Colorectum | FAP | 1.33e-23 | 5.64e-02 | -0.1236 |
| 3912 | LAMB1 | A001-C-104 | Human | Colorectum | FAP | 4.64e-02 | -1.79e-02 | 0.0184 |
| 3912 | LAMB1 | A015-C-005 | Human | Colorectum | FAP | 4.96e-02 | -3.92e-02 | -0.0336 |
| 3912 | LAMB1 | A015-C-006 | Human | Colorectum | FAP | 2.94e-16 | 1.02e-01 | -0.0994 |
| 3912 | LAMB1 | A015-C-106 | Human | Colorectum | FAP | 1.31e-08 | 3.55e-02 | -0.0511 |
| Page: 1 2 3 4 5 6 7 |
| Tissue | Expression Dynamics | Abbreviation |
| Colorectum (GSE201348) |  | FAP: Familial adenomatous polyposis |
| CRC: Colorectal cancer | ||
| Colorectum (HTA11) |  | AD: Adenomas |
| SER: Sessile serrated lesions | ||
| MSI-H: Microsatellite-high colorectal cancer | ||
| MSS: Microsatellite stable colorectal cancer | ||
| Esophagus | 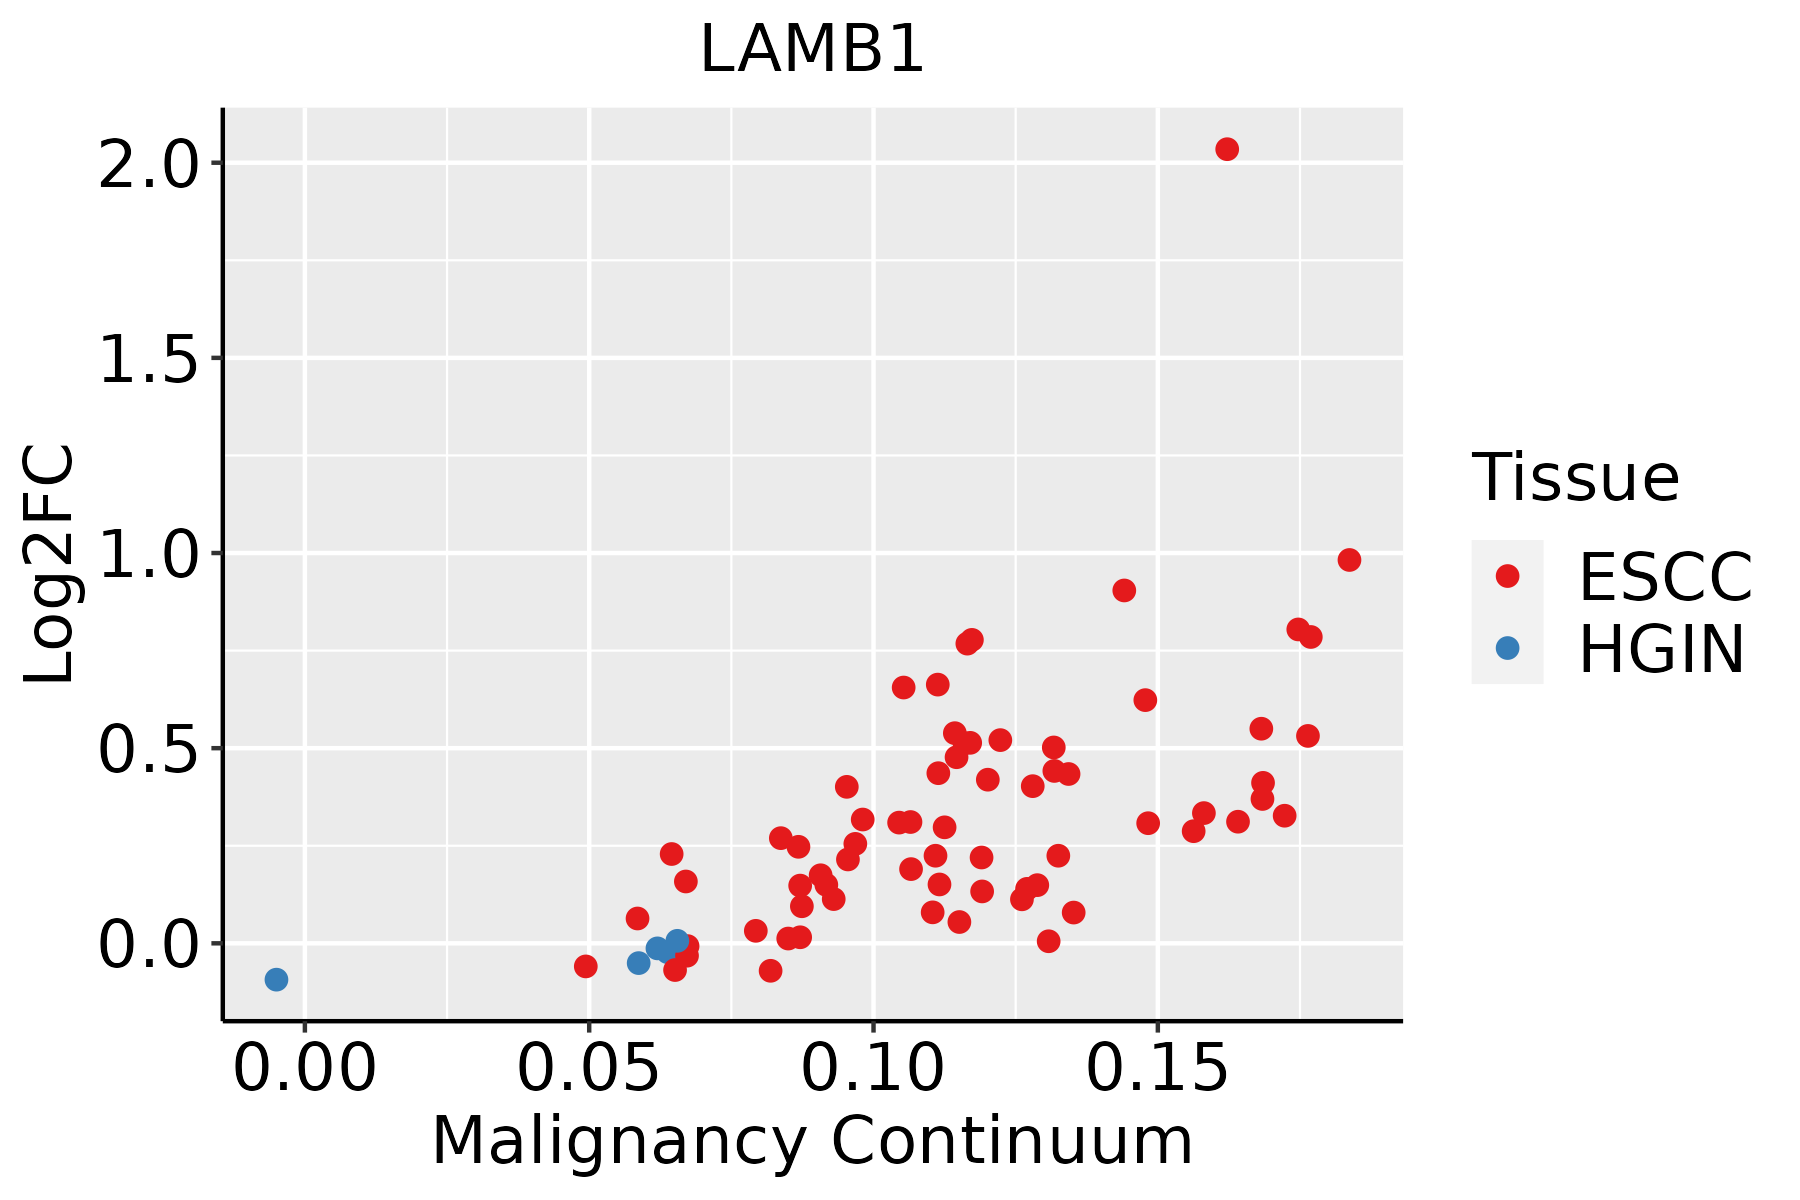 | ESCC: Esophageal squamous cell carcinoma |
| HGIN: High-grade intraepithelial neoplasias | ||
| LGIN: Low-grade intraepithelial neoplasias | ||
| Liver | 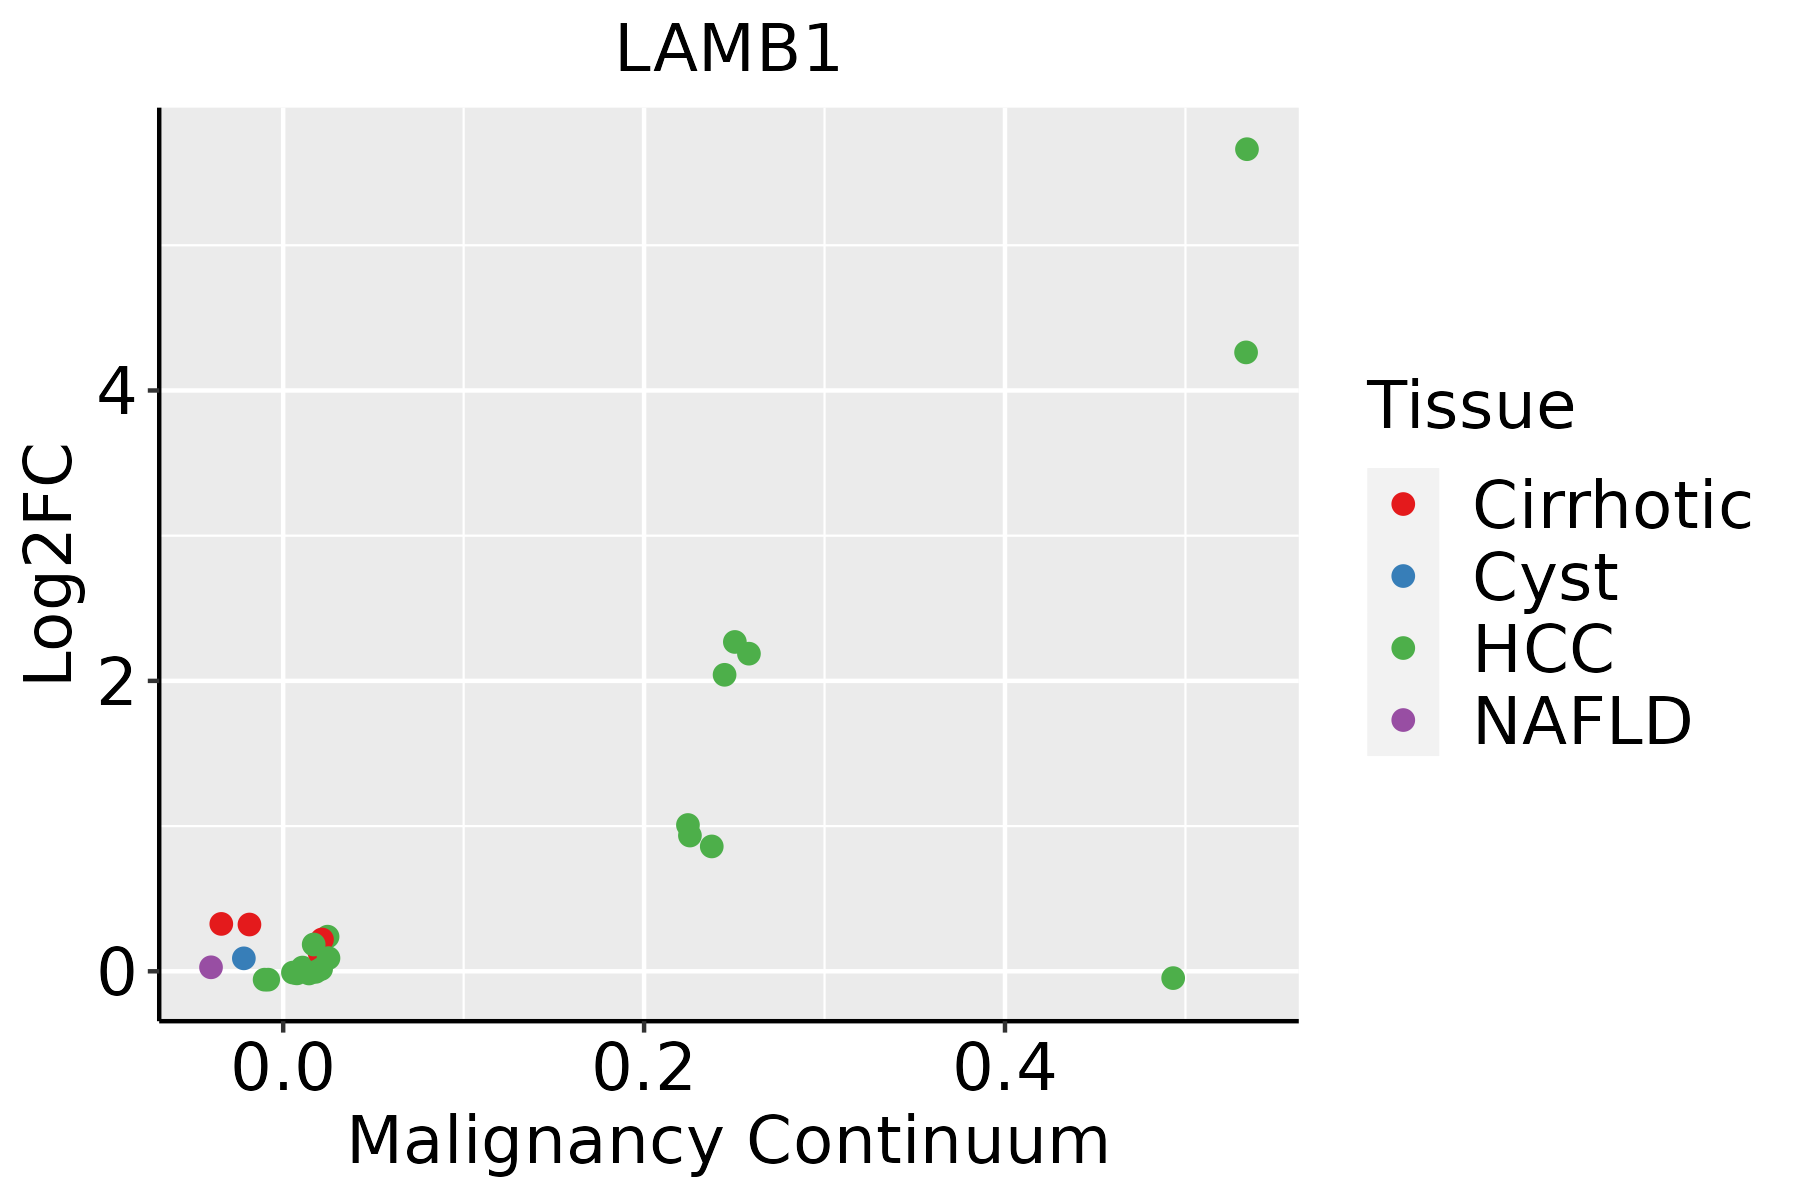 | HCC: Hepatocellular carcinoma |
| NAFLD: Non-alcoholic fatty liver disease | ||
| Oral Cavity | 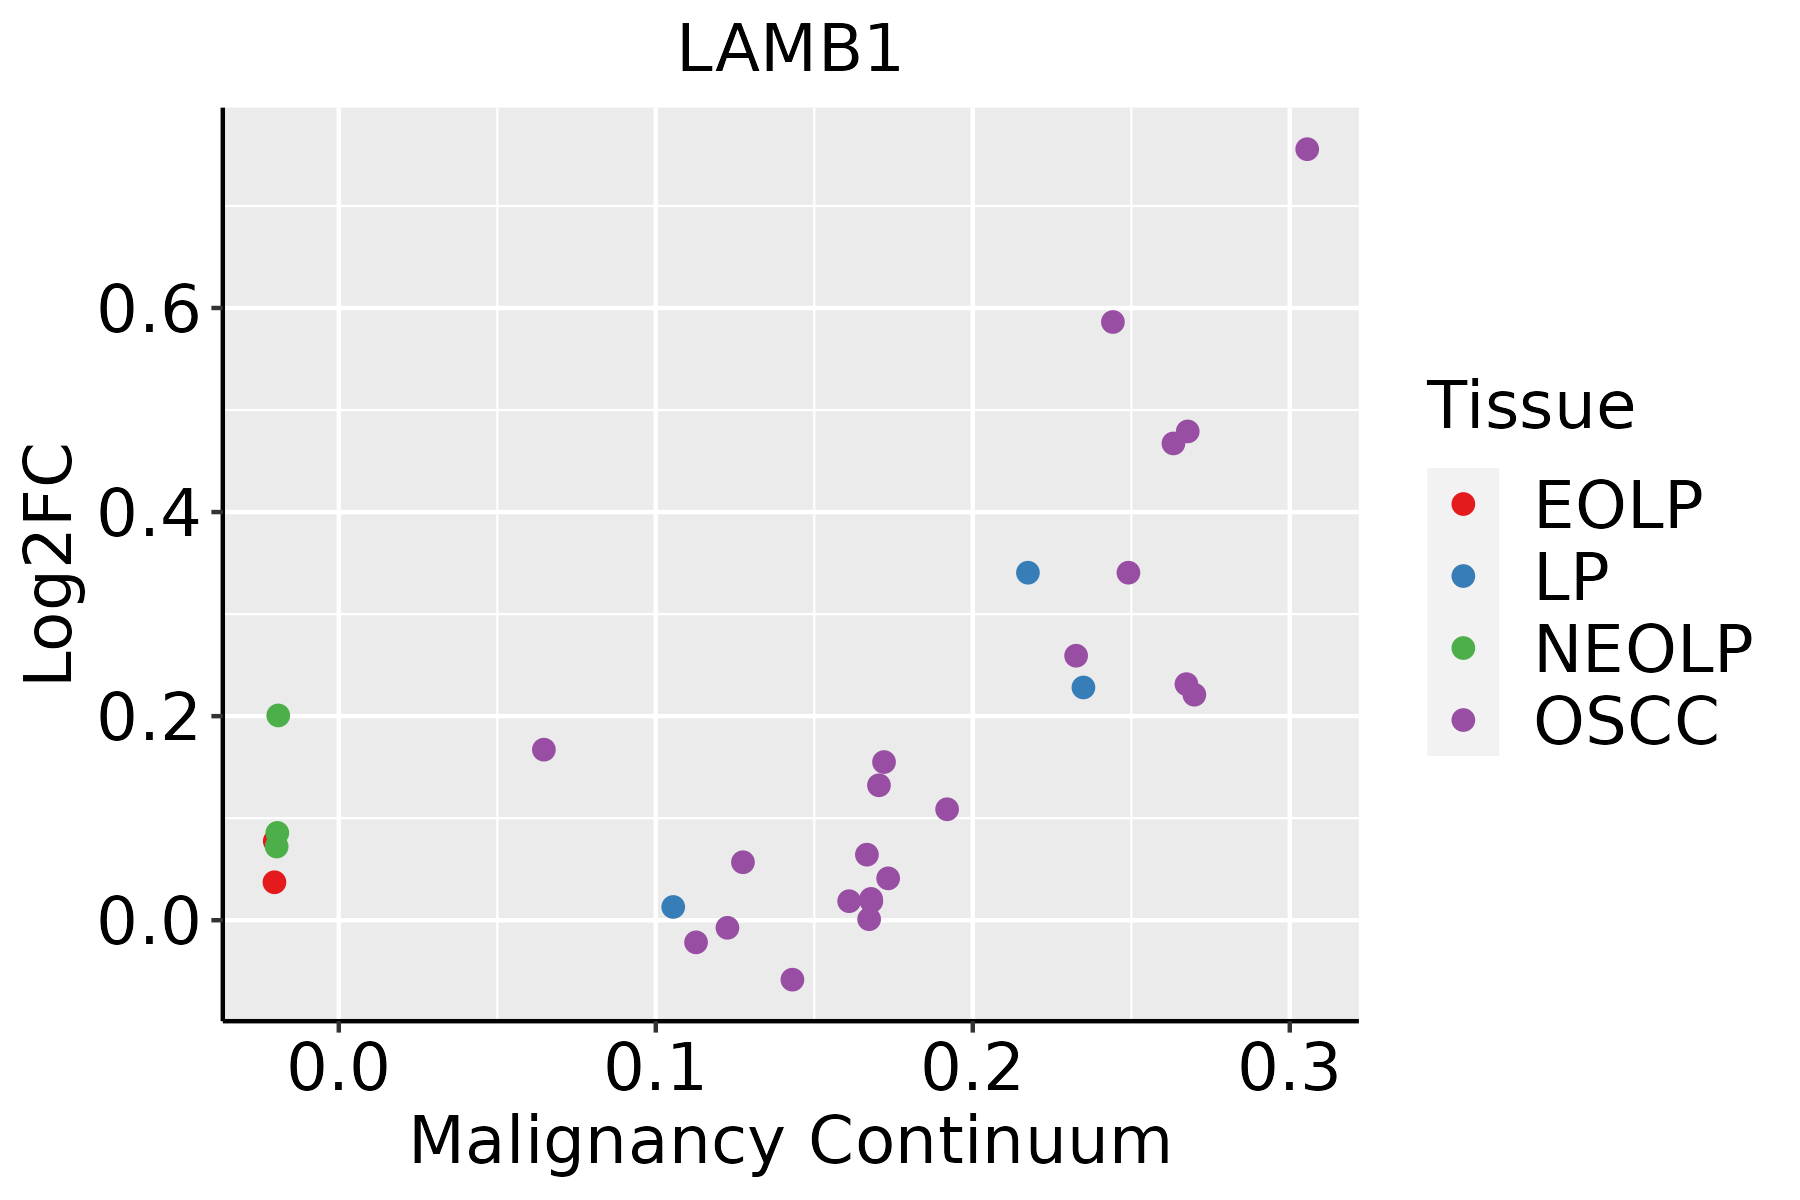 | EOLP: Erosive Oral lichen planus |
| LP: leukoplakia | ||
| NEOLP: Non-erosive oral lichen planus | ||
| OSCC: Oral squamous cell carcinoma | ||
| Prostate | 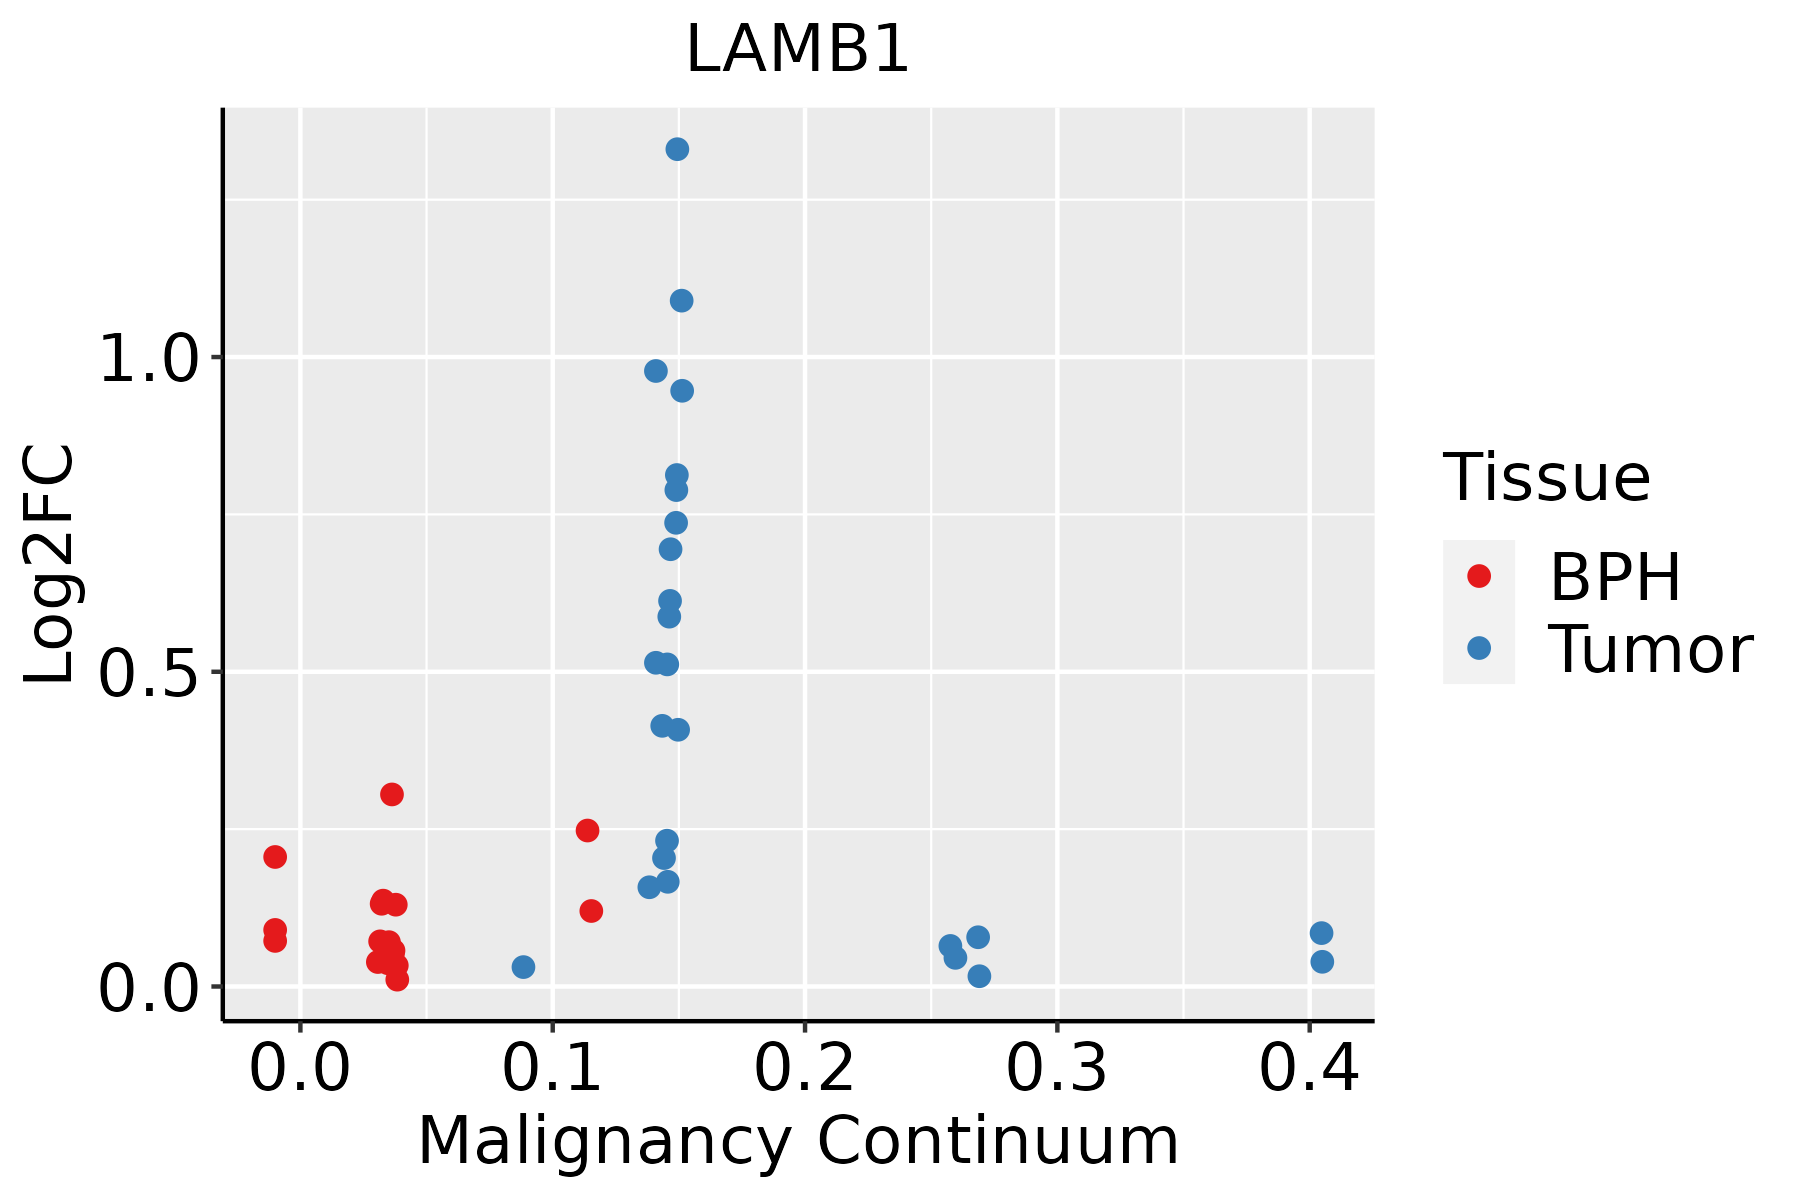 | BPH: Benign Prostatic Hyperplasia |
| Thyroid | 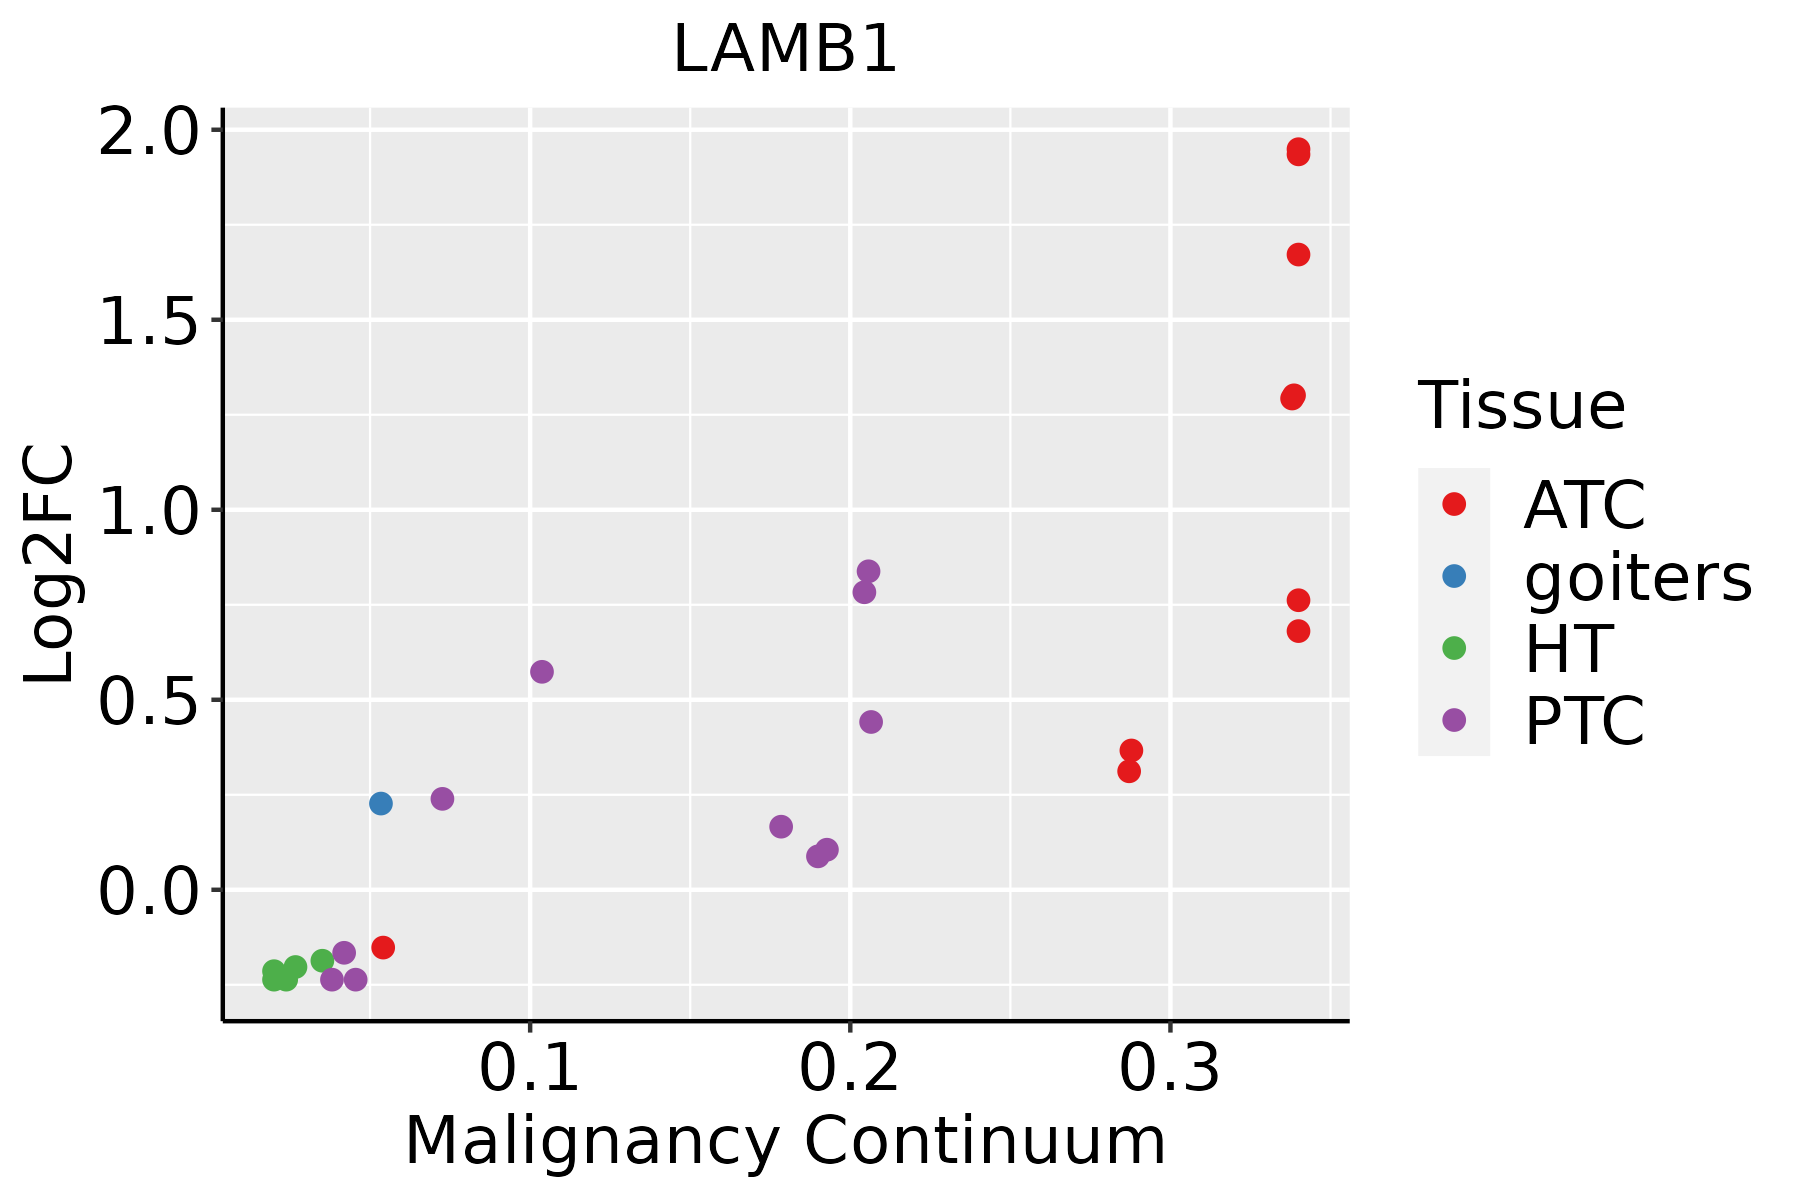 | ATC: Anaplastic thyroid cancer |
| HT: Hashimoto's thyroiditis | ||
| PTC: Papillary thyroid cancer |
| ∗log2FC in expression of this searched gene in stem-like cells from each diseased tissue sample relative to stem-like cells in normal samples in each tissue plotted against the malignancy continuum. Samples are colored based on if they are from different disease stage. |
Top |
Malignant transformation related pathway analysis |
| Find out the enriched GO biological processes and KEGG pathways involved in transition from healthy to precancer to cancer |
| Tissue | Disease Stage | Enriched GO biological Processes |
| Colorectum | AD |  |
| Colorectum | SER |  |
| Colorectum | MSS |  |
| Colorectum | MSI-H |  |
| Colorectum | FAP |  |
| ∗Top 15 enriched GO BP terms are showed in the bar plot of each disease state in each tissue. Each row represents a significant GO biological process which is colored according to the -log10(p.adjust). |
| Page: 1 2 3 4 5 6 7 8 9 |
| GO ID | Tissue | Disease Stage | Description | Gene Ratio | Bg Ratio | pvalue | p.adjust | Count |
| GO:0031589 | Colorectum | AD | cell-substrate adhesion | 116/3918 | 363/18723 | 4.68e-07 | 1.76e-05 | 116 |
| GO:0034446 | Colorectum | AD | substrate adhesion-dependent cell spreading | 40/3918 | 108/18723 | 8.52e-05 | 1.32e-03 | 40 |
| GO:0050673 | Colorectum | AD | epithelial cell proliferation | 119/3918 | 437/18723 | 8.75e-04 | 8.51e-03 | 119 |
| GO:0007369 | Colorectum | AD | gastrulation | 53/3918 | 185/18723 | 7.60e-03 | 4.60e-02 | 53 |
| GO:00315892 | Colorectum | MSS | cell-substrate adhesion | 104/3467 | 363/18723 | 1.35e-06 | 4.51e-05 | 104 |
| GO:00344462 | Colorectum | MSS | substrate adhesion-dependent cell spreading | 39/3467 | 108/18723 | 1.15e-05 | 2.71e-04 | 39 |
| GO:00506731 | Colorectum | MSS | epithelial cell proliferation | 108/3467 | 437/18723 | 6.76e-04 | 7.30e-03 | 108 |
| GO:0050678 | Colorectum | MSS | regulation of epithelial cell proliferation | 90/3467 | 381/18723 | 6.92e-03 | 4.45e-02 | 90 |
| GO:00315893 | Colorectum | FAP | cell-substrate adhesion | 93/2622 | 363/18723 | 2.48e-09 | 4.61e-07 | 93 |
| GO:00344464 | Colorectum | FAP | substrate adhesion-dependent cell spreading | 30/2622 | 108/18723 | 1.32e-04 | 2.12e-03 | 30 |
| GO:00073692 | Colorectum | FAP | gastrulation | 42/2622 | 185/18723 | 8.97e-04 | 9.10e-03 | 42 |
| GO:00506732 | Colorectum | FAP | epithelial cell proliferation | 84/2622 | 437/18723 | 1.39e-03 | 1.25e-02 | 84 |
| GO:0021987 | Colorectum | FAP | cerebral cortex development | 28/2622 | 114/18723 | 1.80e-03 | 1.55e-02 | 28 |
| GO:0021543 | Colorectum | FAP | pallium development | 36/2622 | 169/18723 | 6.06e-03 | 3.81e-02 | 36 |
| GO:00506781 | Colorectum | FAP | regulation of epithelial cell proliferation | 71/2622 | 381/18723 | 6.67e-03 | 4.12e-02 | 71 |
| GO:0030900 | Colorectum | FAP | forebrain development | 70/2622 | 379/18723 | 8.64e-03 | 4.98e-02 | 70 |
| GO:00315894 | Colorectum | CRC | cell-substrate adhesion | 78/2078 | 363/18723 | 6.22e-09 | 1.49e-06 | 78 |
| GO:00344465 | Colorectum | CRC | substrate adhesion-dependent cell spreading | 27/2078 | 108/18723 | 3.70e-05 | 9.18e-04 | 27 |
| GO:00309001 | Colorectum | CRC | forebrain development | 66/2078 | 379/18723 | 1.36e-04 | 2.57e-03 | 66 |
| GO:00073693 | Colorectum | CRC | gastrulation | 36/2078 | 185/18723 | 5.54e-04 | 7.70e-03 | 36 |
| Page: 1 2 3 4 5 6 7 8 |
| Pathway ID | Tissue | Disease Stage | Description | Gene Ratio | Bg Ratio | pvalue | p.adjust | qvalue | Count |
| hsa052228 | Oral cavity | OSCC | Small cell lung cancer | 66/3704 | 92/8465 | 4.43e-08 | 3.38e-07 | 1.72e-07 | 66 |
| hsa0514520 | Oral cavity | OSCC | Toxoplasmosis | 75/3704 | 112/8465 | 5.28e-07 | 3.16e-06 | 1.61e-06 | 75 |
| hsa041516 | Oral cavity | OSCC | PI3K-Akt signaling pathway | 185/3704 | 354/8465 | 6.26e-04 | 1.86e-03 | 9.49e-04 | 185 |
| hsa051468 | Oral cavity | OSCC | Amoebiasis | 59/3704 | 102/8465 | 2.78e-03 | 7.17e-03 | 3.65e-03 | 59 |
| hsa0516514 | Oral cavity | OSCC | Human papillomavirus infection | 200/3704 | 331/8465 | 3.83e-10 | 4.93e-09 | 2.51e-09 | 200 |
| hsa04510110 | Oral cavity | OSCC | Focal adhesion | 128/3704 | 203/8465 | 1.71e-08 | 1.63e-07 | 8.31e-08 | 128 |
| hsa0522215 | Oral cavity | OSCC | Small cell lung cancer | 66/3704 | 92/8465 | 4.43e-08 | 3.38e-07 | 1.72e-07 | 66 |
| hsa05145110 | Oral cavity | OSCC | Toxoplasmosis | 75/3704 | 112/8465 | 5.28e-07 | 3.16e-06 | 1.61e-06 | 75 |
| hsa0415113 | Oral cavity | OSCC | PI3K-Akt signaling pathway | 185/3704 | 354/8465 | 6.26e-04 | 1.86e-03 | 9.49e-04 | 185 |
| hsa0514615 | Oral cavity | OSCC | Amoebiasis | 59/3704 | 102/8465 | 2.78e-03 | 7.17e-03 | 3.65e-03 | 59 |
| hsa0451017 | Prostate | BPH | Focal adhesion | 85/1718 | 203/8465 | 1.17e-12 | 2.28e-11 | 1.41e-11 | 85 |
| hsa051658 | Prostate | BPH | Human papillomavirus infection | 111/1718 | 331/8465 | 6.15e-09 | 7.81e-08 | 4.83e-08 | 111 |
| hsa052227 | Prostate | BPH | Small cell lung cancer | 38/1718 | 92/8465 | 3.15e-06 | 2.74e-05 | 1.69e-05 | 38 |
| hsa041515 | Prostate | BPH | PI3K-Akt signaling pathway | 104/1718 | 354/8465 | 2.07e-05 | 1.55e-04 | 9.61e-05 | 104 |
| hsa0514518 | Prostate | BPH | Toxoplasmosis | 40/1718 | 112/8465 | 1.00e-04 | 6.00e-04 | 3.71e-04 | 40 |
| hsa051467 | Prostate | BPH | Amoebiasis | 33/1718 | 102/8465 | 2.70e-03 | 1.05e-02 | 6.49e-03 | 33 |
| hsa045125 | Prostate | BPH | ECM-receptor interaction | 28/1718 | 89/8465 | 8.33e-03 | 2.64e-02 | 1.64e-02 | 28 |
| hsa0451018 | Prostate | BPH | Focal adhesion | 85/1718 | 203/8465 | 1.17e-12 | 2.28e-11 | 1.41e-11 | 85 |
| hsa0516513 | Prostate | BPH | Human papillomavirus infection | 111/1718 | 331/8465 | 6.15e-09 | 7.81e-08 | 4.83e-08 | 111 |
| hsa0522214 | Prostate | BPH | Small cell lung cancer | 38/1718 | 92/8465 | 3.15e-06 | 2.74e-05 | 1.69e-05 | 38 |
| Page: 1 2 3 4 |
Top |
Cell-cell communication analysis |
| Identification of potential cell-cell interactions between two cell types and their ligand-receptor pairs for different disease states |
| Ligand | Receptor | LRpair | Pathway | Tissue | Disease Stage |
| LAMB1 | ITGA1_ITGB1 | LAMB1_ITGA1_ITGB1 | LAMININ | Breast | DCIS |
| LAMB1 | ITGA2_ITGB1 | LAMB1_ITGA2_ITGB1 | LAMININ | Breast | DCIS |
| LAMB1 | ITGA6_ITGB1 | LAMB1_ITGA6_ITGB1 | LAMININ | Breast | DCIS |
| LAMB1 | ITGA7_ITGB1 | LAMB1_ITGA7_ITGB1 | LAMININ | Breast | DCIS |
| LAMB1 | ITGA6_ITGB4 | LAMB1_ITGA6_ITGB4 | LAMININ | Breast | DCIS |
| LAMB1 | CD44 | LAMB1_CD44 | LAMININ | Breast | DCIS |
| LAMB1 | DAG1 | LAMB1_DAG1 | LAMININ | Breast | DCIS |
| LAMB1 | ITGA1_ITGB1 | LAMB1_ITGA1_ITGB1 | LAMININ | Breast | Healthy |
| LAMB1 | ITGA2_ITGB1 | LAMB1_ITGA2_ITGB1 | LAMININ | Breast | Healthy |
| LAMB1 | ITGA6_ITGB1 | LAMB1_ITGA6_ITGB1 | LAMININ | Breast | Healthy |
| LAMB1 | ITGA7_ITGB1 | LAMB1_ITGA7_ITGB1 | LAMININ | Breast | Healthy |
| LAMB1 | ITGAV_ITGB8 | LAMB1_ITGAV_ITGB8 | LAMININ | Breast | Healthy |
| LAMB1 | CD44 | LAMB1_CD44 | LAMININ | Breast | Healthy |
| LAMB1 | ITGA1_ITGB1 | LAMB1_ITGA1_ITGB1 | LAMININ | Breast | IDC |
| LAMB1 | ITGA6_ITGB1 | LAMB1_ITGA6_ITGB1 | LAMININ | Breast | IDC |
| LAMB1 | CD44 | LAMB1_CD44 | LAMININ | Breast | IDC |
| LAMB1 | ITGA1_ITGB1 | LAMB1_ITGA1_ITGB1 | LAMININ | Cervix | ADJ |
| LAMB1 | ITGA2_ITGB1 | LAMB1_ITGA2_ITGB1 | LAMININ | Cervix | ADJ |
| LAMB1 | ITGA3_ITGB1 | LAMB1_ITGA3_ITGB1 | LAMININ | Cervix | ADJ |
| LAMB1 | ITGA6_ITGB1 | LAMB1_ITGA6_ITGB1 | LAMININ | Cervix | ADJ |
| Page: 1 2 3 4 5 6 7 8 9 10 11 12 13 14 15 16 |
Top |
Single-cell gene regulatory network inference analysis |
| Find out the significant the regulons (TFs) and the target genes of each regulon across cell types for different disease states |
| TF | Cell Type | Tissue | Disease Stage | Target Gene | RSS | Regulon Activity |
| ∗The dot plots of a searched regulon are shown for all cell subpopulations in each disease state of each tissue based on the regulon specific score inferred using pySCENIC and by calculating the average expression. |
| Page: 1 |
Top |
Somatic mutation of malignant transformation related genes |
| Annotation of somatic variants for genes involved in malignant transformation |
| Hugo Symbol | Variant Class | Variant Classification | dbSNP RS | HGVSc | HGVSp | HGVSp Short | SWISSPROT | BIOTYPE | SIFT | PolyPhen | Tumor Sample Barcode | Tissue | Histology | Sex | Age | Stage | Therapy Types | Drugs | Outcome |
| LAMB1 | SNV | Missense_Mutation | c.214N>A | p.Glu72Lys | p.E72K | P07942 | protein_coding | deleterious(0.04) | possibly_damaging(0.733) | TCGA-A7-A0CD-01 | Breast | breast invasive carcinoma | Female | >=65 | I/II | Hormone Therapy | arimidex | SD | |
| LAMB1 | SNV | Missense_Mutation | rs193010498 | c.3077G>A | p.Arg1026Gln | p.R1026Q | P07942 | protein_coding | deleterious(0.04) | probably_damaging(0.997) | TCGA-AN-A046-01 | Breast | breast invasive carcinoma | Female | >=65 | I/II | Unknown | Unknown | SD |
| LAMB1 | SNV | Missense_Mutation | c.3503N>C | p.Gly1168Ala | p.G1168A | P07942 | protein_coding | deleterious(0) | probably_damaging(0.996) | TCGA-BH-A18T-01 | Breast | breast invasive carcinoma | Female | >=65 | I/II | Unknown | Unknown | PD | |
| LAMB1 | SNV | Missense_Mutation | c.2203N>A | p.Gln735Lys | p.Q735K | P07942 | protein_coding | deleterious(0.03) | possibly_damaging(0.459) | TCGA-C8-A12P-01 | Breast | breast invasive carcinoma | Female | <65 | I/II | Unknown | Unknown | SD | |
| LAMB1 | SNV | Missense_Mutation | c.3860N>T | p.Ser1287Phe | p.S1287F | P07942 | protein_coding | deleterious(0.04) | benign(0.057) | TCGA-C8-A1HM-01 | Breast | breast invasive carcinoma | Female | >=65 | I/II | Chemotherapy | doxorubicin | CR | |
| LAMB1 | SNV | Missense_Mutation | c.5288G>C | p.Arg1763Thr | p.R1763T | P07942 | protein_coding | tolerated(0.21) | benign(0.003) | TCGA-EW-A3U0-01 | Breast | breast invasive carcinoma | Female | <65 | III/IV | Chemotherapy | cisplatin | CR | |
| LAMB1 | SNV | Missense_Mutation | rs774611936 | c.4280N>A | p.Gly1427Glu | p.G1427E | P07942 | protein_coding | deleterious(0) | probably_damaging(1) | TCGA-GI-A2C8-01 | Breast | breast invasive carcinoma | Female | <65 | III/IV | Unspecific | Adriamycin | SD |
| LAMB1 | SNV | Missense_Mutation | rs373152146 | c.2036C>T | p.Thr679Met | p.T679M | P07942 | protein_coding | deleterious(0) | possibly_damaging(0.506) | TCGA-OL-A5D8-01 | Breast | breast invasive carcinoma | Female | <65 | I/II | Unknown | Unknown | SD |
| LAMB1 | insertion | Frame_Shift_Ins | novel | c.3422_3423insAAGTGTGTGTTTTAAAATGCAGTTTTGGCTTCCAACACTGCGTG | p.Pro1142SerfsTer62 | p.P1142Sfs*62 | P07942 | protein_coding | TCGA-A8-A07R-01 | Breast | breast invasive carcinoma | Female | >=65 | III/IV | Ancillary | zoledronic | SD | ||
| LAMB1 | insertion | Nonsense_Mutation | novel | c.2860_2861insATGAAACCCCTTTGGGGGCAGAACTATAAATTGTAGTGCAGGTTTT | p.Arg954AsnfsTer10 | p.R954Nfs*10 | P07942 | protein_coding | TCGA-A8-A08H-01 | Breast | breast invasive carcinoma | Female | >=65 | I/II | Unknown | Unknown | SD |
| Page: 1 2 3 4 5 6 7 8 9 10 11 12 13 14 15 16 17 18 19 20 21 |
Top |
Related drugs of malignant transformation related genes |
| Identification of chemicals and drugs interact with genes involved in malignant transfromation |
| (DGIdb 4.0) |
| Entrez ID | Symbol | Category | Interaction Types | Drug Claim Name | Drug Name | PMIDs |
| 3912 | LAMB1 | DRUGGABLE GENOME | CHEMBL2095222 | OCRIPLASMIN | ||
| 3912 | LAMB1 | DRUGGABLE GENOME | HEPARAN SULFATE | 8873769 |
| Page: 1 |

Copyright 2023-Present -The University of Texas Health Science Center at Houston |