
|
|||||
|
 | |
| |
| |
| |
| |
| |
|
Gene: HLA-DQA1 |
Gene summary for HLA-DQA1 |
| Gene information | Species | Human | Gene symbol | HLA-DQA1 | Gene ID | 3117 |
| Gene name | major histocompatibility complex, class II, DQ alpha 1 | |
| Gene Alias | CELIAC1 | |
| Cytomap | 6p21.32 | |
| Gene Type | protein-coding | GO ID | GO:0001775 | UniProtAcc | A0A173ADG5 |
Top |
Malignant transformation analysis |
| Identification of the aberrant gene expression in precancerous and cancerous lesions by comparing the gene expression of stem-like cells in diseased tissues with normal stem cells |
| Entrez ID | Symbol | Replicates | Species | Organ | Tissue | Adj P-value | Log2FC | Malignancy |
| 3117 | HLA-DQA1 | GSM4909287 | Human | Breast | IDC | 2.09e-18 | 6.57e-01 | 0.2057 |
| 3117 | HLA-DQA1 | GSM4909290 | Human | Breast | IDC | 4.48e-03 | 2.67e-01 | 0.2096 |
| 3117 | HLA-DQA1 | M1 | Human | Breast | IDC | 9.04e-07 | 3.24e-01 | 0.1577 |
| 3117 | HLA-DQA1 | M2 | Human | Breast | IDC | 2.40e-03 | 5.48e-01 | 0.21 |
| 3117 | HLA-DQA1 | NCCBC11 | Human | Breast | DCIS | 1.60e-08 | 9.27e-01 | 0.1232 |
| 3117 | HLA-DQA1 | NCCBC14 | Human | Breast | DCIS | 1.24e-02 | 3.26e-01 | 0.2021 |
| 3117 | HLA-DQA1 | NCCBC3 | Human | Breast | DCIS | 4.02e-35 | 8.56e-01 | 0.1198 |
| 3117 | HLA-DQA1 | NCCBC5 | Human | Breast | DCIS | 3.75e-21 | 8.79e-01 | 0.2046 |
| 3117 | HLA-DQA1 | P2 | Human | Breast | IDC | 1.76e-16 | 7.84e-01 | 0.21 |
| 3117 | HLA-DQA1 | CA_HPV_1 | Human | Cervix | CC | 1.27e-06 | 5.10e-01 | 0.0264 |
| 3117 | HLA-DQA1 | CA_HPV_3 | Human | Cervix | CC | 3.33e-07 | -5.58e-01 | 0.0414 |
| 3117 | HLA-DQA1 | CCI_1 | Human | Cervix | CC | 1.14e-05 | -7.67e-01 | 0.528 |
| 3117 | HLA-DQA1 | CCI_3 | Human | Cervix | CC | 3.63e-07 | -7.46e-01 | 0.516 |
| 3117 | HLA-DQA1 | CCII_1 | Human | Cervix | CC | 3.52e-14 | -7.97e-01 | 0.3249 |
| 3117 | HLA-DQA1 | Tumor | Human | Cervix | CC | 1.36e-25 | -7.85e-01 | 0.1241 |
| 3117 | HLA-DQA1 | sample1 | Human | Cervix | CC | 2.14e-13 | 8.40e-01 | 0.0959 |
| 3117 | HLA-DQA1 | sample3 | Human | Cervix | CC | 7.59e-28 | -8.01e-01 | 0.1387 |
| 3117 | HLA-DQA1 | H2 | Human | Cervix | HSIL_HPV | 3.17e-16 | -6.52e-01 | 0.0632 |
| 3117 | HLA-DQA1 | L1 | Human | Cervix | CC | 1.55e-06 | -5.99e-01 | 0.0802 |
| 3117 | HLA-DQA1 | T1 | Human | Cervix | CC | 5.14e-18 | 7.36e-01 | 0.0918 |
| Page: 1 2 3 4 5 6 |
| Tissue | Expression Dynamics | Abbreviation |
| Breast | 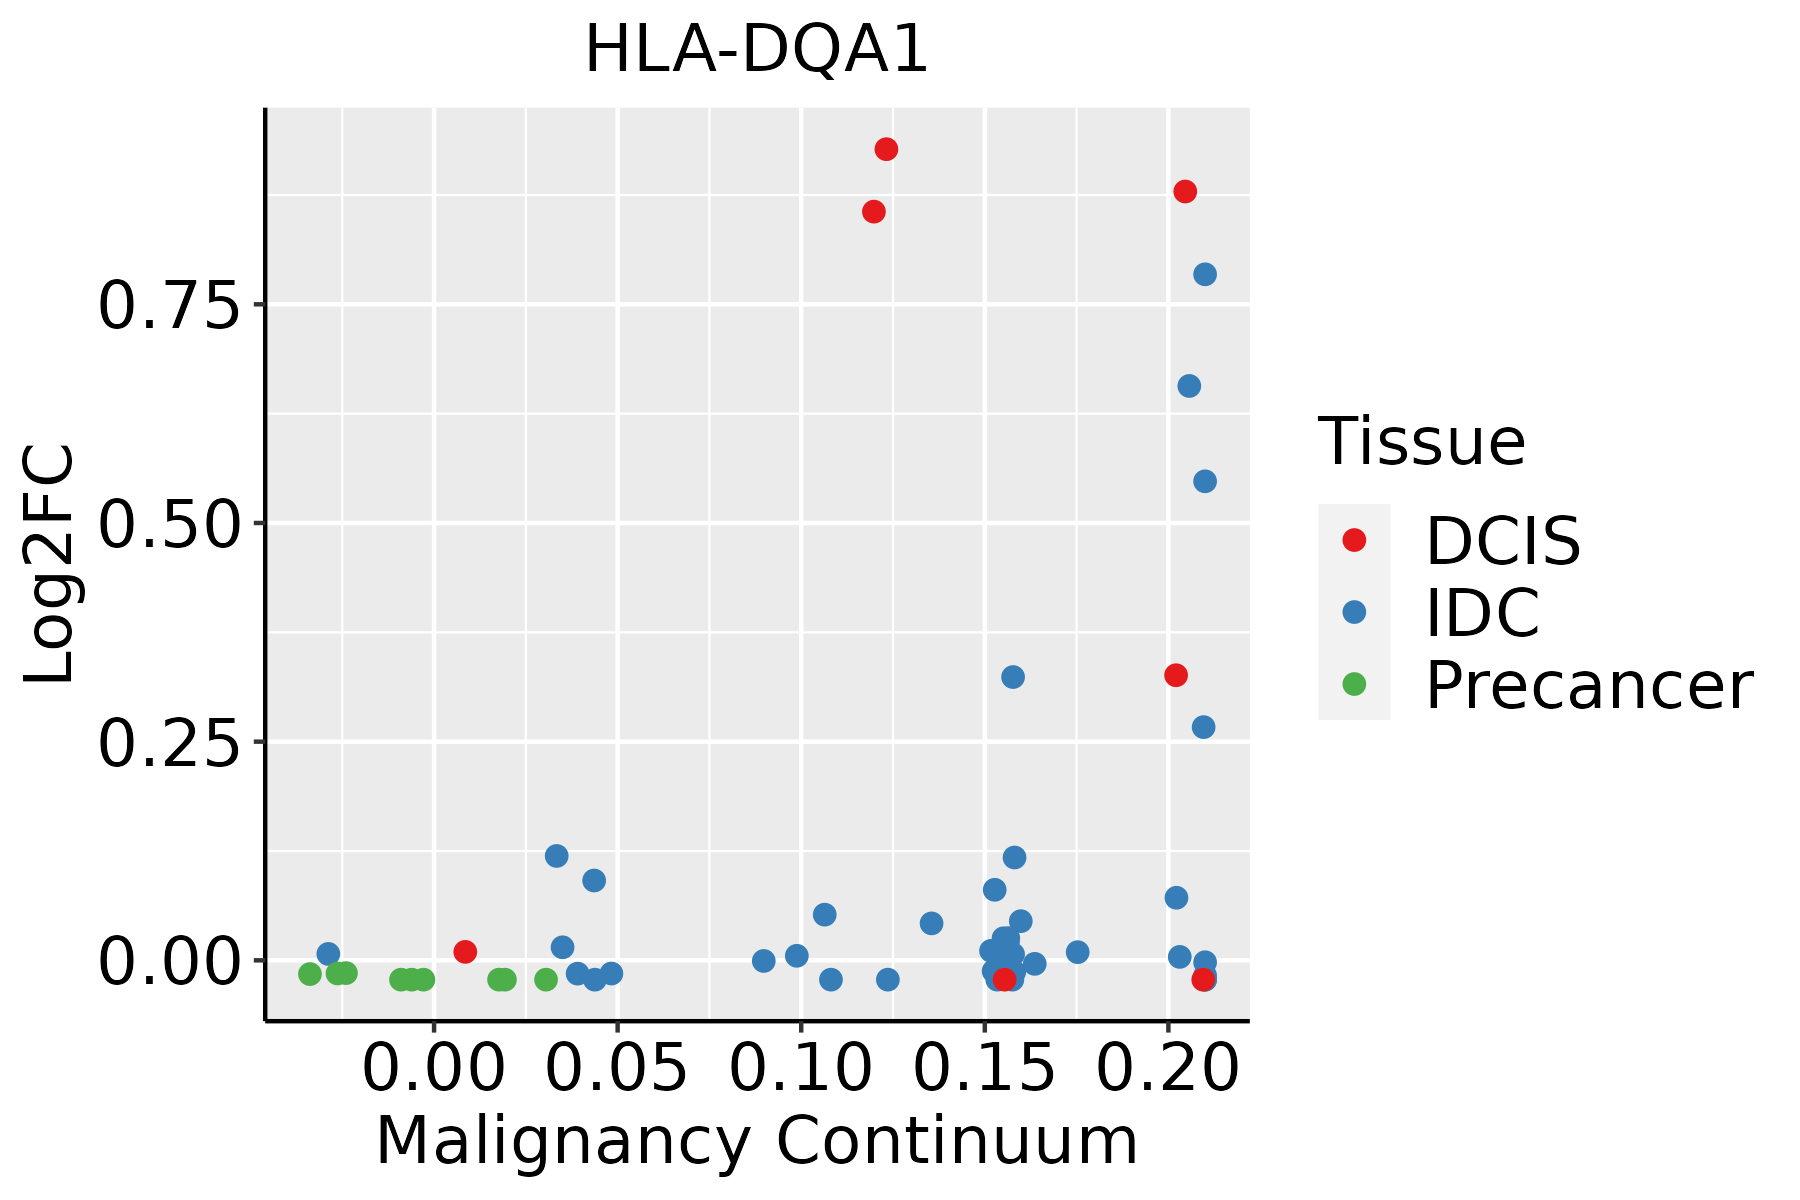 | IDC: Invasive ductal carcinoma |
| DCIS: Ductal carcinoma in situ | ||
| Precancer(BRCA1-mut): Precancerous lesion from BRCA1 mutation carriers | ||
| Cervix |  | CC: Cervix cancer |
| HSIL_HPV: HPV-infected high-grade squamous intraepithelial lesions | ||
| N_HPV: HPV-infected normal cervix | ||
| Endometrium |  | AEH: Atypical endometrial hyperplasia |
| EEC: Endometrioid Cancer | ||
| Esophagus | 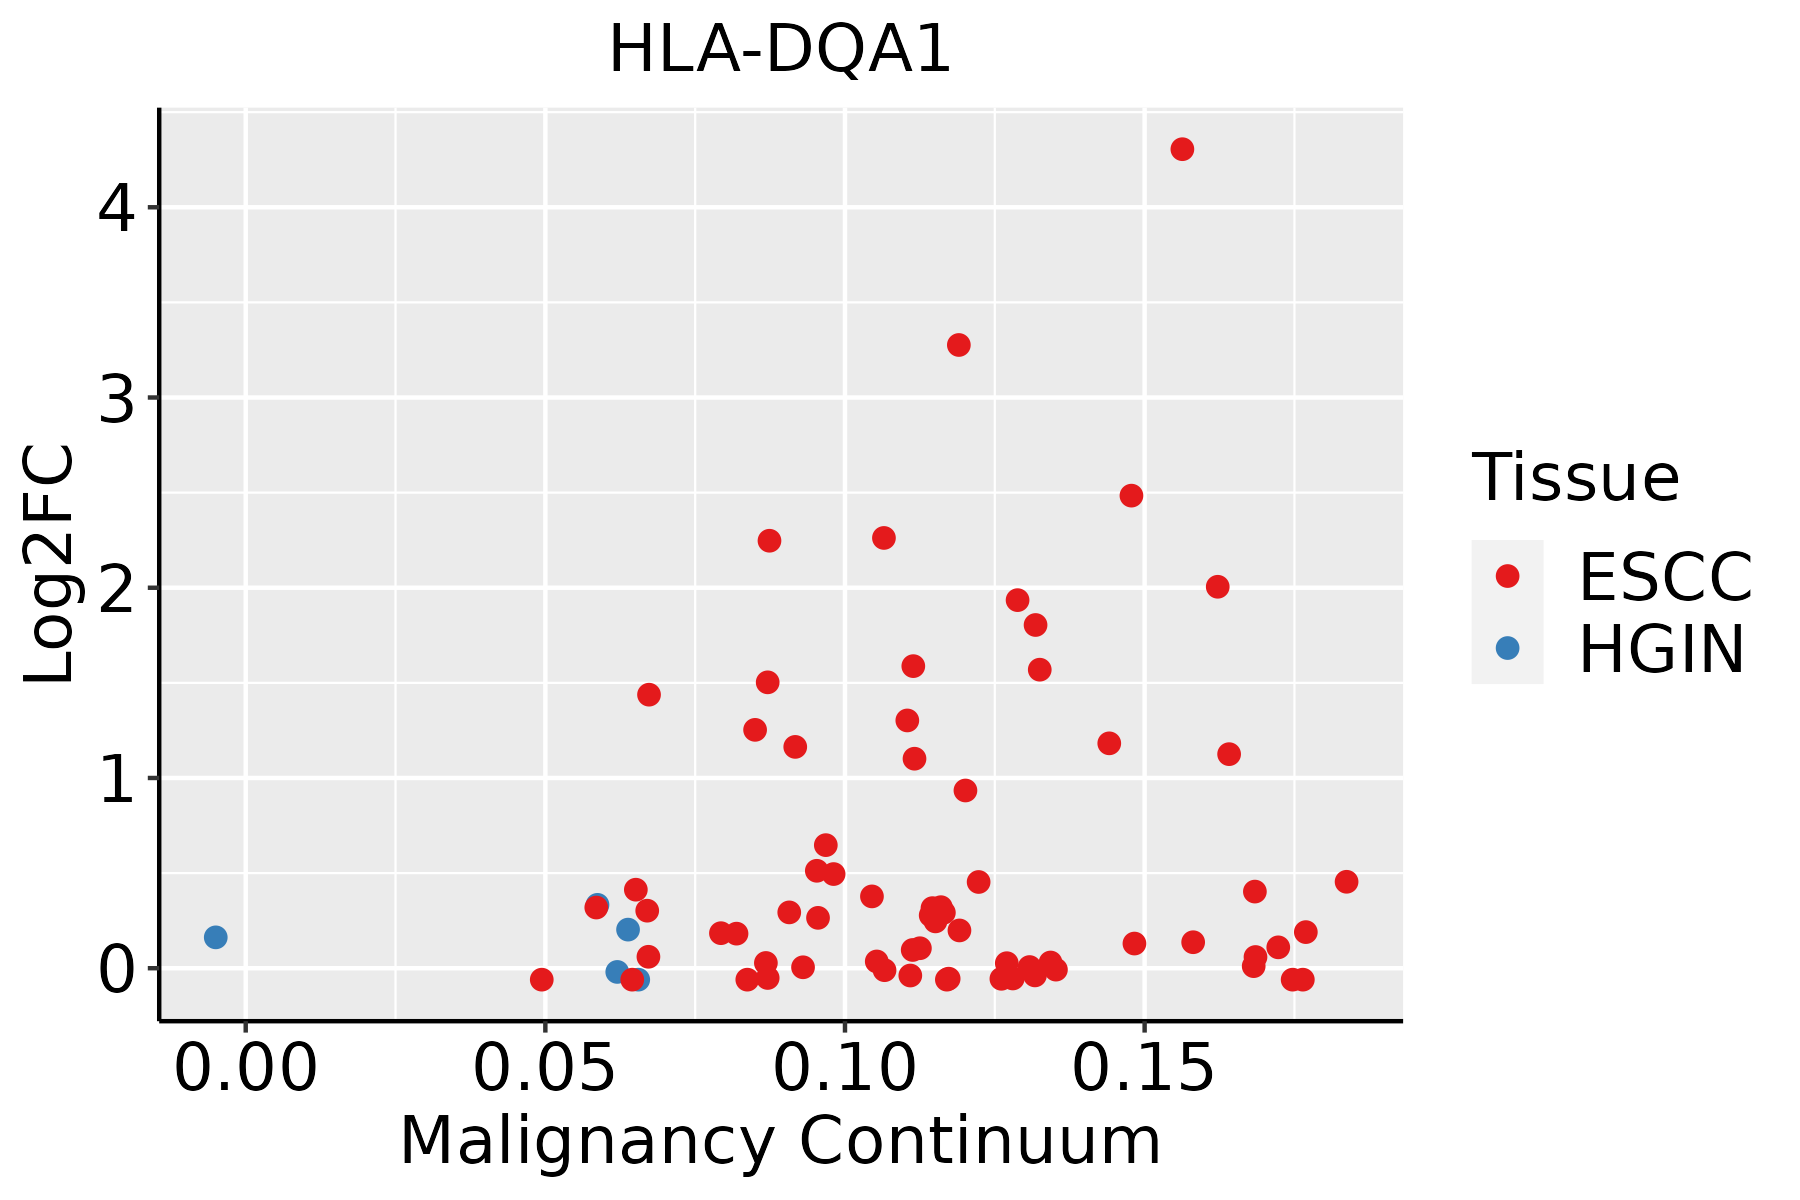 | ESCC: Esophageal squamous cell carcinoma |
| HGIN: High-grade intraepithelial neoplasias | ||
| LGIN: Low-grade intraepithelial neoplasias | ||
| GC |  | CAG: Chronic atrophic gastritis |
| CAG with IM: Chronic atrophic gastritis with intestinal metaplasia | ||
| CSG: Chronic superficial gastritis | ||
| GC: Gastric cancer | ||
| SIM: Severe intestinal metaplasia | ||
| WIM: Wild intestinal metaplasia | ||
| Liver | 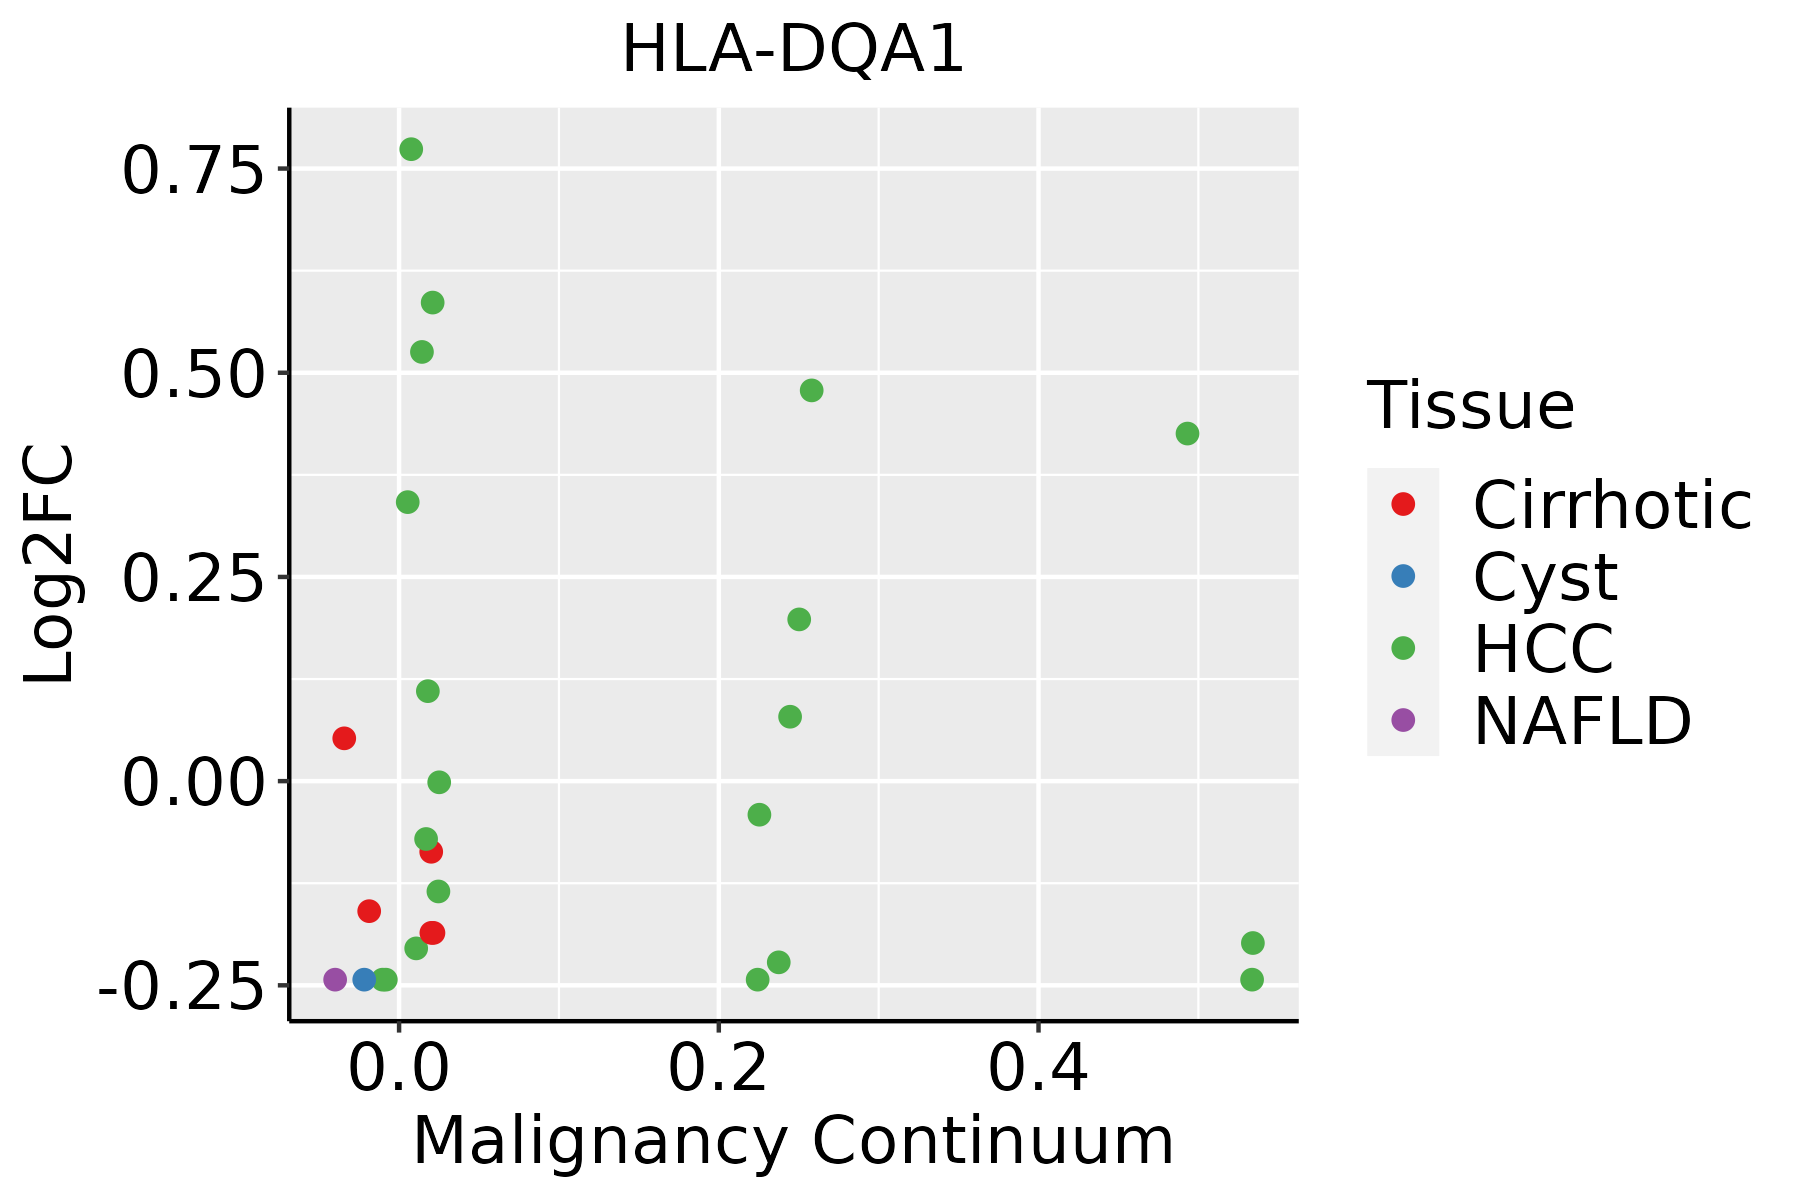 | HCC: Hepatocellular carcinoma |
| NAFLD: Non-alcoholic fatty liver disease | ||
| Lung |  | AAH: Atypical adenomatous hyperplasia |
| AIS: Adenocarcinoma in situ | ||
| IAC: Invasive lung adenocarcinoma | ||
| MIA: Minimally invasive adenocarcinoma | ||
| Oral Cavity | 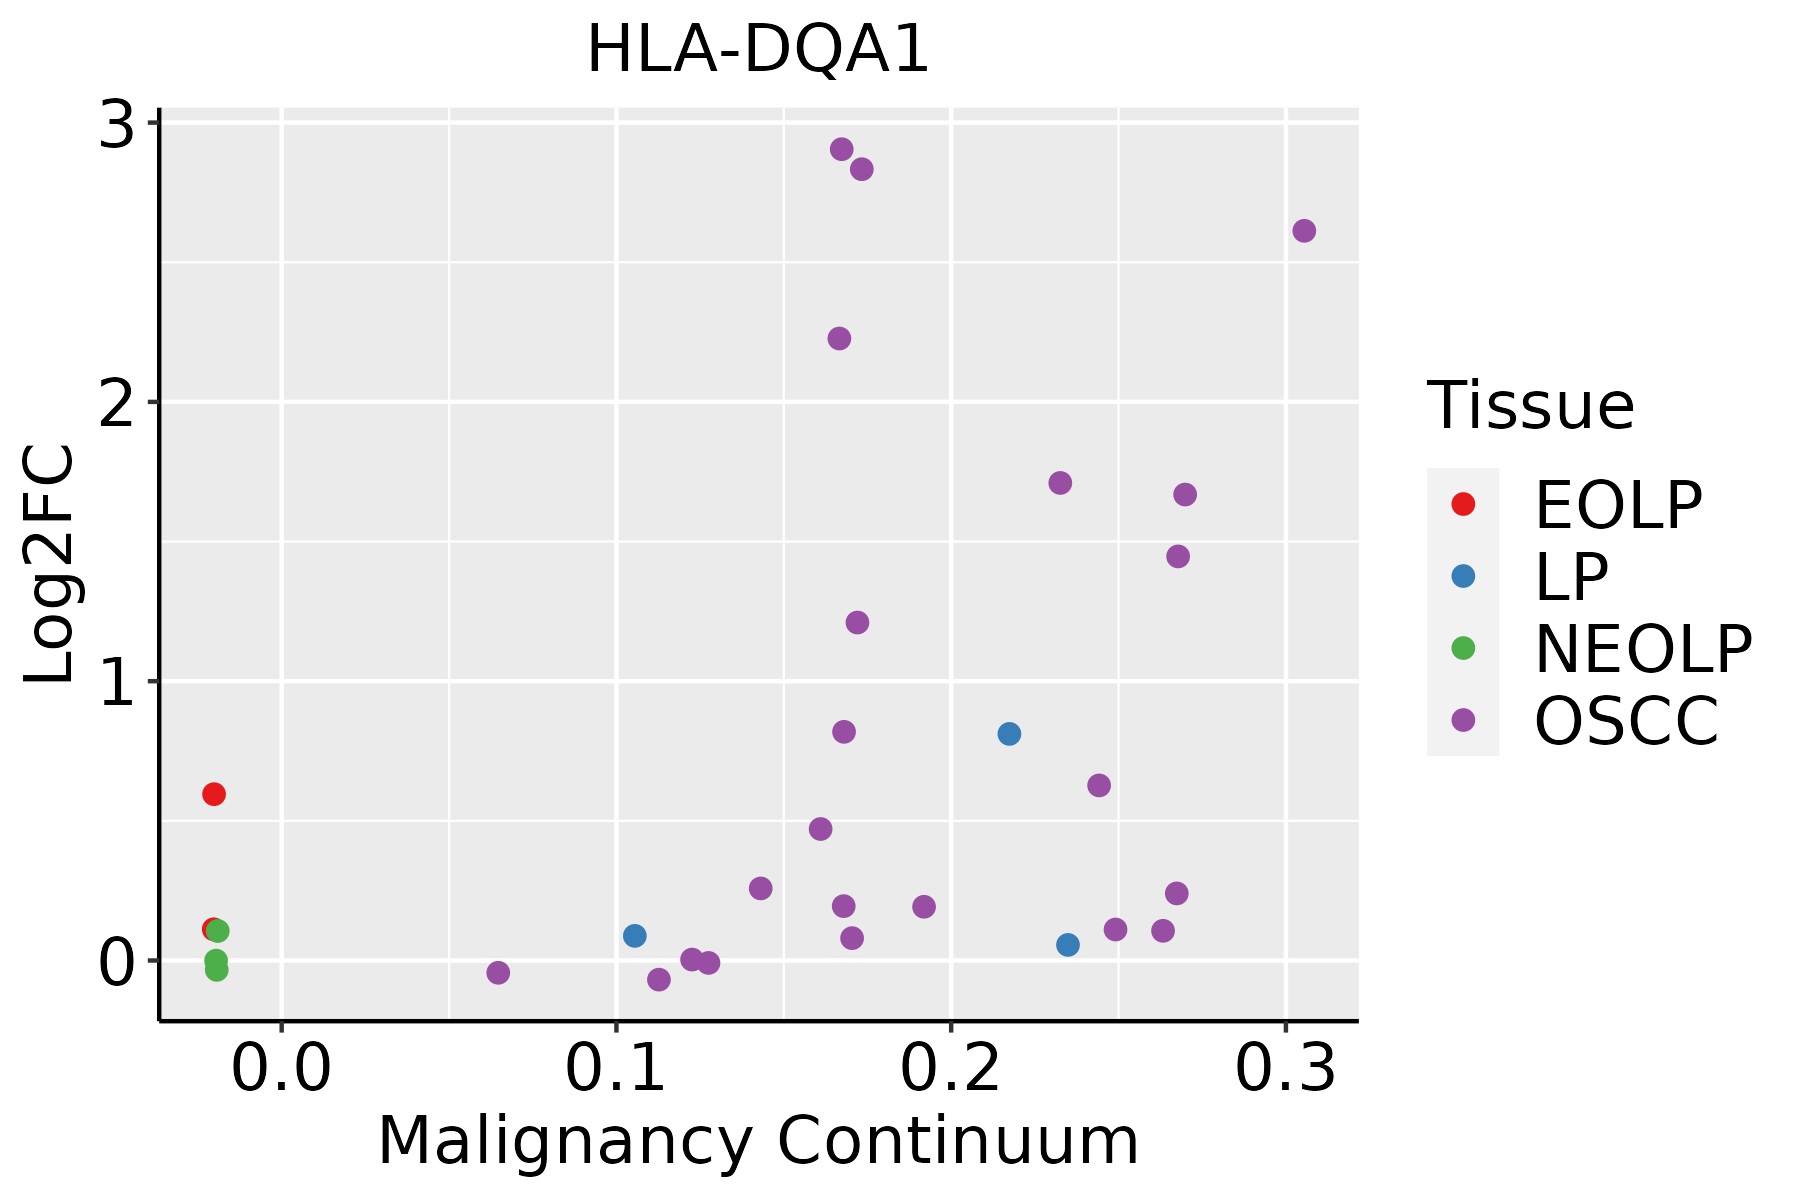 | EOLP: Erosive Oral lichen planus |
| LP: leukoplakia | ||
| NEOLP: Non-erosive oral lichen planus | ||
| OSCC: Oral squamous cell carcinoma | ||
| Skin | 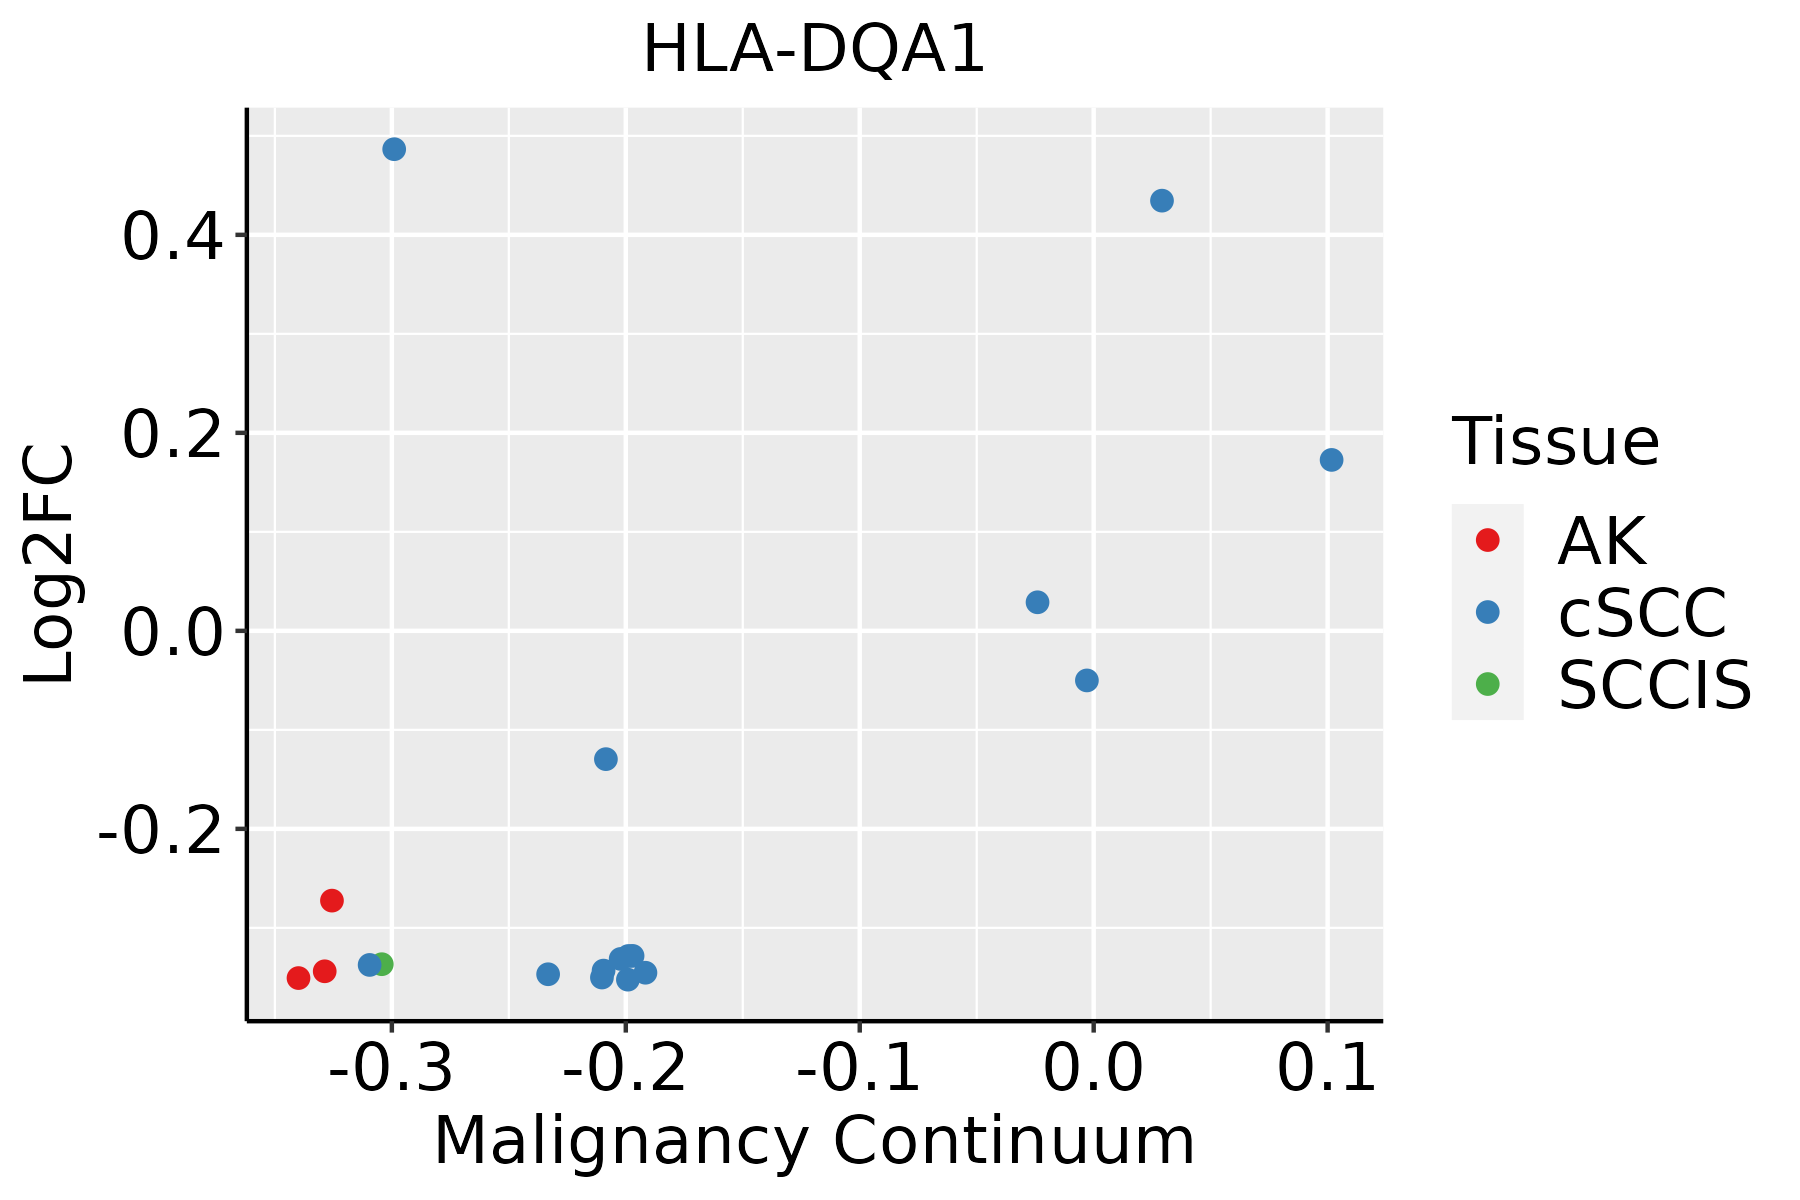 | AK: Actinic keratosis |
| cSCC: Cutaneous squamous cell carcinoma | ||
| SCCIS:squamous cell carcinoma in situ | ||
| Thyroid | 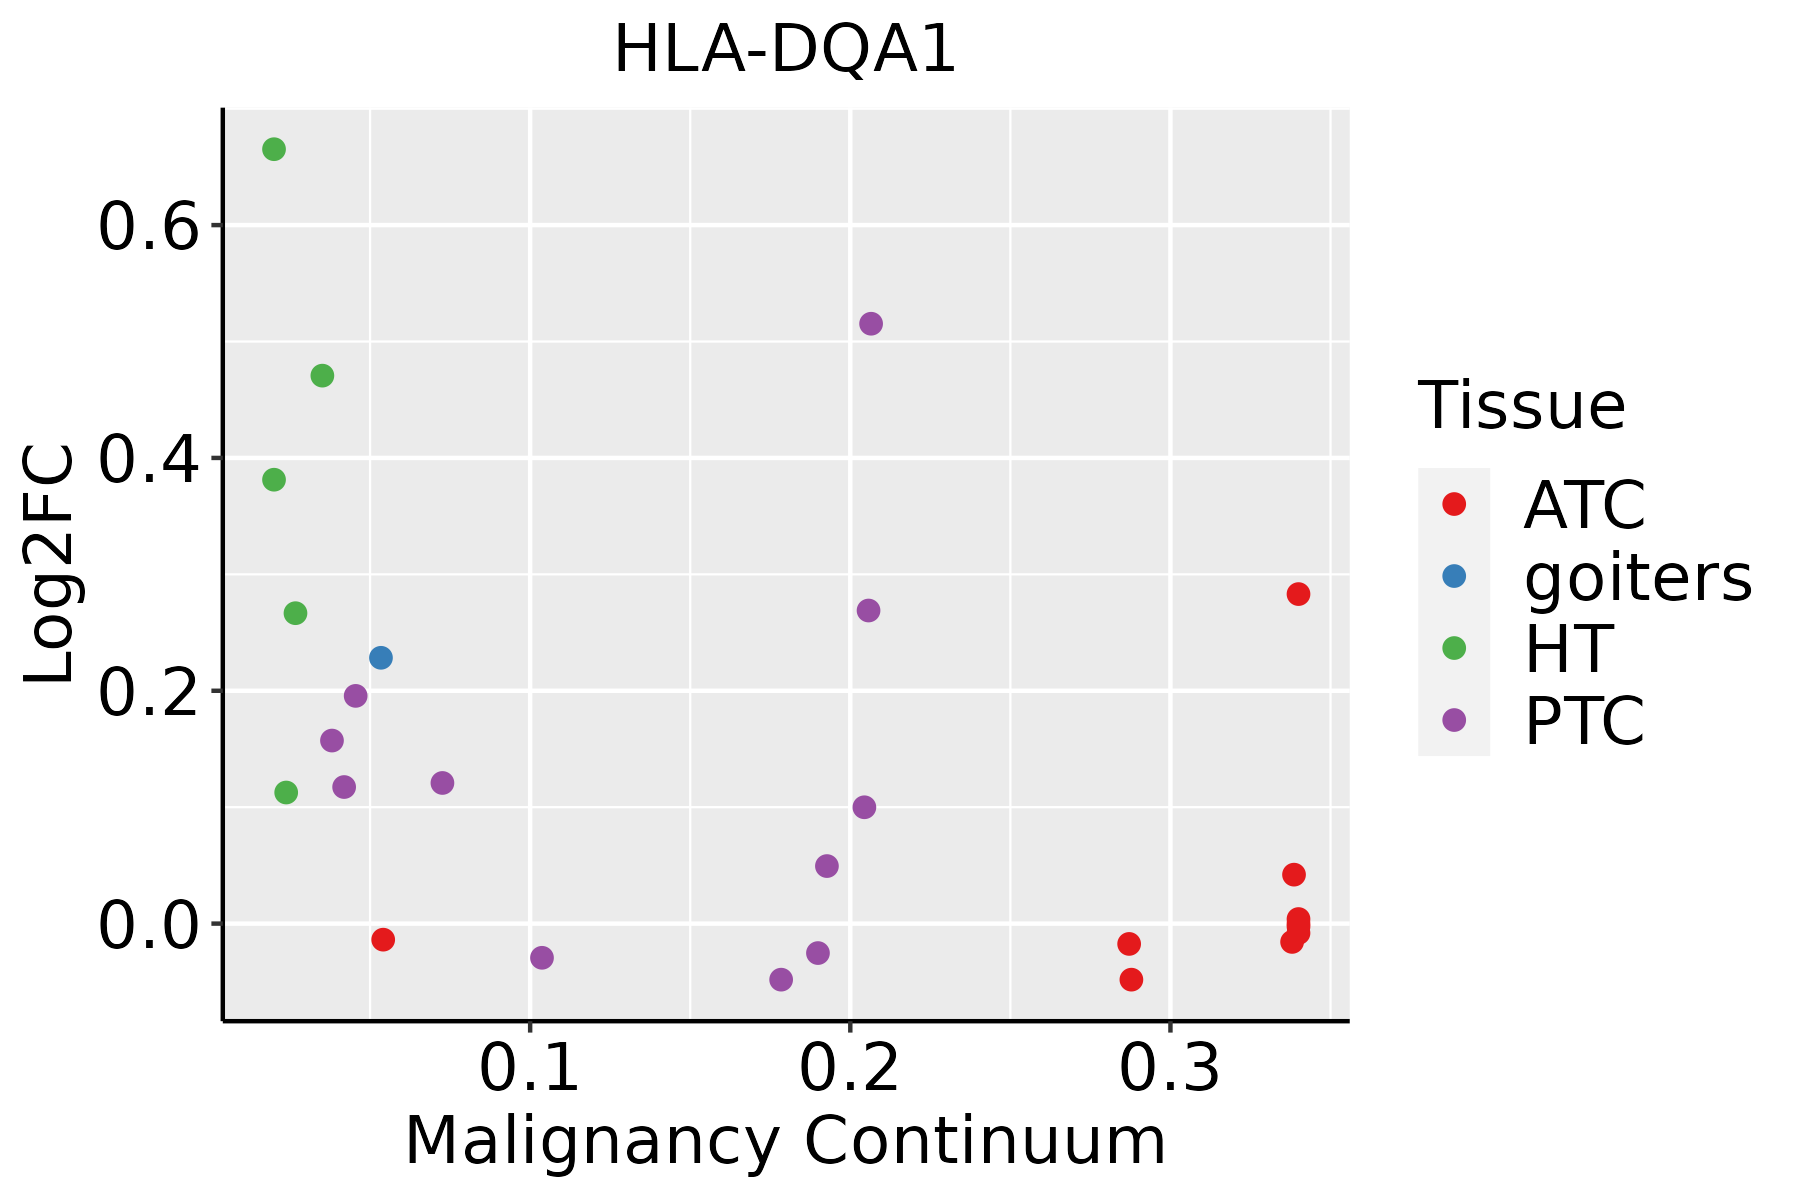 | ATC: Anaplastic thyroid cancer |
| HT: Hashimoto's thyroiditis | ||
| PTC: Papillary thyroid cancer |
| ∗log2FC in expression of this searched gene in stem-like cells from each diseased tissue sample relative to stem-like cells in normal samples in each tissue plotted against the malignancy continuum. Samples are colored based on if they are from different disease stage. |
Top |
Malignant transformation related pathway analysis |
| Find out the enriched GO biological processes and KEGG pathways involved in transition from healthy to precancer to cancer |
| Tissue | Disease Stage | Enriched GO biological Processes |
| Colorectum | AD |  |
| Colorectum | SER |  |
| Colorectum | MSS |  |
| Colorectum | MSI-H |  |
| Colorectum | FAP |  |
| ∗Top 15 enriched GO BP terms are showed in the bar plot of each disease state in each tissue. Each row represents a significant GO biological process which is colored according to the -log10(p.adjust). |
| Page: 1 2 3 4 5 6 7 8 9 |
| GO ID | Tissue | Disease Stage | Description | Gene Ratio | Bg Ratio | pvalue | p.adjust | Count |
| GO:004800213 | Breast | IDC | antigen processing and presentation of peptide antigen | 18/1434 | 62/18723 | 5.28e-07 | 2.59e-05 | 18 |
| GO:004578514 | Breast | IDC | positive regulation of cell adhesion | 62/1434 | 437/18723 | 1.70e-06 | 7.16e-05 | 62 |
| GO:000250112 | Breast | IDC | peptide antigen assembly with MHC protein complex | 9/1434 | 18/18723 | 2.28e-06 | 9.05e-05 | 9 |
| GO:000247813 | Breast | IDC | antigen processing and presentation of exogenous peptide antigen | 13/1434 | 38/18723 | 2.60e-06 | 1.01e-04 | 13 |
| GO:000239612 | Breast | IDC | MHC protein complex assembly | 9/1434 | 19/18723 | 4.03e-06 | 1.43e-04 | 9 |
| GO:00023997 | Breast | IDC | MHC class II protein complex assembly | 8/1434 | 16/18723 | 8.56e-06 | 2.47e-04 | 8 |
| GO:00025037 | Breast | IDC | peptide antigen assembly with MHC class II protein complex | 8/1434 | 16/18723 | 8.56e-06 | 2.47e-04 | 8 |
| GO:004211012 | Breast | IDC | T cell activation | 64/1434 | 487/18723 | 1.49e-05 | 3.77e-04 | 64 |
| GO:005086311 | Breast | IDC | regulation of T cell activation | 47/1434 | 329/18723 | 2.49e-05 | 5.91e-04 | 47 |
| GO:00024957 | Breast | IDC | antigen processing and presentation of peptide antigen via MHC class II | 11/1434 | 34/18723 | 2.81e-05 | 6.58e-04 | 11 |
| GO:001988413 | Breast | IDC | antigen processing and presentation of exogenous antigen | 13/1434 | 47/18723 | 3.53e-05 | 8.08e-04 | 13 |
| GO:005087011 | Breast | IDC | positive regulation of T cell activation | 34/1434 | 216/18723 | 4.59e-05 | 1.03e-03 | 34 |
| GO:001988613 | Breast | IDC | antigen processing and presentation of exogenous peptide antigen via MHC class II | 10/1434 | 30/18723 | 4.87e-05 | 1.07e-03 | 10 |
| GO:00025047 | Breast | IDC | antigen processing and presentation of peptide or polysaccharide antigen via MHC class II | 11/1434 | 36/18723 | 5.13e-05 | 1.10e-03 | 11 |
| GO:000715912 | Breast | IDC | leukocyte cell-cell adhesion | 49/1434 | 371/18723 | 1.27e-04 | 2.33e-03 | 49 |
| GO:00198829 | Breast | IDC | antigen processing and presentation | 20/1434 | 106/18723 | 1.41e-04 | 2.49e-03 | 20 |
| GO:190303911 | Breast | IDC | positive regulation of leukocyte cell-cell adhesion | 35/1434 | 239/18723 | 1.58e-04 | 2.73e-03 | 35 |
| GO:190303711 | Breast | IDC | regulation of leukocyte cell-cell adhesion | 45/1434 | 336/18723 | 1.72e-04 | 2.92e-03 | 45 |
| GO:002240712 | Breast | IDC | regulation of cell-cell adhesion | 55/1434 | 448/18723 | 3.43e-04 | 5.07e-03 | 55 |
| GO:002240912 | Breast | IDC | positive regulation of cell-cell adhesion | 38/1434 | 284/18723 | 5.40e-04 | 6.96e-03 | 38 |
| Page: 1 2 3 4 5 6 7 8 9 10 11 12 13 14 15 16 17 18 19 20 21 22 |
| Pathway ID | Tissue | Disease Stage | Description | Gene Ratio | Bg Ratio | pvalue | p.adjust | qvalue | Count |
| hsa0414520 | Cervix | CC | Phagosome | 47/1267 | 152/8465 | 3.95e-07 | 4.26e-06 | 2.52e-06 | 47 |
| hsa0516920 | Cervix | CC | Epstein-Barr virus infection | 57/1267 | 202/8465 | 7.30e-07 | 7.39e-06 | 4.37e-06 | 57 |
| hsa0516620 | Cervix | CC | Human T-cell leukemia virus 1 infection | 61/1267 | 222/8465 | 8.13e-07 | 7.98e-06 | 4.72e-06 | 61 |
| hsa0514514 | Cervix | CC | Toxoplasmosis | 34/1267 | 112/8465 | 2.42e-05 | 1.82e-04 | 1.08e-04 | 34 |
| hsa0494016 | Cervix | CC | Type I diabetes mellitus | 17/1267 | 43/8465 | 7.47e-05 | 5.04e-04 | 2.98e-04 | 17 |
| hsa0533014 | Cervix | CC | Allograft rejection | 15/1267 | 38/8465 | 2.01e-04 | 1.14e-03 | 6.75e-04 | 15 |
| hsa0516414 | Cervix | CC | Influenza A | 43/1267 | 171/8465 | 3.03e-04 | 1.64e-03 | 9.68e-04 | 43 |
| hsa0532314 | Cervix | CC | Rheumatoid arthritis | 27/1267 | 93/8465 | 3.64e-04 | 1.82e-03 | 1.07e-03 | 27 |
| hsa0533212 | Cervix | CC | Graft-versus-host disease | 15/1267 | 42/8465 | 7.12e-04 | 3.25e-03 | 1.92e-03 | 15 |
| hsa05152 | Cervix | CC | Tuberculosis | 42/1267 | 180/8465 | 1.78e-03 | 7.21e-03 | 4.26e-03 | 42 |
| hsa046596 | Cervix | CC | Th17 cell differentiation | 28/1267 | 108/8465 | 1.99e-03 | 7.98e-03 | 4.72e-03 | 28 |
| hsa0514014 | Cervix | CC | Leishmaniasis | 21/1267 | 77/8465 | 3.65e-03 | 1.34e-02 | 7.91e-03 | 21 |
| hsa04658 | Cervix | CC | Th1 and Th2 cell differentiation | 24/1267 | 92/8465 | 3.71e-03 | 1.34e-02 | 7.91e-03 | 24 |
| hsa053107 | Cervix | CC | Asthma | 11/1267 | 31/8465 | 3.82e-03 | 1.36e-02 | 8.03e-03 | 11 |
| hsa045147 | Cervix | CC | Cell adhesion molecules | 36/1267 | 157/8465 | 4.94e-03 | 1.67e-02 | 9.86e-03 | 36 |
| hsa0532012 | Cervix | CC | Autoimmune thyroid disease | 15/1267 | 53/8465 | 9.08e-03 | 2.85e-02 | 1.69e-02 | 15 |
| hsa04612110 | Cervix | CC | Antigen processing and presentation | 34/1267 | 78/8465 | 1.06e-09 | 2.14e-08 | 1.26e-08 | 34 |
| hsa05416110 | Cervix | CC | Viral myocarditis | 27/1267 | 60/8465 | 2.43e-08 | 3.57e-07 | 2.11e-07 | 27 |
| hsa04145110 | Cervix | CC | Phagosome | 47/1267 | 152/8465 | 3.95e-07 | 4.26e-06 | 2.52e-06 | 47 |
| hsa05169110 | Cervix | CC | Epstein-Barr virus infection | 57/1267 | 202/8465 | 7.30e-07 | 7.39e-06 | 4.37e-06 | 57 |
| Page: 1 2 3 4 5 6 7 8 9 10 11 12 13 14 15 16 17 18 |
Top |
Cell-cell communication analysis |
| Identification of potential cell-cell interactions between two cell types and their ligand-receptor pairs for different disease states |
| Ligand | Receptor | LRpair | Pathway | Tissue | Disease Stage |
| HLA-DQA1 | CD4 | HLA-DQA1_CD4 | MHC-II | Breast | DCIS |
| HLA-DQA1 | CD4 | HLA-DQA1_CD4 | MHC-II | Breast | Healthy |
| HLA-DQA1 | CD4 | HLA-DQA1_CD4 | MHC-II | Breast | IDC |
| HLA-DQA1 | CD4 | HLA-DQA1_CD4 | MHC-II | Cervix | ADJ |
| HLA-DQA1 | CD4 | HLA-DQA1_CD4 | MHC-II | Cervix | CC |
| HLA-DQA1 | CD4 | HLA-DQA1_CD4 | MHC-II | Cervix | Healthy |
| HLA-DQA1 | CD4 | HLA-DQA1_CD4 | MHC-II | Cervix | Precancer |
| HLA-DQA1 | CD4 | HLA-DQA1_CD4 | MHC-II | CRC | AD |
| HLA-DQA1 | CD4 | HLA-DQA1_CD4 | MHC-II | CRC | ADJ |
| HLA-DQA1 | CD4 | HLA-DQA1_CD4 | MHC-II | CRC | FAP |
| HLA-DQA1 | CD4 | HLA-DQA1_CD4 | MHC-II | CRC | MSI-H |
| HLA-DQA1 | CD4 | HLA-DQA1_CD4 | MHC-II | CRC | MSS |
| HLA-DQA1 | CD4 | HLA-DQA1_CD4 | MHC-II | CRC | SER |
| HLA-DQA1 | CD4 | HLA-DQA1_CD4 | MHC-II | Endometrium | ADJ |
| HLA-DQA1 | CD4 | HLA-DQA1_CD4 | MHC-II | Endometrium | AEH |
| HLA-DQA1 | CD4 | HLA-DQA1_CD4 | MHC-II | Endometrium | EEC |
| HLA-DQA1 | CD4 | HLA-DQA1_CD4 | MHC-II | Endometrium | Healthy |
| HLA-DQA1 | CD4 | HLA-DQA1_CD4 | MHC-II | HNSCC | ADJ |
| HLA-DQA1 | CD4 | HLA-DQA1_CD4 | MHC-II | HNSCC | Healthy |
| HLA-DQA1 | CD4 | HLA-DQA1_CD4 | MHC-II | HNSCC | OSCC |
| Page: 1 2 3 |
Top |
Single-cell gene regulatory network inference analysis |
| Find out the significant the regulons (TFs) and the target genes of each regulon across cell types for different disease states |
| TF | Cell Type | Tissue | Disease Stage | Target Gene | RSS | Regulon Activity |
| ∗The dot plots of a searched regulon are shown for all cell subpopulations in each disease state of each tissue based on the regulon specific score inferred using pySCENIC and by calculating the average expression. |
| Page: 1 |
Top |
Somatic mutation of malignant transformation related genes |
| Annotation of somatic variants for genes involved in malignant transformation |
| Hugo Symbol | Variant Class | Variant Classification | dbSNP RS | HGVSc | HGVSp | HGVSp Short | SWISSPROT | BIOTYPE | SIFT | PolyPhen | Tumor Sample Barcode | Tissue | Histology | Sex | Age | Stage | Therapy Types | Drugs | Outcome |
| HLA-DQA1 | SNV | Missense_Mutation | c.151G>C | p.Glu51Gln | p.E51Q | P01909 | protein_coding | deleterious(0.03) | probably_damaging(1) | TCGA-JX-A3Q0-01 | Cervix | cervical & endocervical cancer | Female | <65 | III/IV | Unknown | Unknown | SD | |
| HLA-DQA1 | SNV | Missense_Mutation | c.157G>C | p.Asp53His | p.D53H | P01909 | protein_coding | deleterious(0) | probably_damaging(1) | TCGA-Q1-A73O-01 | Cervix | cervical & endocervical cancer | Female | <65 | I/II | Chemotherapy | cisplatin | CR | |
| HLA-DQA1 | SNV | Missense_Mutation | rs368821483 | c.367N>A | p.Val123Met | p.V123M | P01909 | protein_coding | deleterious(0.01) | benign(0.078) | TCGA-EI-6509-01 | Colorectum | rectum adenocarcinoma | Male | <65 | III/IV | Chemotherapy | folfox | PD |
| HLA-DQA1 | SNV | Missense_Mutation | novel | c.352N>C | p.Phe118Leu | p.F118L | P01909 | protein_coding | tolerated(0.4) | benign(0.062) | TCGA-A5-A0G2-01 | Endometrium | uterine corpus endometrioid carcinoma | Female | <65 | III/IV | Unknown | Unknown | SD |
| HLA-DQA1 | SNV | Missense_Mutation | c.155N>G | p.Phe52Cys | p.F52C | P01909 | protein_coding | deleterious(0) | probably_damaging(0.997) | TCGA-AX-A0J0-01 | Endometrium | uterine corpus endometrioid carcinoma | Female | <65 | I/II | Unknown | Unknown | SD | |
| HLA-DQA1 | SNV | Missense_Mutation | c.621N>T | p.Glu207Asp | p.E207D | P01909 | protein_coding | tolerated(0.1) | benign(0.003) | TCGA-B5-A1MR-01 | Endometrium | uterine corpus endometrioid carcinoma | Female | >=65 | III/IV | Unknown | Unknown | SD | |
| HLA-DQA1 | SNV | Missense_Mutation | novel | c.596N>T | p.Pro199Leu | p.P199L | P01909 | protein_coding | deleterious(0.02) | benign(0.426) | TCGA-E6-A1LX-01 | Endometrium | uterine corpus endometrioid carcinoma | Female | <65 | I/II | Unknown | Unknown | SD |
| HLA-DQA1 | SNV | Missense_Mutation | novel | c.505N>A | p.His169Asn | p.H169N | P01909 | protein_coding | tolerated(0.19) | possibly_damaging(0.629) | TCGA-EO-A22X-01 | Endometrium | uterine corpus endometrioid carcinoma | Female | <65 | III/IV | Unspecific | Carboplatin | Complete Response |
| HLA-DQA1 | SNV | Missense_Mutation | novel | c.481N>G | p.Thr161Ala | p.T161A | P01909 | protein_coding | deleterious(0.02) | possibly_damaging(0.471) | TCGA-EO-A3B0-01 | Endometrium | uterine corpus endometrioid carcinoma | Female | <65 | III/IV | Unknown | Unknown | SD |
| HLA-DQA1 | SNV | Missense_Mutation | novel | c.727N>A | p.Leu243Met | p.L243M | P01909 | protein_coding | tolerated(0.49) | probably_damaging(0.979) | TCGA-FI-A2F4-01 | Endometrium | uterine corpus endometrioid carcinoma | Female | <65 | I/II | Unknown | Unknown | SD |
| Page: 1 2 |
Top |
Related drugs of malignant transformation related genes |
| Identification of chemicals and drugs interact with genes involved in malignant transfromation |
| (DGIdb 4.0) |
| Entrez ID | Symbol | Category | Interaction Types | Drug Claim Name | Drug Name | PMIDs |
| 3117 | HLA-DQA1 | CLINICALLY ACTIONABLE | LYMPHOKINES | 2166625 | ||
| 3117 | HLA-DQA1 | CLINICALLY ACTIONABLE | mercaptopurine | MERCAPTOPURINE | 25217962 | |
| 3117 | HLA-DQA1 | CLINICALLY ACTIONABLE | interferon beta-1b | 21502966 | ||
| 3117 | HLA-DQA1 | CLINICALLY ACTIONABLE | Lapatinib | LAPATINIB | ||
| 3117 | HLA-DQA1 | CLINICALLY ACTIONABLE | interferon beta-1a | 21502966 | ||
| 3117 | HLA-DQA1 | CLINICALLY ACTIONABLE | azathioprine | AZATHIOPRINE | 25217962 | |
| 3117 | HLA-DQA1 | CLINICALLY ACTIONABLE | Drugs For Treatment Of Tuberculosis | 12359646 | ||
| 3117 | HLA-DQA1 | CLINICALLY ACTIONABLE | lumiracoxib | LUMIRACOXIB | 20639878 | |
| 3117 | HLA-DQA1 | CLINICALLY ACTIONABLE | lapatinib | LAPATINIB | 24687830,21245432 |
| Page: 1 |

Copyright 2023-Present -The University of Texas Health Science Center at Houston |