
|
|||||
|
 | |
| |
| |
| |
| |
| |
|
Gene: MAPK10 |
Gene summary for MAPK10 |
| Gene information | Species | Human | Gene symbol | MAPK10 | Gene ID | 5602 |
| Gene name | mitogen-activated protein kinase 10 | |
| Gene Alias | JNK3 | |
| Cytomap | 4q21.3 | |
| Gene Type | protein-coding | GO ID | GO:0000122 | UniProtAcc | A0A286YF97 |
Top |
Malignant transformation analysis |
| Identification of the aberrant gene expression in precancerous and cancerous lesions by comparing the gene expression of stem-like cells in diseased tissues with normal stem cells |
| Entrez ID | Symbol | Replicates | Species | Organ | Tissue | Adj P-value | Log2FC | Malignancy |
| 5602 | MAPK10 | CCI_1 | Human | Cervix | CC | 1.40e-30 | 2.46e+00 | 0.528 |
| 5602 | MAPK10 | CCI_3 | Human | Cervix | CC | 6.47e-03 | 1.04e+00 | 0.516 |
| 5602 | MAPK10 | TD9 | Human | Lung | IAC | 5.75e-06 | 9.27e-01 | 0.088 |
| 5602 | MAPK10 | RNA-P10T2-P10T2-1 | Human | Lung | AAH | 3.29e-04 | 9.52e-01 | -0.1271 |
| 5602 | MAPK10 | RNA-P10T2-P10T2-2 | Human | Lung | AAH | 9.24e-10 | 1.25e+00 | -0.1406 |
| 5602 | MAPK10 | RNA-P10T2-P10T2-3 | Human | Lung | AAH | 5.89e-05 | 9.65e-01 | -0.1408 |
| 5602 | MAPK10 | RNA-P10T2-P10T2-4 | Human | Lung | AAH | 2.47e-10 | 1.26e+00 | -0.138 |
| 5602 | MAPK10 | RNA-P17T-P17T-8 | Human | Lung | IAC | 1.46e-03 | 5.38e-01 | 0.3329 |
| 5602 | MAPK10 | RNA-P18T-P18T-2 | Human | Lung | IAC | 2.18e-02 | 1.21e+00 | 0.1129 |
| 5602 | MAPK10 | RNA-P18T-P18T-4 | Human | Lung | IAC | 1.20e-05 | 1.51e+00 | 0.1024 |
| 5602 | MAPK10 | RNA-P18T-P18T-8 | Human | Lung | IAC | 1.77e-04 | 1.55e+00 | 0.1151 |
| 5602 | MAPK10 | RNA-P25T1-P25T1-1 | Human | Lung | AIS | 2.23e-25 | 1.17e+00 | -0.2116 |
| 5602 | MAPK10 | RNA-P25T1-P25T1-2 | Human | Lung | AIS | 4.30e-12 | 1.15e+00 | -0.1941 |
| 5602 | MAPK10 | RNA-P25T1-P25T1-3 | Human | Lung | AIS | 2.42e-15 | 1.09e+00 | -0.2107 |
| 5602 | MAPK10 | RNA-P25T1-P25T1-4 | Human | Lung | AIS | 1.26e-23 | 1.16e+00 | -0.2119 |
| 5602 | MAPK10 | RNA-P6T1-P6T1-1 | Human | Lung | MIAC | 9.11e-08 | 1.33e+00 | -0.0238 |
| 5602 | MAPK10 | RNA-P6T1-P6T1-2 | Human | Lung | MIAC | 2.11e-07 | 1.26e+00 | -0.0186 |
| 5602 | MAPK10 | RNA-P6T1-P6T1-3 | Human | Lung | MIAC | 4.76e-06 | 1.27e+00 | -0.0296 |
| 5602 | MAPK10 | RNA-P6T1-P6T1-4 | Human | Lung | MIAC | 2.06e-13 | 1.42e+00 | -0.0263 |
| 5602 | MAPK10 | RNA-P6T2-P6T2-1 | Human | Lung | IAC | 1.77e-63 | 1.54e+00 | -0.0166 |
| Page: 1 2 3 |
| Tissue | Expression Dynamics | Abbreviation |
| Cervix | 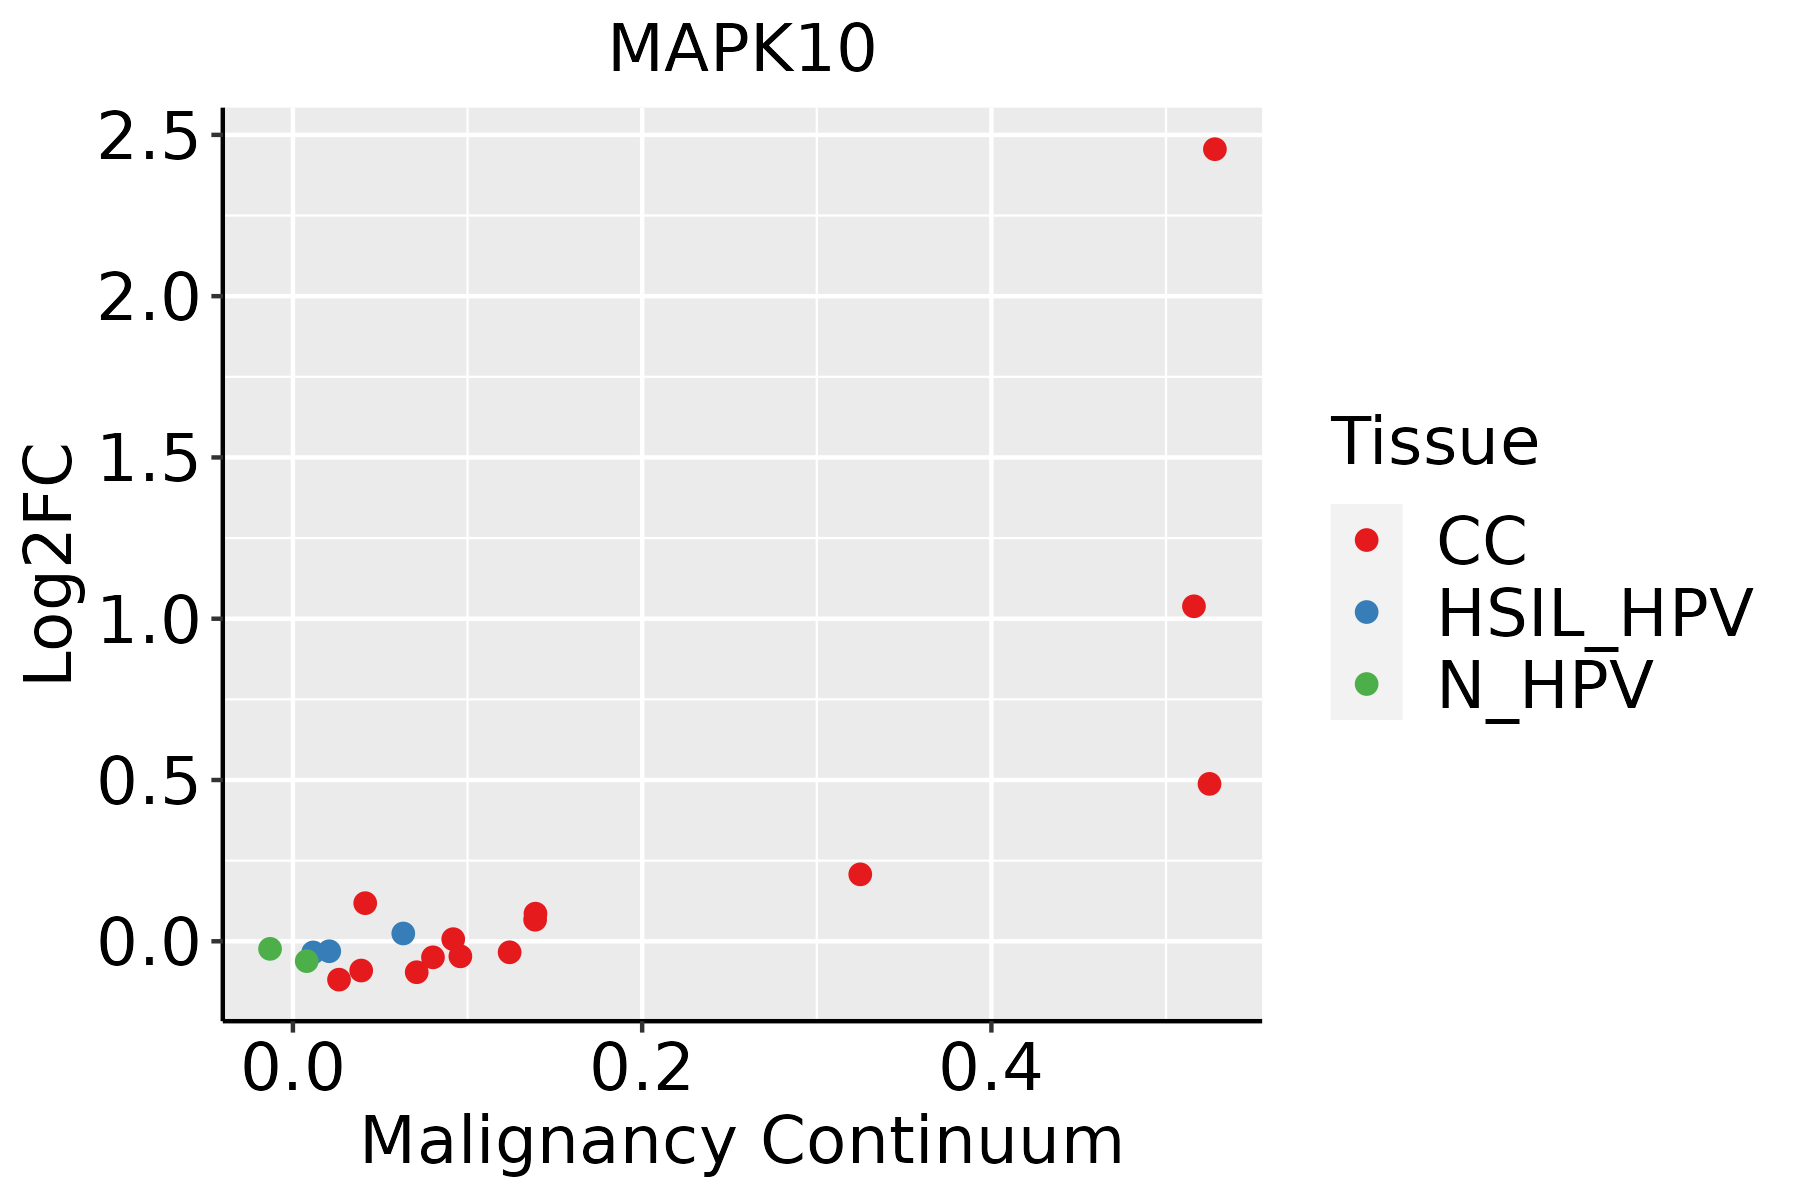 | CC: Cervix cancer |
| HSIL_HPV: HPV-infected high-grade squamous intraepithelial lesions | ||
| N_HPV: HPV-infected normal cervix | ||
| Lung | 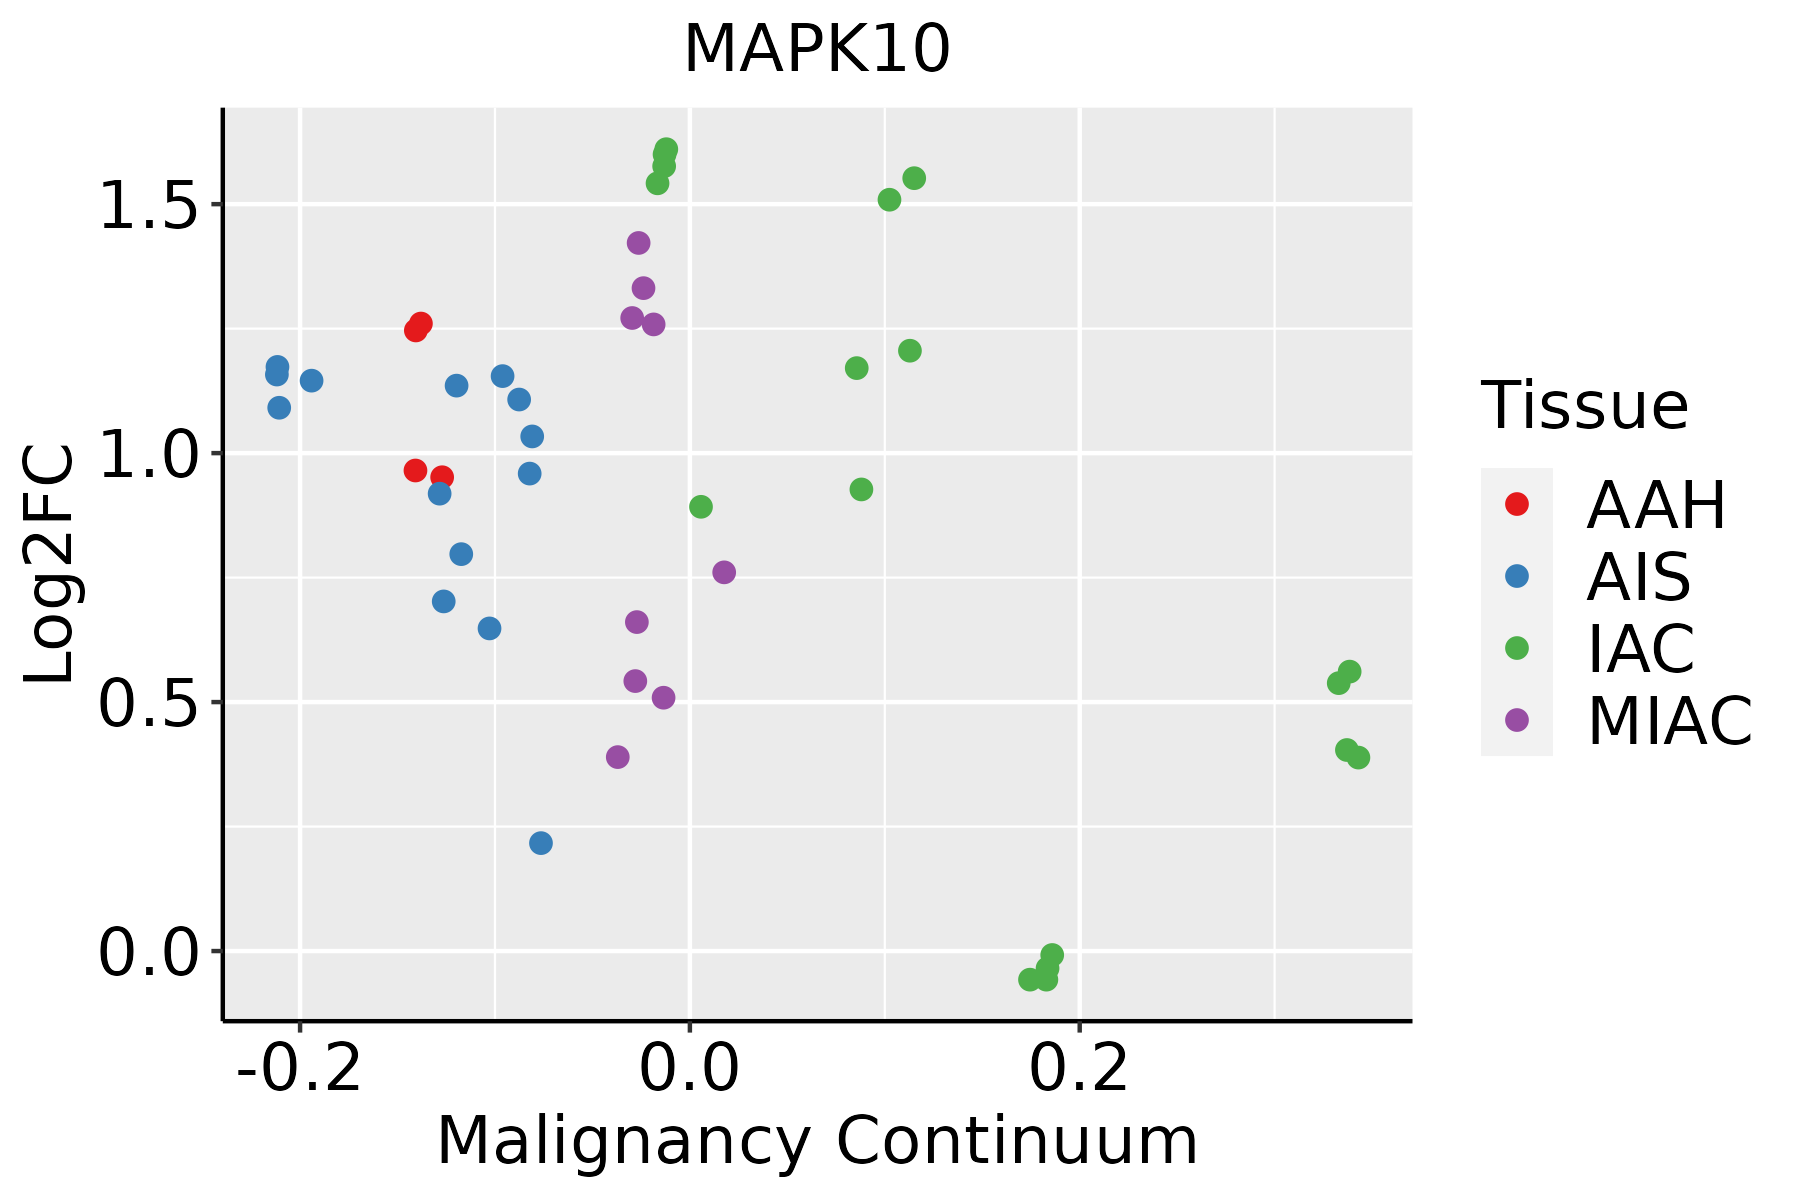 | AAH: Atypical adenomatous hyperplasia |
| AIS: Adenocarcinoma in situ | ||
| IAC: Invasive lung adenocarcinoma | ||
| MIA: Minimally invasive adenocarcinoma | ||
| Prostate | 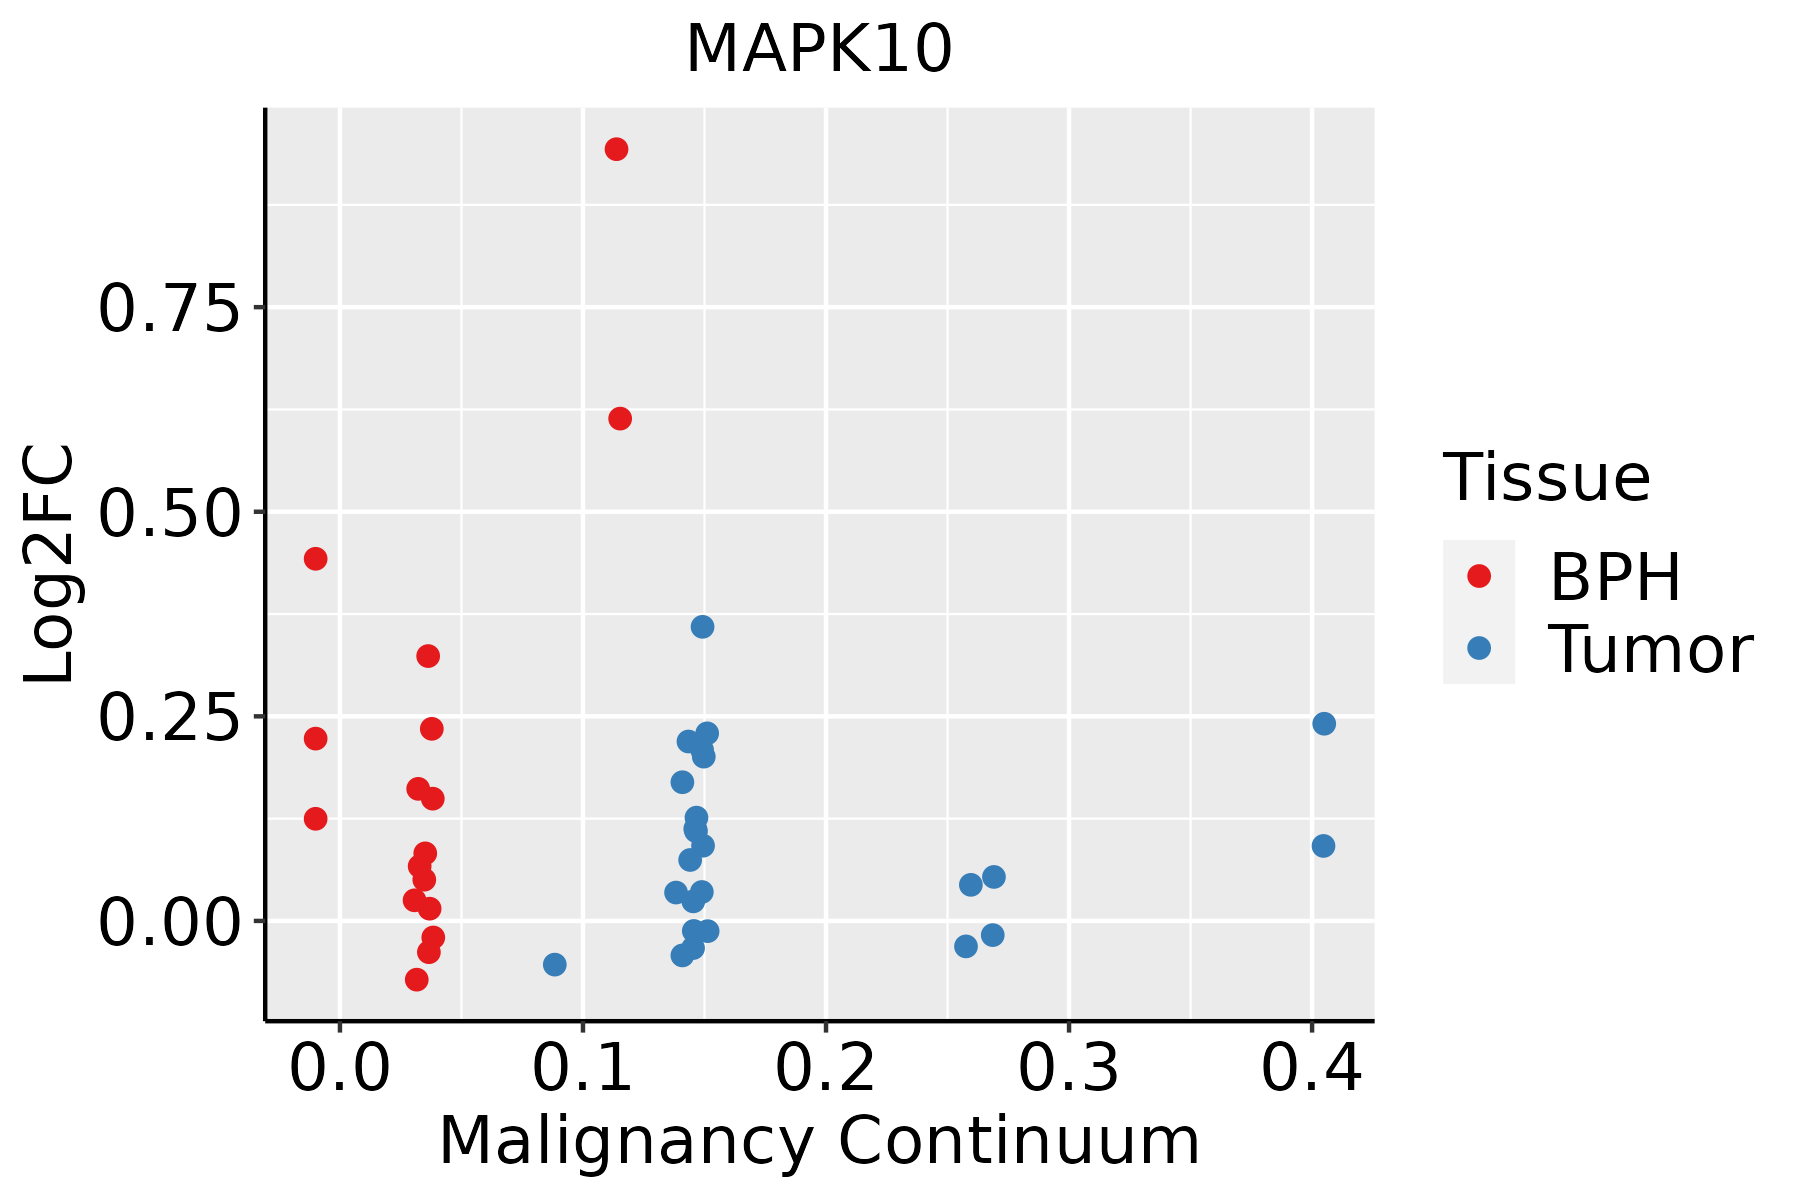 | BPH: Benign Prostatic Hyperplasia |
| Thyroid |  | ATC: Anaplastic thyroid cancer |
| HT: Hashimoto's thyroiditis | ||
| PTC: Papillary thyroid cancer |
| ∗log2FC in expression of this searched gene in stem-like cells from each diseased tissue sample relative to stem-like cells in normal samples in each tissue plotted against the malignancy continuum. Samples are colored based on if they are from different disease stage. |
Top |
Malignant transformation related pathway analysis |
| Find out the enriched GO biological processes and KEGG pathways involved in transition from healthy to precancer to cancer |
| Tissue | Disease Stage | Enriched GO biological Processes |
| Colorectum | AD |  |
| Colorectum | SER |  |
| Colorectum | MSS |  |
| Colorectum | MSI-H |  |
| Colorectum | FAP |  |
| ∗Top 15 enriched GO BP terms are showed in the bar plot of each disease state in each tissue. Each row represents a significant GO biological process which is colored according to the -log10(p.adjust). |
| Page: 1 2 3 4 5 6 7 8 9 |
| GO ID | Tissue | Disease Stage | Description | Gene Ratio | Bg Ratio | pvalue | p.adjust | Count |
| GO:19907788 | Cervix | CC | protein localization to cell periphery | 78/2311 | 333/18723 | 1.22e-08 | 9.73e-07 | 78 |
| GO:006219710 | Cervix | CC | cellular response to chemical stress | 76/2311 | 337/18723 | 1.01e-07 | 5.25e-06 | 76 |
| GO:00027644 | Cervix | CC | immune response-regulating signaling pathway | 97/2311 | 468/18723 | 1.49e-07 | 7.07e-06 | 97 |
| GO:00075689 | Cervix | CC | aging | 75/2311 | 339/18723 | 2.75e-07 | 1.13e-05 | 75 |
| GO:00310988 | Cervix | CC | stress-activated protein kinase signaling cascade | 58/2311 | 247/18723 | 8.02e-07 | 2.89e-05 | 58 |
| GO:00485118 | Cervix | CC | rhythmic process | 65/2311 | 298/18723 | 2.79e-06 | 8.04e-05 | 65 |
| GO:00514038 | Cervix | CC | stress-activated MAPK cascade | 55/2311 | 239/18723 | 2.96e-06 | 8.31e-05 | 55 |
| GO:00380933 | Cervix | CC | Fc receptor signaling pathway | 19/2311 | 50/18723 | 3.42e-06 | 9.17e-05 | 19 |
| GO:00510904 | Cervix | CC | regulation of DNA-binding transcription factor activity | 87/2311 | 440/18723 | 4.85e-06 | 1.22e-04 | 87 |
| GO:00712148 | Cervix | CC | cellular response to abiotic stimulus | 69/2311 | 331/18723 | 7.36e-06 | 1.73e-04 | 69 |
| GO:01040048 | Cervix | CC | cellular response to environmental stimulus | 69/2311 | 331/18723 | 7.36e-06 | 1.73e-04 | 69 |
| GO:00075695 | Cervix | CC | cell aging | 34/2311 | 132/18723 | 1.92e-05 | 3.53e-04 | 34 |
| GO:00093149 | Cervix | CC | response to radiation | 86/2311 | 456/18723 | 3.50e-05 | 5.63e-04 | 86 |
| GO:00988767 | Cervix | CC | vesicle-mediated transport to the plasma membrane | 34/2311 | 136/18723 | 3.75e-05 | 5.91e-04 | 34 |
| GO:0038095 | Cervix | CC | Fc-epsilon receptor signaling pathway | 11/2311 | 24/18723 | 5.28e-05 | 7.88e-04 | 11 |
| GO:00076238 | Cervix | CC | circadian rhythm | 46/2311 | 210/18723 | 6.76e-05 | 9.60e-04 | 46 |
| GO:00901509 | Cervix | CC | establishment of protein localization to membrane | 54/2311 | 260/18723 | 7.67e-05 | 1.05e-03 | 54 |
| GO:00903981 | Cervix | CC | cellular senescence | 25/2311 | 93/18723 | 1.11e-04 | 1.40e-03 | 25 |
| GO:00011016 | Cervix | CC | response to acid chemical | 31/2311 | 135/18723 | 4.16e-04 | 4.22e-03 | 31 |
| GO:0002768 | Cervix | CC | immune response-regulating cell surface receptor signaling pathway | 59/2311 | 315/18723 | 6.64e-04 | 6.11e-03 | 59 |
| Page: 1 2 3 4 5 6 7 8 9 |
| Pathway ID | Tissue | Disease Stage | Description | Gene Ratio | Bg Ratio | pvalue | p.adjust | qvalue | Count |
| hsa0541829 | Prostate | Tumor | Fluid shear stress and atherosclerosis | 58/1791 | 139/8465 | 2.70e-08 | 3.44e-07 | 2.13e-07 | 58 |
| hsa0406822 | Prostate | Tumor | FoxO signaling pathway | 54/1791 | 131/8465 | 1.32e-07 | 1.51e-06 | 9.36e-07 | 54 |
| hsa0516629 | Prostate | Tumor | Human T-cell leukemia virus 1 infection | 78/1791 | 222/8465 | 7.99e-07 | 8.02e-06 | 4.97e-06 | 78 |
| hsa0516927 | Prostate | Tumor | Epstein-Barr virus infection | 72/1791 | 202/8465 | 1.15e-06 | 1.09e-05 | 6.73e-06 | 72 |
| hsa0521025 | Prostate | Tumor | Colorectal cancer | 38/1791 | 86/8465 | 1.24e-06 | 1.14e-05 | 7.08e-06 | 38 |
| hsa0501724 | Prostate | Tumor | Spinocerebellar ataxia | 54/1791 | 143/8465 | 3.50e-06 | 3.13e-05 | 1.94e-05 | 54 |
| hsa0516728 | Prostate | Tumor | Kaposi sarcoma-associated herpesvirus infection | 67/1791 | 194/8465 | 9.21e-06 | 7.81e-05 | 4.85e-05 | 67 |
| hsa0413727 | Prostate | Tumor | Mitophagy - animal | 30/1791 | 72/8465 | 6.31e-05 | 4.64e-04 | 2.88e-04 | 30 |
| hsa0421025 | Prostate | Tumor | Apoptosis | 48/1791 | 136/8465 | 9.03e-05 | 6.10e-04 | 3.78e-04 | 48 |
| hsa0514523 | Prostate | Tumor | Toxoplasmosis | 40/1791 | 112/8465 | 2.55e-04 | 1.43e-03 | 8.87e-04 | 40 |
| hsa0466821 | Prostate | Tumor | TNF signaling pathway | 40/1791 | 114/8465 | 3.88e-04 | 2.07e-03 | 1.29e-03 | 40 |
| hsa0401022 | Prostate | Tumor | MAPK signaling pathway | 87/1791 | 302/8465 | 8.46e-04 | 3.94e-03 | 2.45e-03 | 87 |
| hsa0541729 | Prostate | Tumor | Lipid and atherosclerosis | 65/1791 | 215/8465 | 9.79e-04 | 4.44e-03 | 2.75e-03 | 65 |
| hsa0491022 | Prostate | Tumor | Insulin signaling pathway | 44/1791 | 137/8465 | 1.69e-03 | 7.10e-03 | 4.40e-03 | 44 |
| hsa0517026 | Prostate | Tumor | Human immunodeficiency virus 1 infection | 62/1791 | 212/8465 | 3.05e-03 | 1.12e-02 | 6.94e-03 | 62 |
| hsa0414023 | Prostate | Tumor | Autophagy - animal | 44/1791 | 141/8465 | 3.16e-03 | 1.15e-02 | 7.12e-03 | 44 |
| hsa0493322 | Prostate | Tumor | AGE-RAGE signaling pathway in diabetic complications | 33/1791 | 100/8465 | 3.79e-03 | 1.36e-02 | 8.46e-03 | 33 |
| hsa0421721 | Prostate | Tumor | Necroptosis | 46/1791 | 159/8465 | 1.20e-02 | 3.68e-02 | 2.28e-02 | 46 |
| hsa0501237 | Prostate | Tumor | Parkinson disease | 144/1791 | 266/8465 | 3.33e-33 | 1.10e-30 | 6.83e-31 | 144 |
| hsa0502036 | Prostate | Tumor | Prion disease | 142/1791 | 273/8465 | 2.80e-30 | 3.09e-28 | 1.92e-28 | 142 |
| Page: 1 2 3 4 5 6 7 8 9 10 11 12 13 14 15 16 17 18 19 20 21 22 23 |
Top |
Cell-cell communication analysis |
| Identification of potential cell-cell interactions between two cell types and their ligand-receptor pairs for different disease states |
| Ligand | Receptor | LRpair | Pathway | Tissue | Disease Stage |
| Page: 1 |
Top |
Single-cell gene regulatory network inference analysis |
| Find out the significant the regulons (TFs) and the target genes of each regulon across cell types for different disease states |
| TF | Cell Type | Tissue | Disease Stage | Target Gene | RSS | Regulon Activity |
| ∗The dot plots of a searched regulon are shown for all cell subpopulations in each disease state of each tissue based on the regulon specific score inferred using pySCENIC and by calculating the average expression. |
| Page: 1 |
Top |
Somatic mutation of malignant transformation related genes |
| Annotation of somatic variants for genes involved in malignant transformation |
| Hugo Symbol | Variant Class | Variant Classification | dbSNP RS | HGVSc | HGVSp | HGVSp Short | SWISSPROT | BIOTYPE | SIFT | PolyPhen | Tumor Sample Barcode | Tissue | Histology | Sex | Age | Stage | Therapy Types | Drugs | Outcome |
| MAPK10 | SNV | Missense_Mutation | c.545N>G | p.Ser182Cys | p.S182C | P53779 | protein_coding | deleterious(0) | probably_damaging(0.93) | TCGA-AC-A23H-01 | Breast | breast invasive carcinoma | Female | >=65 | I/II | Unknown | Unknown | PD | |
| MAPK10 | SNV | Missense_Mutation | c.644N>A | p.Gly215Asp | p.G215D | P53779 | protein_coding | tolerated(0.64) | benign(0.013) | TCGA-AN-A0AK-01 | Breast | breast invasive carcinoma | Female | >=65 | I/II | Unknown | Unknown | SD | |
| MAPK10 | SNV | Missense_Mutation | rs143720396 | c.242N>T | p.Ala81Val | p.A81V | P53779 | protein_coding | deleterious(0.01) | probably_damaging(0.954) | TCGA-AR-A1AI-01 | Breast | breast invasive carcinoma | Female | <65 | I/II | Chemotherapy | cytoxan | PD |
| MAPK10 | SNV | Missense_Mutation | c.712N>T | p.Met238Leu | p.M238L | P53779 | protein_coding | tolerated(0.1) | benign(0.03) | TCGA-AR-A24Q-01 | Breast | breast invasive carcinoma | Female | <65 | I/II | Chemotherapy | doxorubicin | SD | |
| MAPK10 | SNV | Missense_Mutation | c.328C>G | p.Arg110Gly | p.R110G | P53779 | protein_coding | deleterious(0) | probably_damaging(1) | TCGA-GM-A2DA-01 | Breast | breast invasive carcinoma | Female | <65 | I/II | Chemotherapy | fluorouracil | PD | |
| MAPK10 | insertion | In_Frame_Ins | novel | c.1309_1310insTTGATGATAAGAATCTCTCTCTGGAACTGAGCAGAATTG | p.Ser437delinsPheAspAspLysAsnLeuSerLeuGluLeuSerArgIleAla | p.S437delinsFDDKNLSLELSRIA | P53779 | protein_coding | TCGA-AO-A0J9-01 | Breast | breast invasive carcinoma | Female | <65 | III/IV | Chemotherapy | cyclophosphamide | PD | ||
| MAPK10 | insertion | In_Frame_Ins | novel | c.1113_1114insAAAGCTTGCCCC | p.Pro371_Pro372insLysAlaCysPro | p.P371_P372insKACP | P53779 | protein_coding | TCGA-AR-A0U0-01 | Breast | breast invasive carcinoma | Female | >=65 | I/II | Unknown | Unknown | SD | ||
| MAPK10 | SNV | Missense_Mutation | novel | c.1120N>G | p.Gln374Glu | p.Q374E | P53779 | protein_coding | tolerated(0.61) | benign(0.001) | TCGA-EK-A2PG-01 | Cervix | cervical & endocervical cancer | Female | >=65 | I/II | Unknown | Unknown | SD |
| MAPK10 | SNV | Missense_Mutation | rs752620406 | c.680N>A | p.Arg227His | p.R227H | P53779 | protein_coding | deleterious(0.01) | possibly_damaging(0.466) | TCGA-A6-5661-01 | Colorectum | colon adenocarcinoma | Female | >=65 | I/II | Unknown | Unknown | SD |
| MAPK10 | SNV | Missense_Mutation | rs757125320 | c.959C>T | p.Ala320Val | p.A320V | P53779 | protein_coding | tolerated(0.2) | benign(0.041) | TCGA-AA-3713-01 | Colorectum | colon adenocarcinoma | Male | >=65 | III/IV | Chemotherapy | 5-fluorouracil | PR |
| Page: 1 2 3 4 5 6 7 |
Top |
Related drugs of malignant transformation related genes |
| Identification of chemicals and drugs interact with genes involved in malignant transfromation |
| (DGIdb 4.0) |
| Entrez ID | Symbol | Category | Interaction Types | Drug Claim Name | Drug Name | PMIDs |
| 5602 | MAPK10 | KINASE, TRANSCRIPTION FACTOR, ENZYME, DRUGGABLE GENOME, SERINE THREONINE KINASE | DORAMAPIMOD | DORAMAPIMOD | ||
| 5602 | MAPK10 | KINASE, TRANSCRIPTION FACTOR, ENZYME, DRUGGABLE GENOME, SERINE THREONINE KINASE | PMID25991433-Compound-P6 | |||
| 5602 | MAPK10 | KINASE, TRANSCRIPTION FACTOR, ENZYME, DRUGGABLE GENOME, SERINE THREONINE KINASE | AM-111 | BRIMAPITIDE, C-TERMINAL ACID | ||
| 5602 | MAPK10 | KINASE, TRANSCRIPTION FACTOR, ENZYME, DRUGGABLE GENOME, SERINE THREONINE KINASE | PMID25991433-Compound-P4 | |||
| 5602 | MAPK10 | KINASE, TRANSCRIPTION FACTOR, ENZYME, DRUGGABLE GENOME, SERINE THREONINE KINASE | BLEOMYCIN A5 | 14675139 | ||
| 5602 | MAPK10 | KINASE, TRANSCRIPTION FACTOR, ENZYME, DRUGGABLE GENOME, SERINE THREONINE KINASE | inhibitor | 178102620 | ||
| 5602 | MAPK10 | KINASE, TRANSCRIPTION FACTOR, ENZYME, DRUGGABLE GENOME, SERINE THREONINE KINASE | SB-202190 | SB-202190 | 22951114 | |
| 5602 | MAPK10 | KINASE, TRANSCRIPTION FACTOR, ENZYME, DRUGGABLE GENOME, SERINE THREONINE KINASE | AG-1879 | CHEMBL406845 | ||
| 5602 | MAPK10 | KINASE, TRANSCRIPTION FACTOR, ENZYME, DRUGGABLE GENOME, SERINE THREONINE KINASE | ARSENIC TRIOXIDE | 17332940 | ||
| 5602 | MAPK10 | KINASE, TRANSCRIPTION FACTOR, ENZYME, DRUGGABLE GENOME, SERINE THREONINE KINASE | AST-487 | AST-487 |
| Page: 1 2 3 4 5 6 7 |

Copyright 2023-Present -The University of Texas Health Science Center at Houston |