
|
|||||
|
 | |
| |
| |
| |
| |
| |
|
Gene: COX5A |
Gene summary for COX5A |
| Gene information | Species | Human | Gene symbol | COX5A | Gene ID | 9377 |
| Gene name | cytochrome c oxidase subunit 5A | |
| Gene Alias | COX | |
| Cytomap | 15q24.2 | |
| Gene Type | protein-coding | GO ID | GO:0006091 | UniProtAcc | P20674 |
Top |
Malignant transformation analysis |
| Identification of the aberrant gene expression in precancerous and cancerous lesions by comparing the gene expression of stem-like cells in diseased tissues with normal stem cells |
| Entrez ID | Symbol | Replicates | Species | Organ | Tissue | Adj P-value | Log2FC | Malignancy |
| 9377 | COX5A | CA_HPV_1 | Human | Cervix | CC | 7.82e-09 | -1.49e-01 | 0.0264 |
| 9377 | COX5A | CA_HPV_3 | Human | Cervix | CC | 4.27e-07 | -1.73e-02 | 0.0414 |
| 9377 | COX5A | CCI_1 | Human | Cervix | CC | 1.93e-07 | -6.82e-01 | 0.528 |
| 9377 | COX5A | CCI_3 | Human | Cervix | CC | 5.12e-09 | -6.55e-01 | 0.516 |
| 9377 | COX5A | CCII_1 | Human | Cervix | CC | 2.62e-23 | -7.97e-01 | 0.3249 |
| 9377 | COX5A | sample3 | Human | Cervix | CC | 4.09e-02 | 2.09e-02 | 0.1387 |
| 9377 | COX5A | L1 | Human | Cervix | CC | 8.93e-08 | -2.55e-01 | 0.0802 |
| 9377 | COX5A | HTA11_3410_2000001011 | Human | Colorectum | AD | 7.32e-27 | 8.16e-01 | 0.0155 |
| 9377 | COX5A | HTA11_2487_2000001011 | Human | Colorectum | SER | 9.99e-37 | 1.55e+00 | -0.1808 |
| 9377 | COX5A | HTA11_2951_2000001011 | Human | Colorectum | AD | 3.91e-05 | 8.67e-01 | 0.0216 |
| 9377 | COX5A | HTA11_1938_2000001011 | Human | Colorectum | AD | 6.07e-24 | 1.43e+00 | -0.0811 |
| 9377 | COX5A | HTA11_78_2000001011 | Human | Colorectum | AD | 1.32e-15 | 8.50e-01 | -0.1088 |
| 9377 | COX5A | HTA11_347_2000001011 | Human | Colorectum | AD | 1.83e-73 | 2.04e+00 | -0.1954 |
| 9377 | COX5A | HTA11_411_2000001011 | Human | Colorectum | SER | 2.67e-14 | 1.62e+00 | -0.2602 |
| 9377 | COX5A | HTA11_2112_2000001011 | Human | Colorectum | SER | 2.88e-05 | 1.14e+00 | -0.2196 |
| 9377 | COX5A | HTA11_3361_2000001011 | Human | Colorectum | AD | 1.09e-24 | 1.42e+00 | -0.1207 |
| 9377 | COX5A | HTA11_83_2000001011 | Human | Colorectum | SER | 2.19e-24 | 1.79e+00 | -0.1526 |
| 9377 | COX5A | HTA11_696_2000001011 | Human | Colorectum | AD | 1.11e-48 | 1.41e+00 | -0.1464 |
| 9377 | COX5A | HTA11_866_2000001011 | Human | Colorectum | AD | 6.43e-30 | 1.11e+00 | -0.1001 |
| 9377 | COX5A | HTA11_1391_2000001011 | Human | Colorectum | AD | 1.46e-36 | 1.66e+00 | -0.059 |
| Page: 1 2 3 4 5 6 7 8 9 10 11 12 13 14 |
| Tissue | Expression Dynamics | Abbreviation |
| Cervix |  | CC: Cervix cancer |
| HSIL_HPV: HPV-infected high-grade squamous intraepithelial lesions | ||
| N_HPV: HPV-infected normal cervix | ||
| Colorectum (GSE201348) | 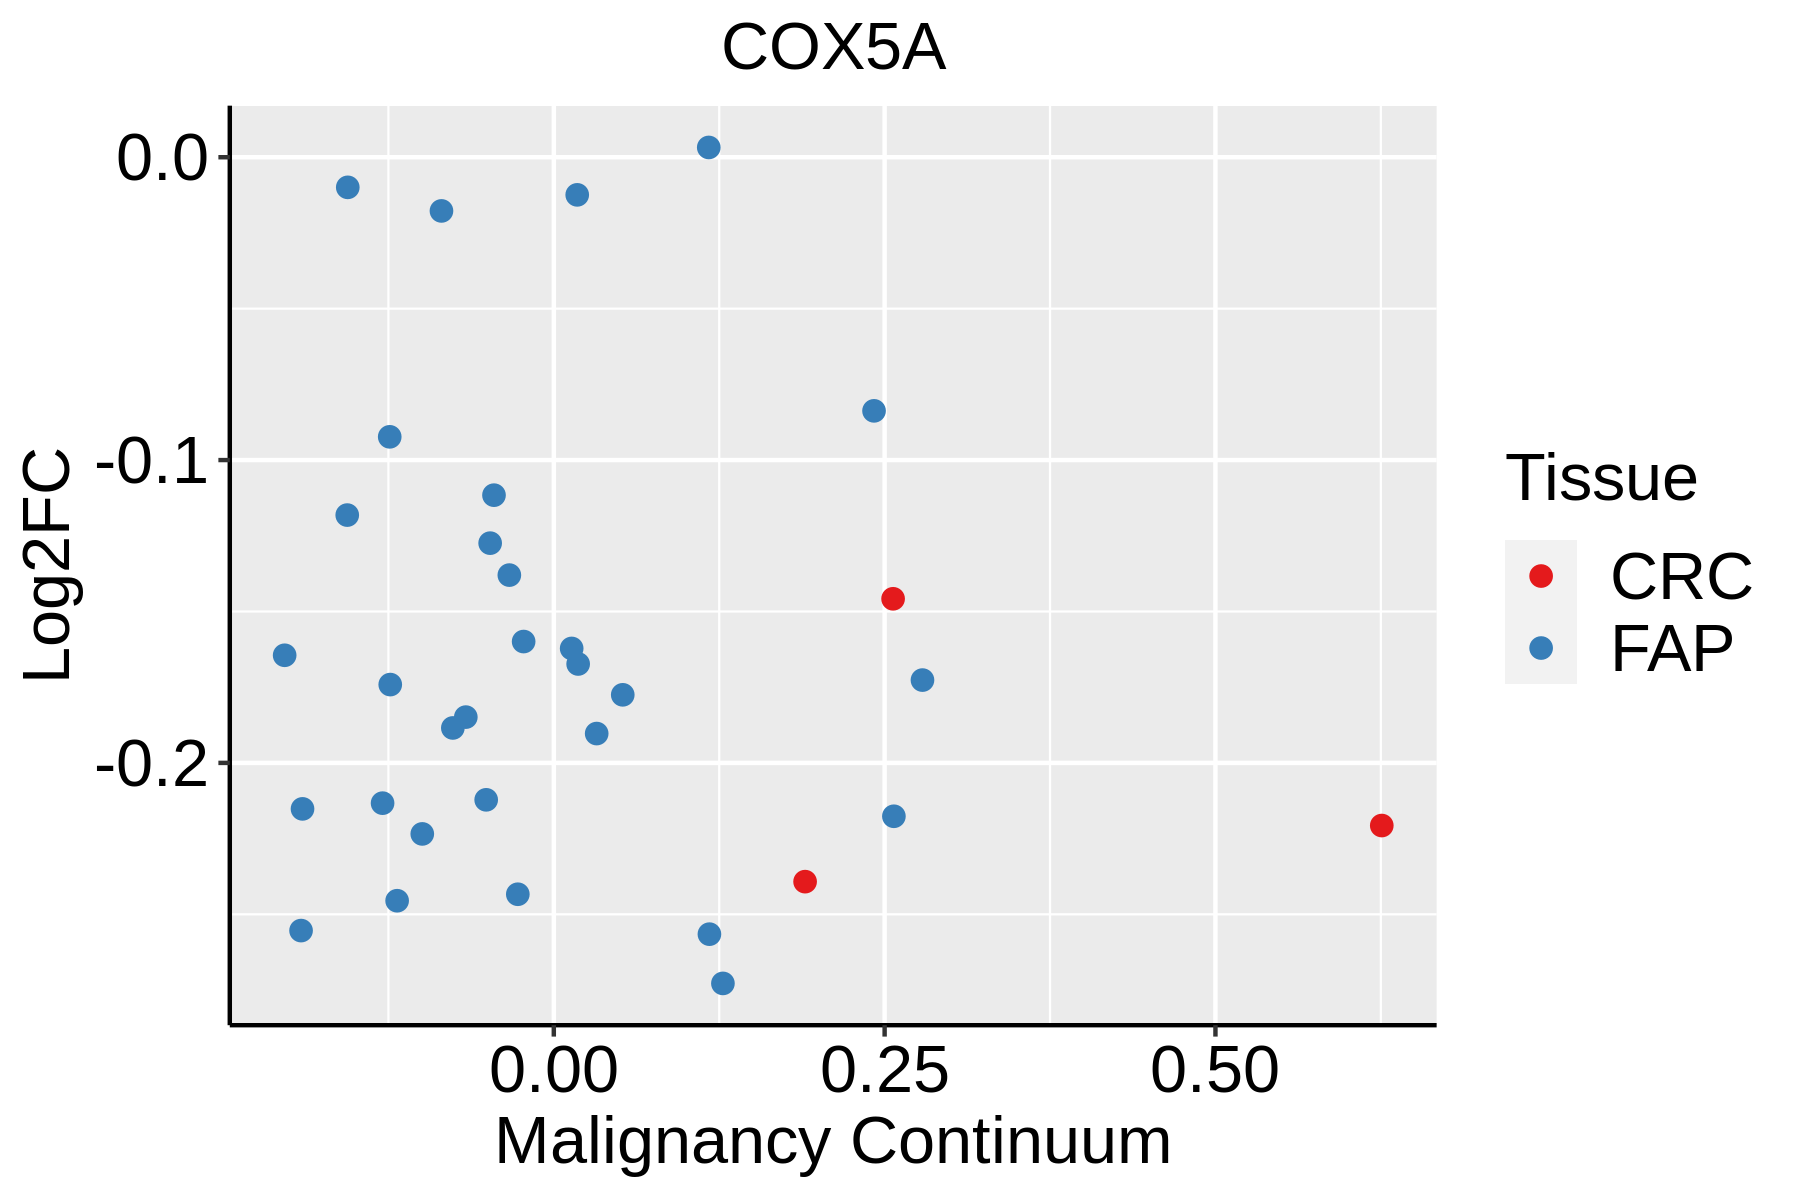 | FAP: Familial adenomatous polyposis |
| CRC: Colorectal cancer | ||
| Colorectum (HTA11) |  | AD: Adenomas |
| SER: Sessile serrated lesions | ||
| MSI-H: Microsatellite-high colorectal cancer | ||
| MSS: Microsatellite stable colorectal cancer | ||
| Endometrium | 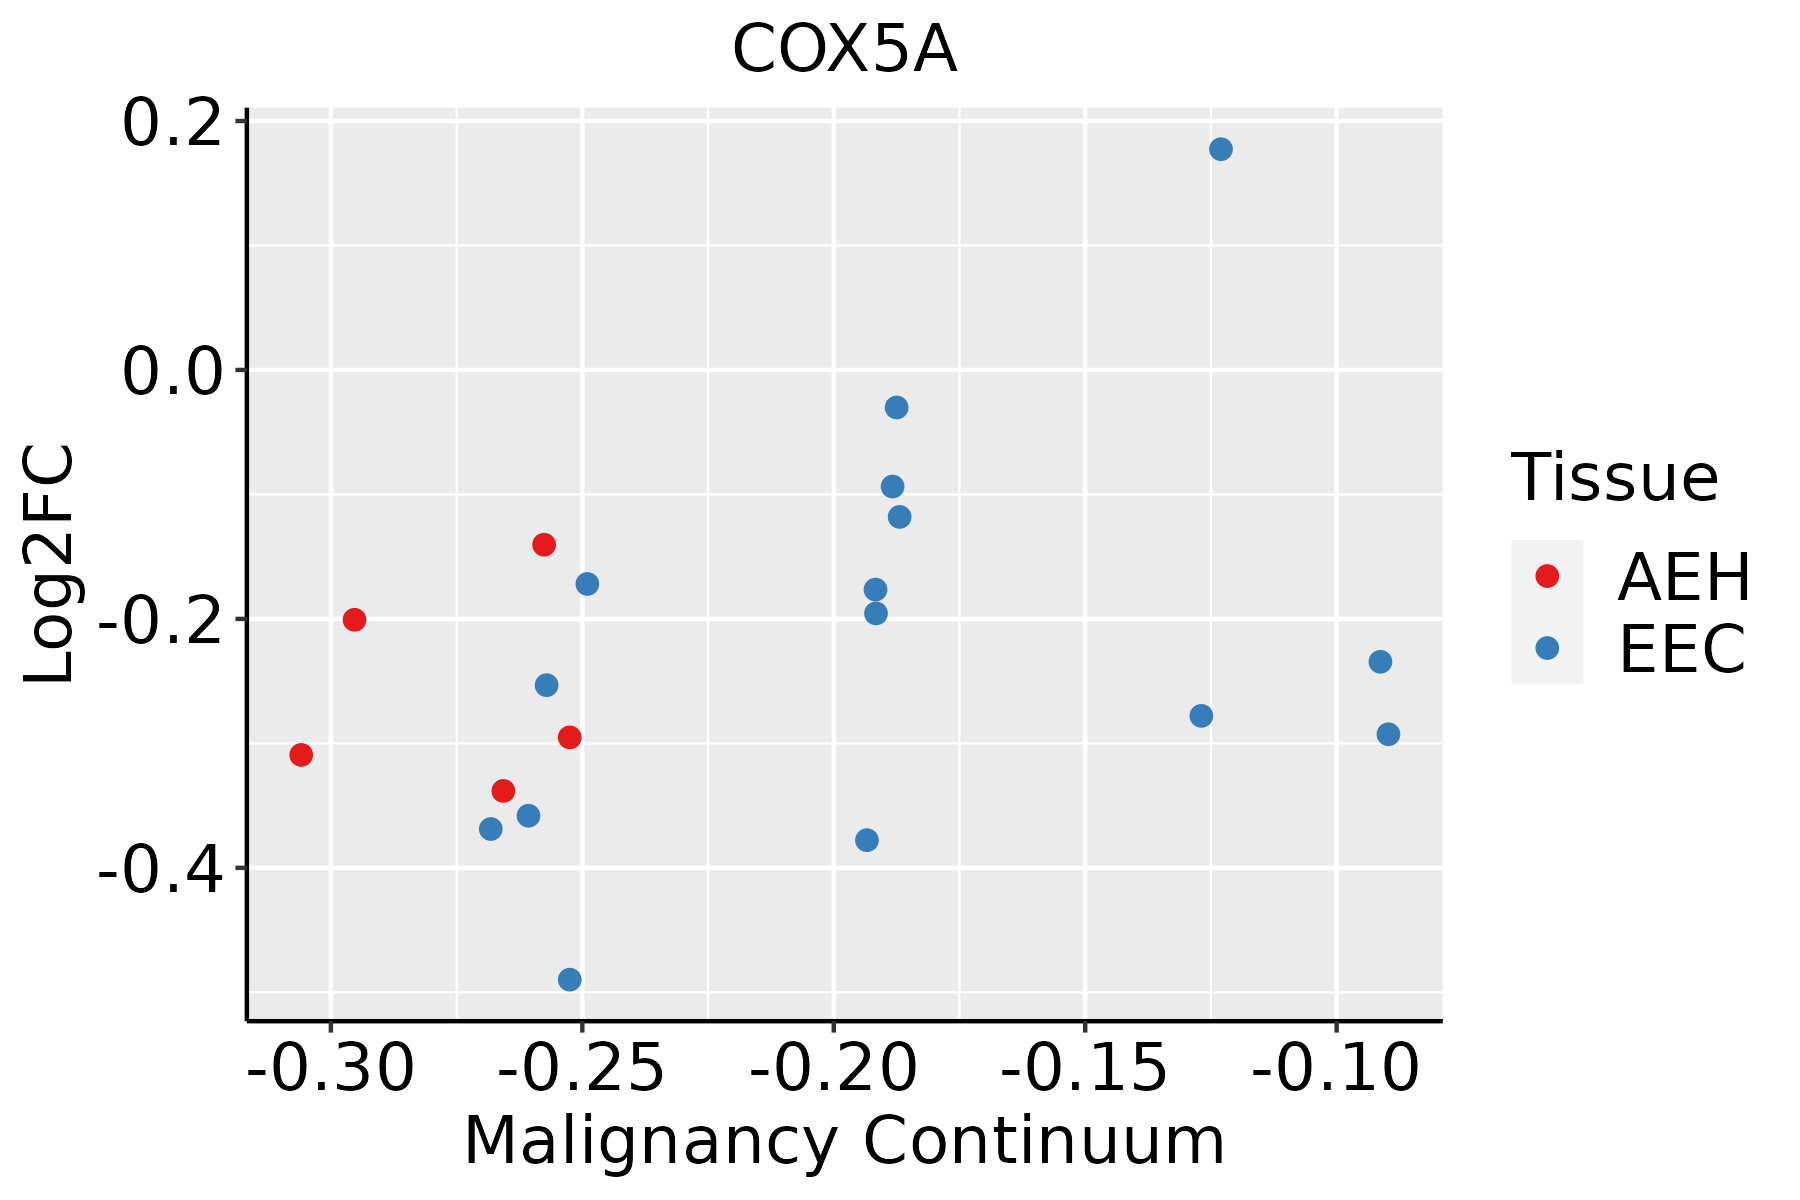 | AEH: Atypical endometrial hyperplasia |
| EEC: Endometrioid Cancer | ||
| Esophagus |  | ESCC: Esophageal squamous cell carcinoma |
| HGIN: High-grade intraepithelial neoplasias | ||
| LGIN: Low-grade intraepithelial neoplasias | ||
| GC | 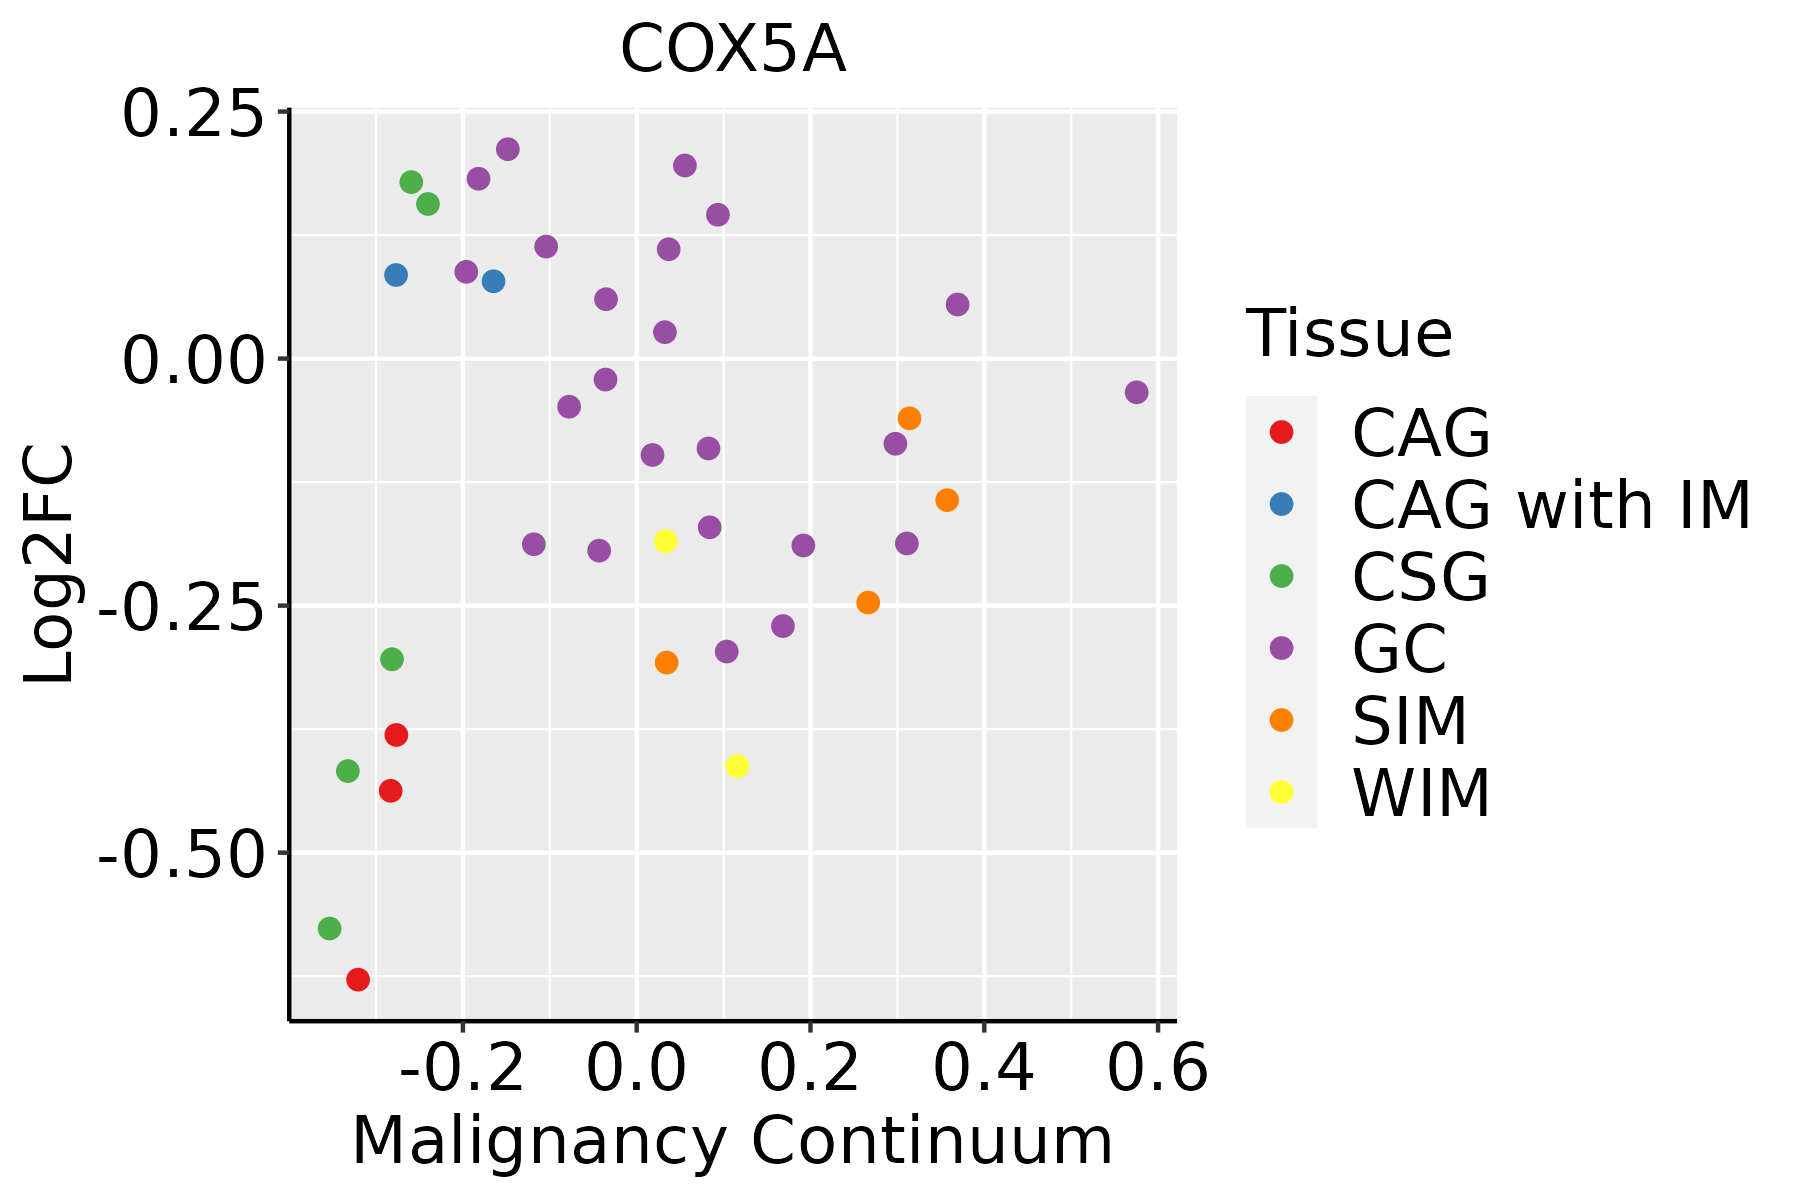 | CAG: Chronic atrophic gastritis |
| CAG with IM: Chronic atrophic gastritis with intestinal metaplasia | ||
| CSG: Chronic superficial gastritis | ||
| GC: Gastric cancer | ||
| SIM: Severe intestinal metaplasia | ||
| WIM: Wild intestinal metaplasia | ||
| Liver |  | HCC: Hepatocellular carcinoma |
| NAFLD: Non-alcoholic fatty liver disease | ||
| Oral Cavity |  | EOLP: Erosive Oral lichen planus |
| LP: leukoplakia | ||
| NEOLP: Non-erosive oral lichen planus | ||
| OSCC: Oral squamous cell carcinoma | ||
| Prostate | 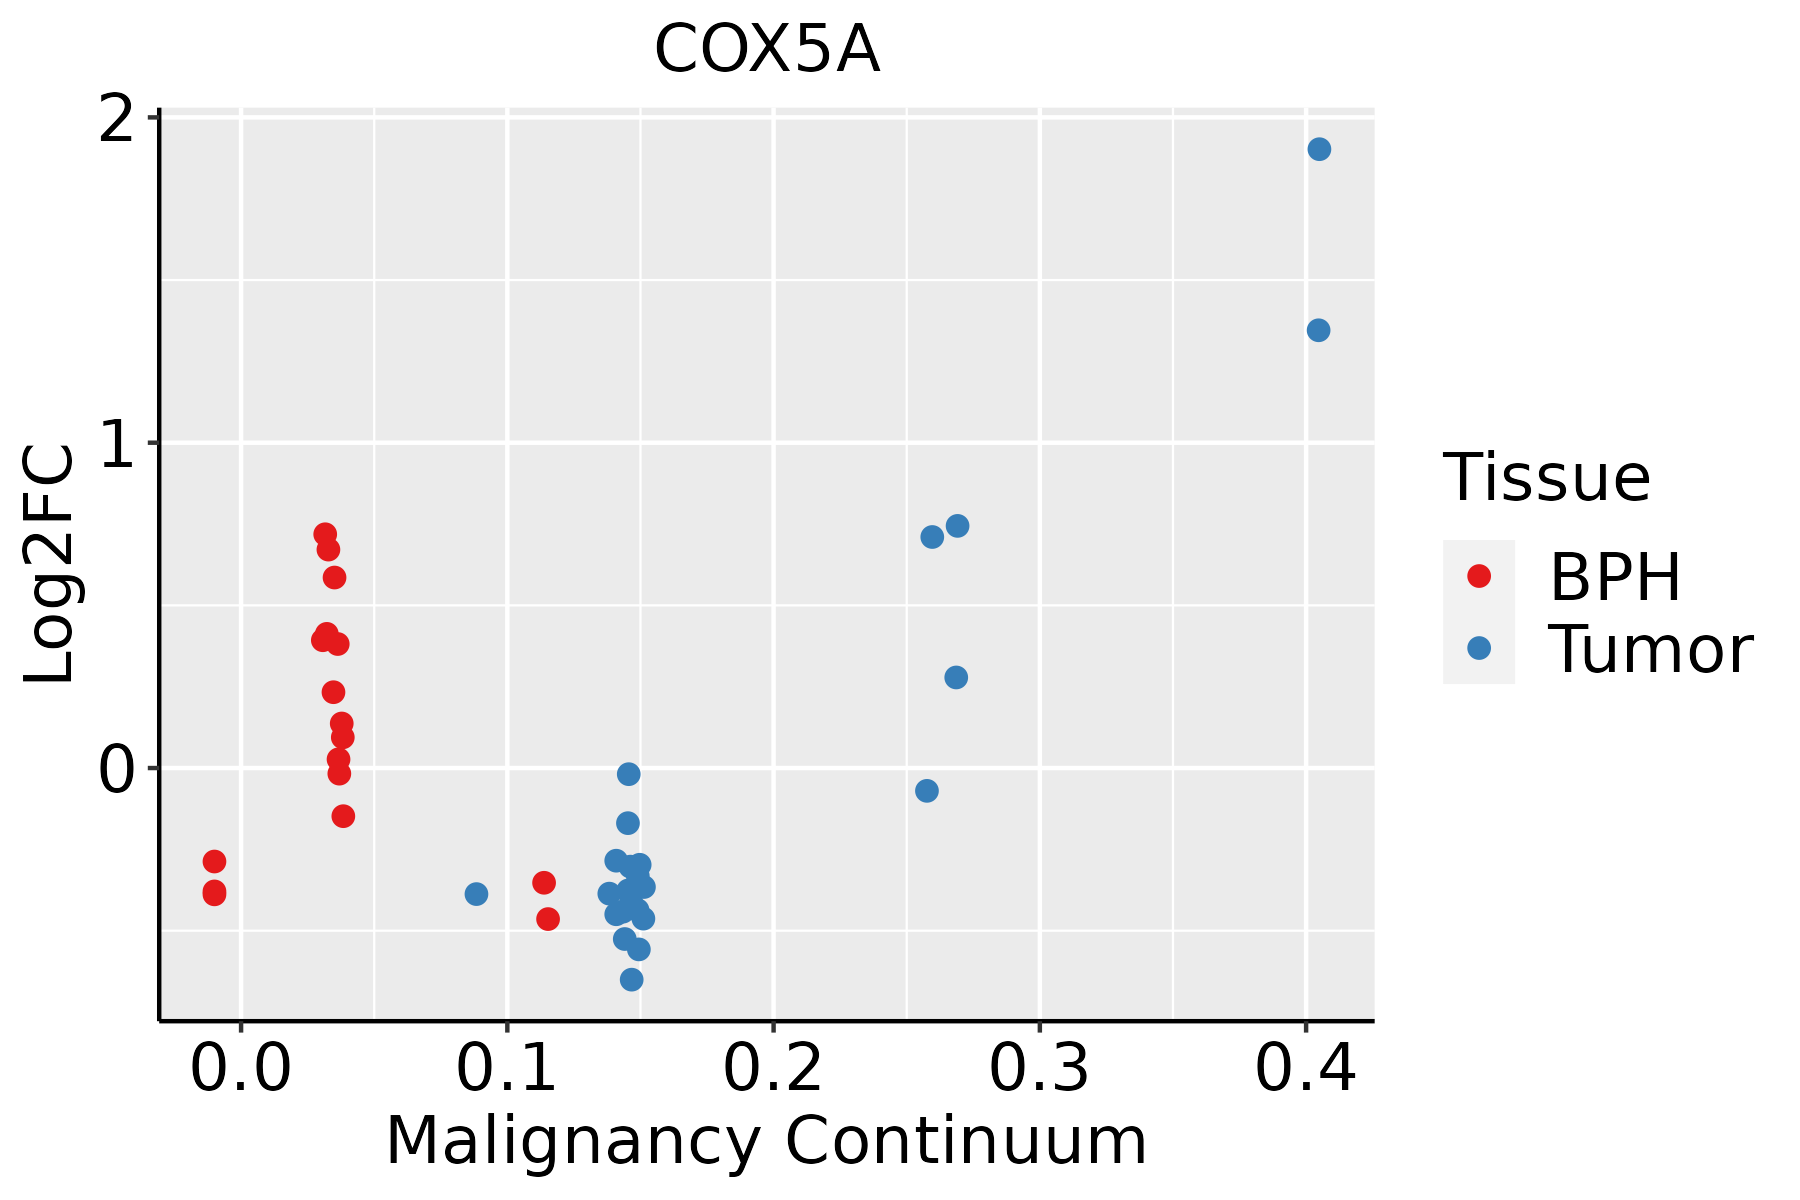 | BPH: Benign Prostatic Hyperplasia |
| Skin | 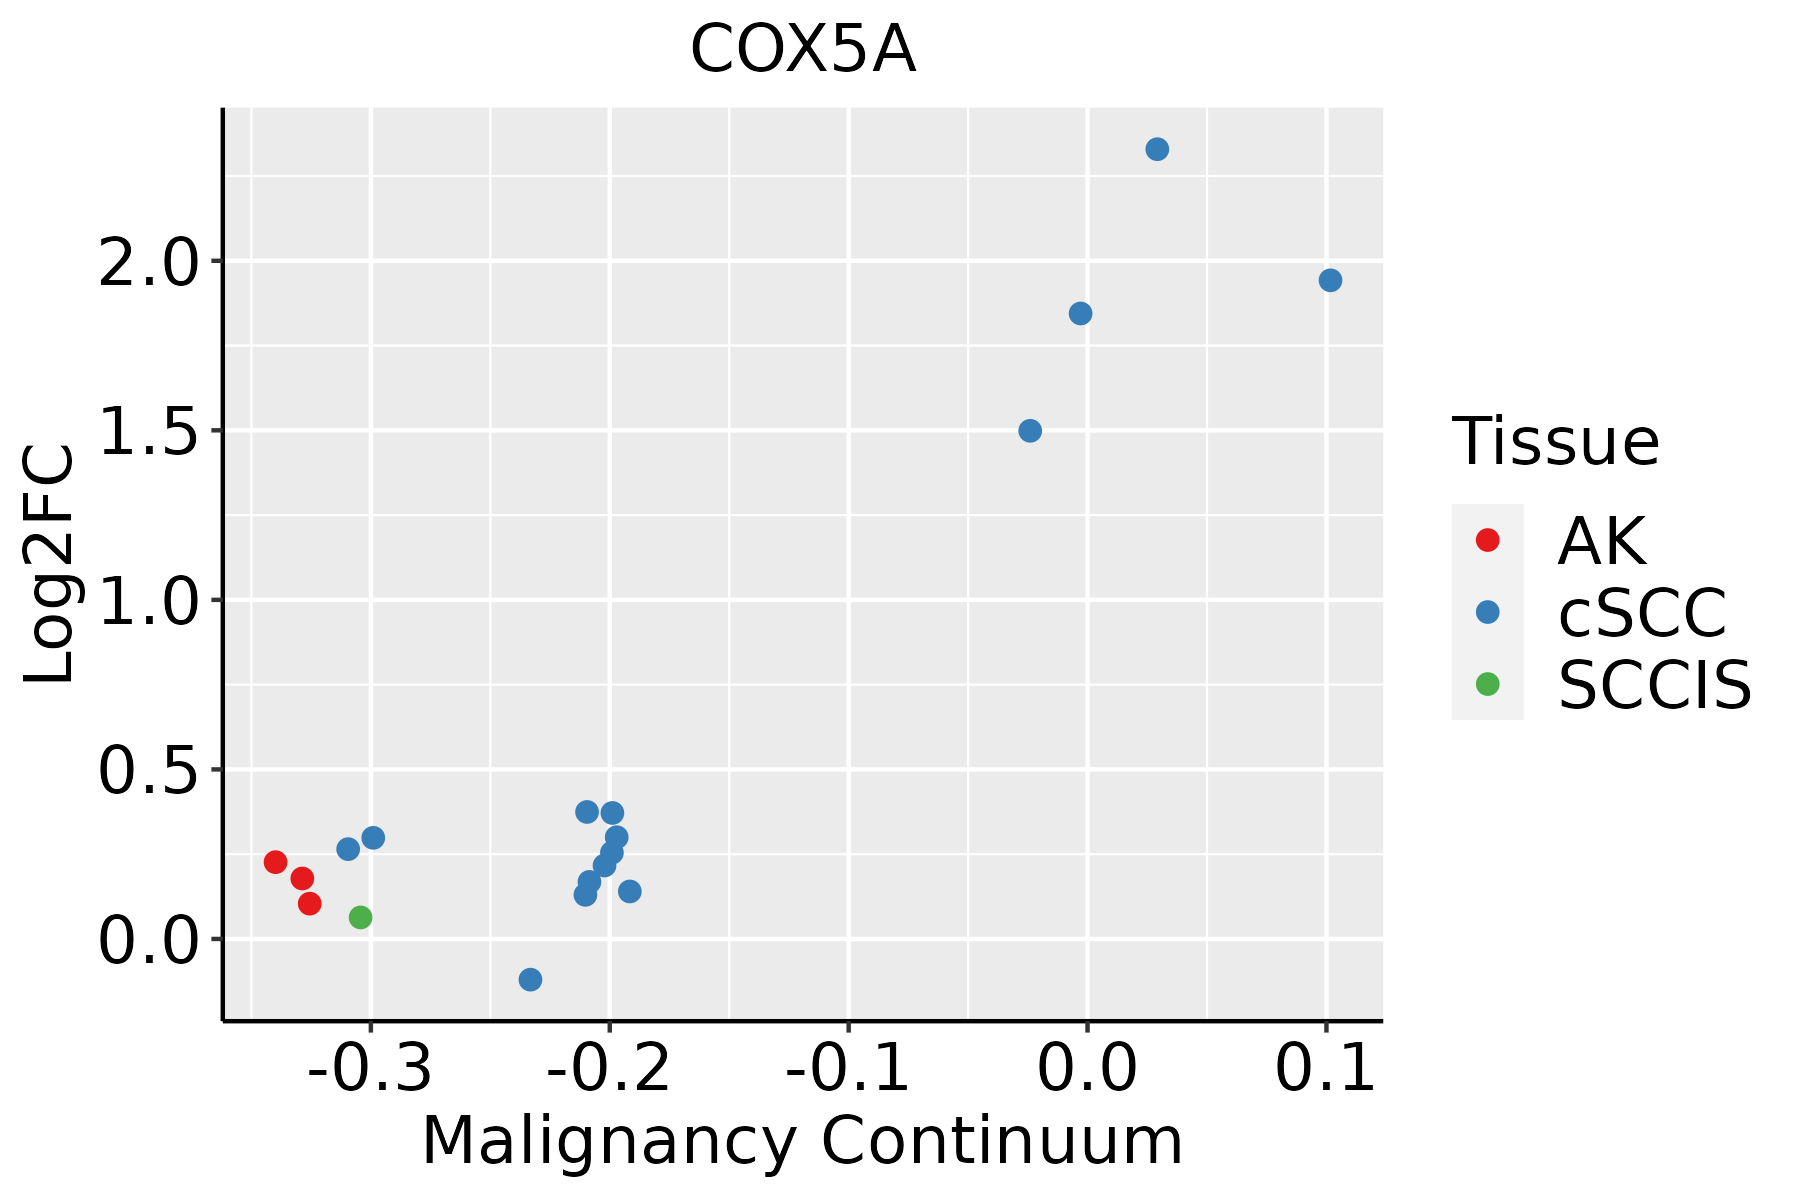 | AK: Actinic keratosis |
| cSCC: Cutaneous squamous cell carcinoma | ||
| SCCIS:squamous cell carcinoma in situ | ||
| Thyroid | 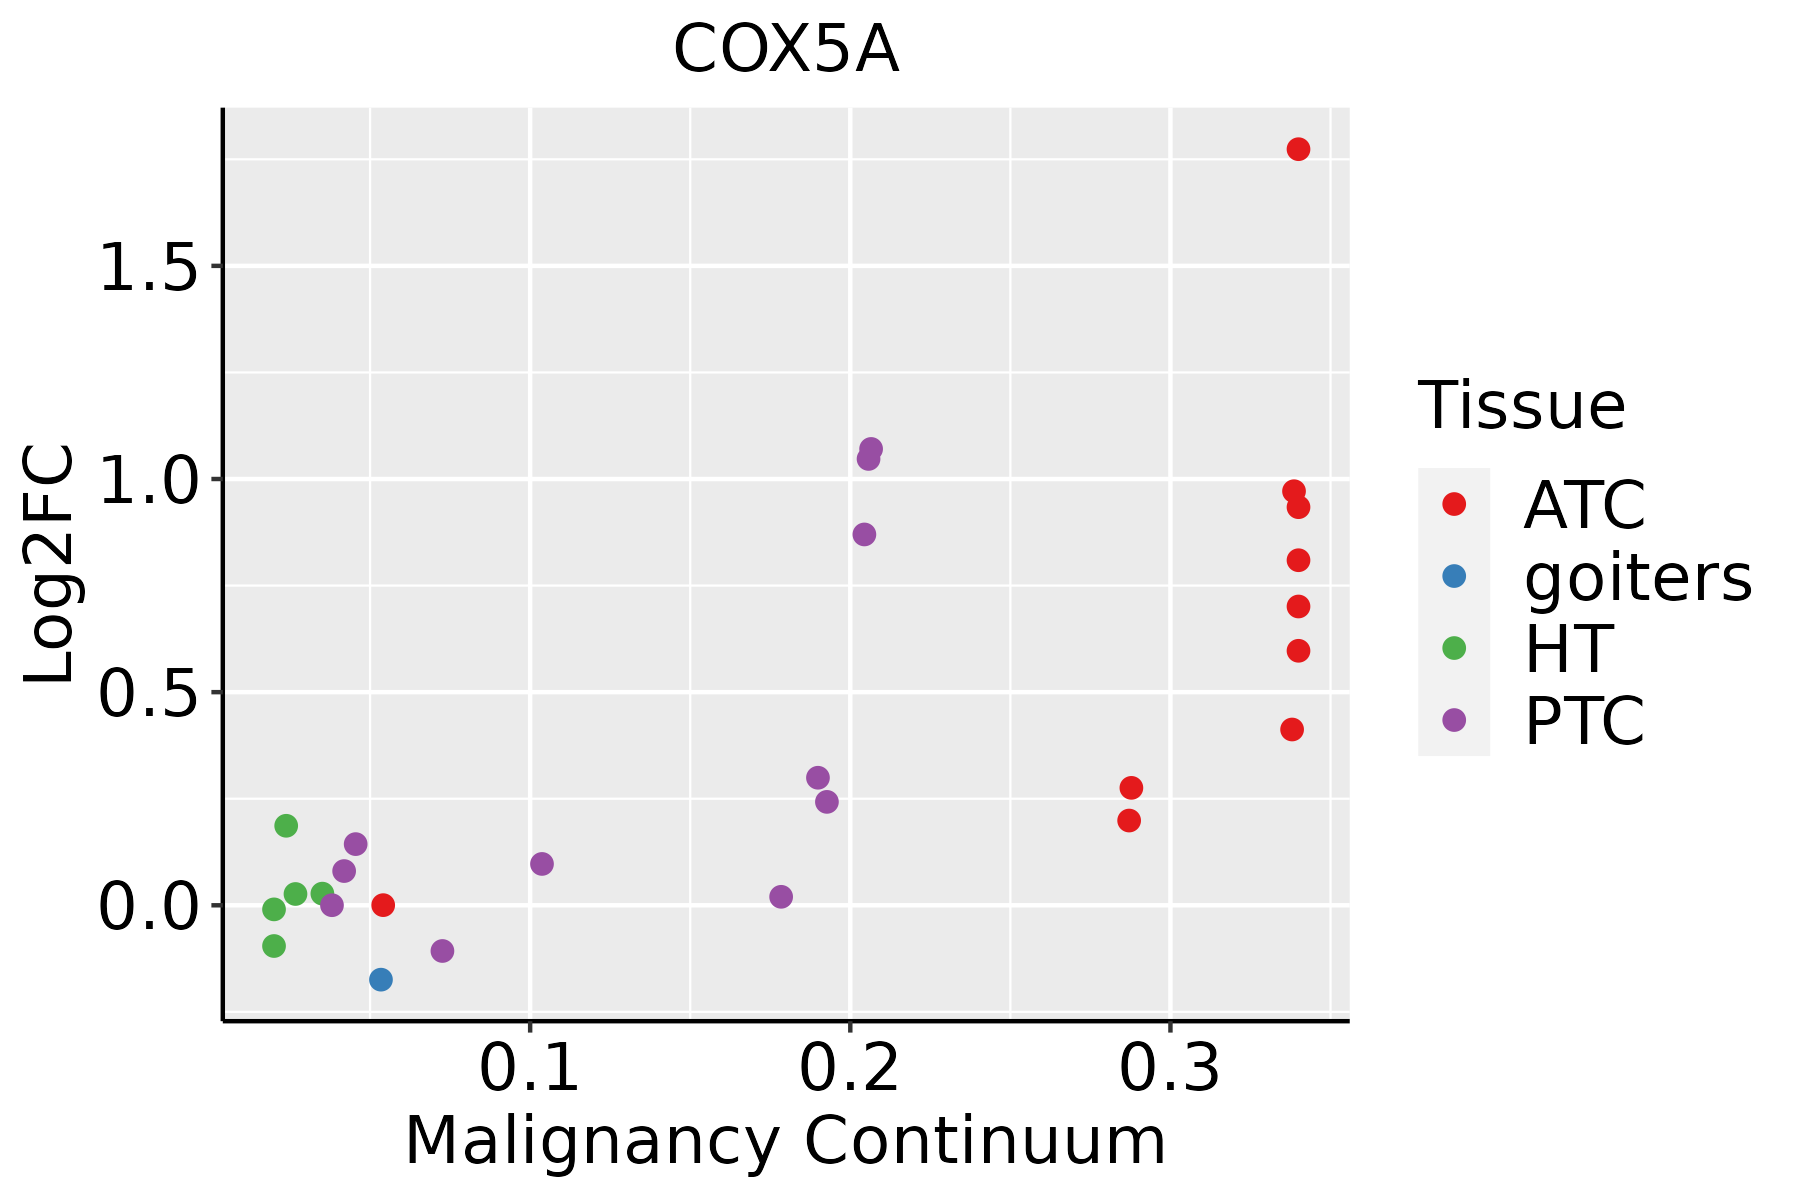 | ATC: Anaplastic thyroid cancer |
| HT: Hashimoto's thyroiditis | ||
| PTC: Papillary thyroid cancer |
| ∗log2FC in expression of this searched gene in stem-like cells from each diseased tissue sample relative to stem-like cells in normal samples in each tissue plotted against the malignancy continuum. Samples are colored based on if they are from different disease stage. |
Top |
Malignant transformation related pathway analysis |
| Find out the enriched GO biological processes and KEGG pathways involved in transition from healthy to precancer to cancer |
| Tissue | Disease Stage | Enriched GO biological Processes |
| Colorectum | AD |  |
| Colorectum | SER |  |
| Colorectum | MSS |  |
| Colorectum | MSI-H |  |
| Colorectum | FAP |  |
| ∗Top 15 enriched GO BP terms are showed in the bar plot of each disease state in each tissue. Each row represents a significant GO biological process which is colored according to the -log10(p.adjust). |
| Page: 1 2 3 4 5 6 7 8 9 |
| GO ID | Tissue | Disease Stage | Description | Gene Ratio | Bg Ratio | pvalue | p.adjust | Count |
| GO:004603410 | Cervix | CC | ATP metabolic process | 90/2311 | 277/18723 | 7.90e-19 | 2.36e-15 | 90 |
| GO:000611910 | Cervix | CC | oxidative phosphorylation | 55/2311 | 141/18723 | 7.12e-16 | 1.42e-12 | 55 |
| GO:00090609 | Cervix | CC | aerobic respiration | 60/2311 | 189/18723 | 1.59e-12 | 6.36e-10 | 60 |
| GO:00427739 | Cervix | CC | ATP synthesis coupled electron transport | 38/2311 | 95/18723 | 8.45e-12 | 2.66e-09 | 38 |
| GO:00427759 | Cervix | CC | mitochondrial ATP synthesis coupled electron transport | 38/2311 | 95/18723 | 8.45e-12 | 2.66e-09 | 38 |
| GO:00196469 | Cervix | CC | aerobic electron transport chain | 36/2311 | 87/18723 | 9.15e-12 | 2.74e-09 | 36 |
| GO:00229049 | Cervix | CC | respiratory electron transport chain | 42/2311 | 114/18723 | 1.67e-11 | 4.77e-09 | 42 |
| GO:00453339 | Cervix | CC | cellular respiration | 66/2311 | 230/18723 | 2.07e-11 | 5.39e-09 | 66 |
| GO:00229009 | Cervix | CC | electron transport chain | 53/2311 | 175/18723 | 2.23e-10 | 3.43e-08 | 53 |
| GO:00060919 | Cervix | CC | generation of precursor metabolites and energy | 105/2311 | 490/18723 | 7.40e-09 | 6.61e-07 | 105 |
| GO:00159809 | Cervix | CC | energy derivation by oxidation of organic compounds | 74/2311 | 318/18723 | 3.83e-08 | 2.53e-06 | 74 |
| GO:19026009 | Cervix | CC | proton transmembrane transport | 39/2311 | 157/18723 | 1.23e-05 | 2.57e-04 | 39 |
| GO:00061239 | Cervix | CC | mitochondrial electron transport, cytochrome c to oxygen | 9/2311 | 21/18723 | 4.77e-04 | 4.69e-03 | 9 |
| GO:0046034 | Colorectum | AD | ATP metabolic process | 142/3918 | 277/18723 | 2.64e-29 | 8.26e-26 | 142 |
| GO:0006091 | Colorectum | AD | generation of precursor metabolites and energy | 209/3918 | 490/18723 | 3.17e-28 | 6.61e-25 | 209 |
| GO:0009060 | Colorectum | AD | aerobic respiration | 108/3918 | 189/18723 | 9.14e-28 | 1.43e-24 | 108 |
| GO:0045333 | Colorectum | AD | cellular respiration | 119/3918 | 230/18723 | 3.21e-25 | 4.02e-22 | 119 |
| GO:0006119 | Colorectum | AD | oxidative phosphorylation | 83/3918 | 141/18723 | 7.95e-23 | 8.30e-20 | 83 |
| GO:0015980 | Colorectum | AD | energy derivation by oxidation of organic compounds | 143/3918 | 318/18723 | 2.78e-22 | 2.49e-19 | 143 |
| GO:0022900 | Colorectum | AD | electron transport chain | 89/3918 | 175/18723 | 1.42e-18 | 8.91e-16 | 89 |
| Page: 1 2 3 4 5 6 7 8 9 10 11 12 13 14 15 16 |
| Pathway ID | Tissue | Disease Stage | Description | Gene Ratio | Bg Ratio | pvalue | p.adjust | qvalue | Count |
| hsa0541512 | Stomach | GC | Diabetic cardiomyopathy | 56/708 | 203/8465 | 2.48e-16 | 1.14e-14 | 8.00e-15 | 56 |
| hsa0501612 | Stomach | GC | Huntington disease | 69/708 | 306/8465 | 6.71e-15 | 2.68e-13 | 1.89e-13 | 69 |
| hsa0501412 | Stomach | GC | Amyotrophic lateral sclerosis | 75/708 | 364/8465 | 6.67e-14 | 2.37e-12 | 1.67e-12 | 75 |
| hsa0471412 | Stomach | GC | Thermogenesis | 56/708 | 232/8465 | 1.35e-13 | 4.32e-12 | 3.04e-12 | 56 |
| hsa0501012 | Stomach | GC | Alzheimer disease | 73/708 | 384/8465 | 9.57e-12 | 2.55e-10 | 1.80e-10 | 73 |
| hsa0493212 | Stomach | GC | Non-alcoholic fatty liver disease | 41/708 | 155/8465 | 1.26e-11 | 3.11e-10 | 2.19e-10 | 41 |
| hsa0502212 | Stomach | GC | Pathways of neurodegeneration - multiple diseases | 82/708 | 476/8465 | 9.16e-11 | 2.09e-09 | 1.47e-09 | 82 |
| hsa0426012 | Stomach | GC | Cardiac muscle contraction | 17/708 | 87/8465 | 7.45e-04 | 5.82e-03 | 4.09e-03 | 17 |
| hsa0501213 | Stomach | GC | Parkinson disease | 73/708 | 266/8465 | 7.15e-21 | 7.63e-19 | 5.37e-19 | 73 |
| hsa0520813 | Stomach | GC | Chemical carcinogenesis - reactive oxygen species | 65/708 | 223/8465 | 3.46e-20 | 2.72e-18 | 1.91e-18 | 65 |
| hsa0019013 | Stomach | GC | Oxidative phosphorylation | 49/708 | 134/8465 | 4.24e-20 | 2.72e-18 | 1.91e-18 | 49 |
| hsa0502013 | Stomach | GC | Prion disease | 68/708 | 273/8465 | 4.69e-17 | 2.50e-15 | 1.76e-15 | 68 |
| hsa0541513 | Stomach | GC | Diabetic cardiomyopathy | 56/708 | 203/8465 | 2.48e-16 | 1.14e-14 | 8.00e-15 | 56 |
| hsa0501613 | Stomach | GC | Huntington disease | 69/708 | 306/8465 | 6.71e-15 | 2.68e-13 | 1.89e-13 | 69 |
| hsa0501413 | Stomach | GC | Amyotrophic lateral sclerosis | 75/708 | 364/8465 | 6.67e-14 | 2.37e-12 | 1.67e-12 | 75 |
| hsa0471413 | Stomach | GC | Thermogenesis | 56/708 | 232/8465 | 1.35e-13 | 4.32e-12 | 3.04e-12 | 56 |
| hsa0501013 | Stomach | GC | Alzheimer disease | 73/708 | 384/8465 | 9.57e-12 | 2.55e-10 | 1.80e-10 | 73 |
| hsa0493213 | Stomach | GC | Non-alcoholic fatty liver disease | 41/708 | 155/8465 | 1.26e-11 | 3.11e-10 | 2.19e-10 | 41 |
| hsa0502213 | Stomach | GC | Pathways of neurodegeneration - multiple diseases | 82/708 | 476/8465 | 9.16e-11 | 2.09e-09 | 1.47e-09 | 82 |
| hsa0426013 | Stomach | GC | Cardiac muscle contraction | 17/708 | 87/8465 | 7.45e-04 | 5.82e-03 | 4.09e-03 | 17 |
| Page: 1 2 3 4 5 6 7 8 9 10 11 12 13 14 15 16 17 18 19 20 21 22 23 24 25 |
Top |
Cell-cell communication analysis |
| Identification of potential cell-cell interactions between two cell types and their ligand-receptor pairs for different disease states |
| Ligand | Receptor | LRpair | Pathway | Tissue | Disease Stage |
| Page: 1 |
Top |
Single-cell gene regulatory network inference analysis |
| Find out the significant the regulons (TFs) and the target genes of each regulon across cell types for different disease states |
| TF | Cell Type | Tissue | Disease Stage | Target Gene | RSS | Regulon Activity |
| ∗The dot plots of a searched regulon are shown for all cell subpopulations in each disease state of each tissue based on the regulon specific score inferred using pySCENIC and by calculating the average expression. |
| Page: 1 |
Top |
Somatic mutation of malignant transformation related genes |
| Annotation of somatic variants for genes involved in malignant transformation |
| Hugo Symbol | Variant Class | Variant Classification | dbSNP RS | HGVSc | HGVSp | HGVSp Short | SWISSPROT | BIOTYPE | SIFT | PolyPhen | Tumor Sample Barcode | Tissue | Histology | Sex | Age | Stage | Therapy Types | Drugs | Outcome |
| COX5A | SNV | Missense_Mutation | rs780396486 | c.163N>T | p.Arg55Cys | p.R55C | P20674 | protein_coding | deleterious(0.01) | probably_damaging(0.967) | TCGA-C8-A137-01 | Breast | breast invasive carcinoma | Female | <65 | I/II | Unknown | Unknown | PD |
| COX5A | SNV | Missense_Mutation | c.241N>A | p.Asp81Asn | p.D81N | P20674 | protein_coding | deleterious(0) | probably_damaging(1) | TCGA-EA-A3HT-01 | Cervix | cervical & endocervical cancer | Female | >=65 | I/II | Unknown | Unknown | SD | |
| COX5A | SNV | Missense_Mutation | rs746397506 | c.280C>T | p.Arg94Trp | p.R94W | P20674 | protein_coding | deleterious(0.04) | benign(0.044) | TCGA-A6-2686-01 | Colorectum | colon adenocarcinoma | Female | >=65 | I/II | Unknown | Unknown | SD |
| COX5A | SNV | Missense_Mutation | rs774638701 | c.116N>A | p.Arg39His | p.R39H | P20674 | protein_coding | deleterious(0.04) | benign(0.118) | TCGA-AM-5821-01 | Colorectum | colon adenocarcinoma | Female | >=65 | I/II | Unknown | Unknown | SD |
| COX5A | SNV | Missense_Mutation | c.156N>G | p.Phe52Leu | p.F52L | P20674 | protein_coding | tolerated(0.07) | probably_damaging(0.964) | TCGA-CM-5349-01 | Colorectum | colon adenocarcinoma | Female | >=65 | I/II | Unknown | Unknown | SD | |
| COX5A | SNV | Missense_Mutation | rs774638701 | c.116G>A | p.Arg39His | p.R39H | P20674 | protein_coding | deleterious(0.04) | benign(0.118) | TCGA-AX-A2HC-01 | Endometrium | uterine corpus endometrioid carcinoma | Female | <65 | III/IV | Chemotherapy | paclitaxel | PD |
| COX5A | SNV | Missense_Mutation | novel | c.331N>A | p.Val111Ile | p.V111I | P20674 | protein_coding | deleterious(0) | benign(0.055) | TCGA-B5-A3FA-01 | Endometrium | uterine corpus endometrioid carcinoma | Female | >=65 | I/II | Unknown | Unknown | SD |
| COX5A | SNV | Missense_Mutation | rs200811470 | c.115N>T | p.Arg39Cys | p.R39C | P20674 | protein_coding | deleterious(0) | probably_damaging(0.972) | TCGA-D1-A16Y-01 | Endometrium | uterine corpus endometrioid carcinoma | Female | <65 | I/II | Unknown | Unknown | SD |
| COX5A | SNV | Missense_Mutation | novel | c.319C>A | p.Arg107Ser | p.R107S | P20674 | protein_coding | deleterious(0.02) | probably_damaging(0.987) | TCGA-EO-A22R-01 | Endometrium | uterine corpus endometrioid carcinoma | Female | <65 | I/II | Unknown | Unknown | SD |
| COX5A | SNV | Missense_Mutation | c.120N>G | p.Cys40Trp | p.C40W | P20674 | protein_coding | tolerated(0.09) | possibly_damaging(0.76) | TCGA-DD-A73D-01 | Liver | liver hepatocellular carcinoma | Female | >=65 | I/II | Unknown | Unknown | PD |
| Page: 1 2 |
Top |
Related drugs of malignant transformation related genes |
| Identification of chemicals and drugs interact with genes involved in malignant transfromation |
| (DGIdb 4.0) |
| Entrez ID | Symbol | Category | Interaction Types | Drug Claim Name | Drug Name | PMIDs |
| Page: 1 |

Copyright 2023-Present -The University of Texas Health Science Center at Houston |