
|
|||||
|
 | |
| |
| |
| |
| |
| |
|
Gene: WNT10A |
Gene summary for WNT10A |
| Gene information | Species | Human | Gene symbol | WNT10A | Gene ID | 80326 |
| Gene name | Wnt family member 10A | |
| Gene Alias | OODD | |
| Cytomap | 2q35 | |
| Gene Type | protein-coding | GO ID | GO:0001942 | UniProtAcc | Q9GZT5 |
Top |
Malignant transformation analysis |
| Identification of the aberrant gene expression in precancerous and cancerous lesions by comparing the gene expression of stem-like cells in diseased tissues with normal stem cells |
| Entrez ID | Symbol | Replicates | Species | Organ | Tissue | Adj P-value | Log2FC | Malignancy |
| 80326 | WNT10A | LZE24T | Human | Esophagus | ESCC | 5.76e-03 | 2.38e-01 | 0.0596 |
| 80326 | WNT10A | P2T-E | Human | Esophagus | ESCC | 5.13e-45 | 1.27e+00 | 0.1177 |
| 80326 | WNT10A | P4T-E | Human | Esophagus | ESCC | 6.51e-07 | 1.29e-01 | 0.1323 |
| 80326 | WNT10A | P8T-E | Human | Esophagus | ESCC | 3.51e-05 | 8.60e-02 | 0.0889 |
| 80326 | WNT10A | P11T-E | Human | Esophagus | ESCC | 1.64e-07 | 6.93e-01 | 0.1426 |
| 80326 | WNT10A | P12T-E | Human | Esophagus | ESCC | 8.72e-13 | 4.51e-01 | 0.1122 |
| 80326 | WNT10A | P16T-E | Human | Esophagus | ESCC | 2.76e-08 | 1.39e-01 | 0.1153 |
| 80326 | WNT10A | P17T-E | Human | Esophagus | ESCC | 5.75e-04 | 2.31e-01 | 0.1278 |
| 80326 | WNT10A | P20T-E | Human | Esophagus | ESCC | 8.38e-27 | 7.40e-01 | 0.1124 |
| 80326 | WNT10A | P21T-E | Human | Esophagus | ESCC | 2.02e-40 | 9.32e-01 | 0.1617 |
| 80326 | WNT10A | P22T-E | Human | Esophagus | ESCC | 1.34e-02 | 6.14e-02 | 0.1236 |
| 80326 | WNT10A | P26T-E | Human | Esophagus | ESCC | 5.96e-10 | 3.09e-01 | 0.1276 |
| 80326 | WNT10A | P27T-E | Human | Esophagus | ESCC | 1.14e-11 | 3.65e-01 | 0.1055 |
| 80326 | WNT10A | P28T-E | Human | Esophagus | ESCC | 1.89e-02 | 3.01e-01 | 0.1149 |
| 80326 | WNT10A | P30T-E | Human | Esophagus | ESCC | 2.59e-07 | 5.47e-01 | 0.137 |
| 80326 | WNT10A | P31T-E | Human | Esophagus | ESCC | 3.53e-37 | 7.26e-01 | 0.1251 |
| 80326 | WNT10A | P36T-E | Human | Esophagus | ESCC | 3.38e-04 | 4.03e-01 | 0.1187 |
| 80326 | WNT10A | P37T-E | Human | Esophagus | ESCC | 2.09e-24 | 5.77e-01 | 0.1371 |
| 80326 | WNT10A | P44T-E | Human | Esophagus | ESCC | 1.83e-02 | 1.02e-01 | 0.1096 |
| 80326 | WNT10A | P49T-E | Human | Esophagus | ESCC | 4.53e-04 | 6.19e-01 | 0.1768 |
| Page: 1 2 3 |
| Tissue | Expression Dynamics | Abbreviation |
| Esophagus | 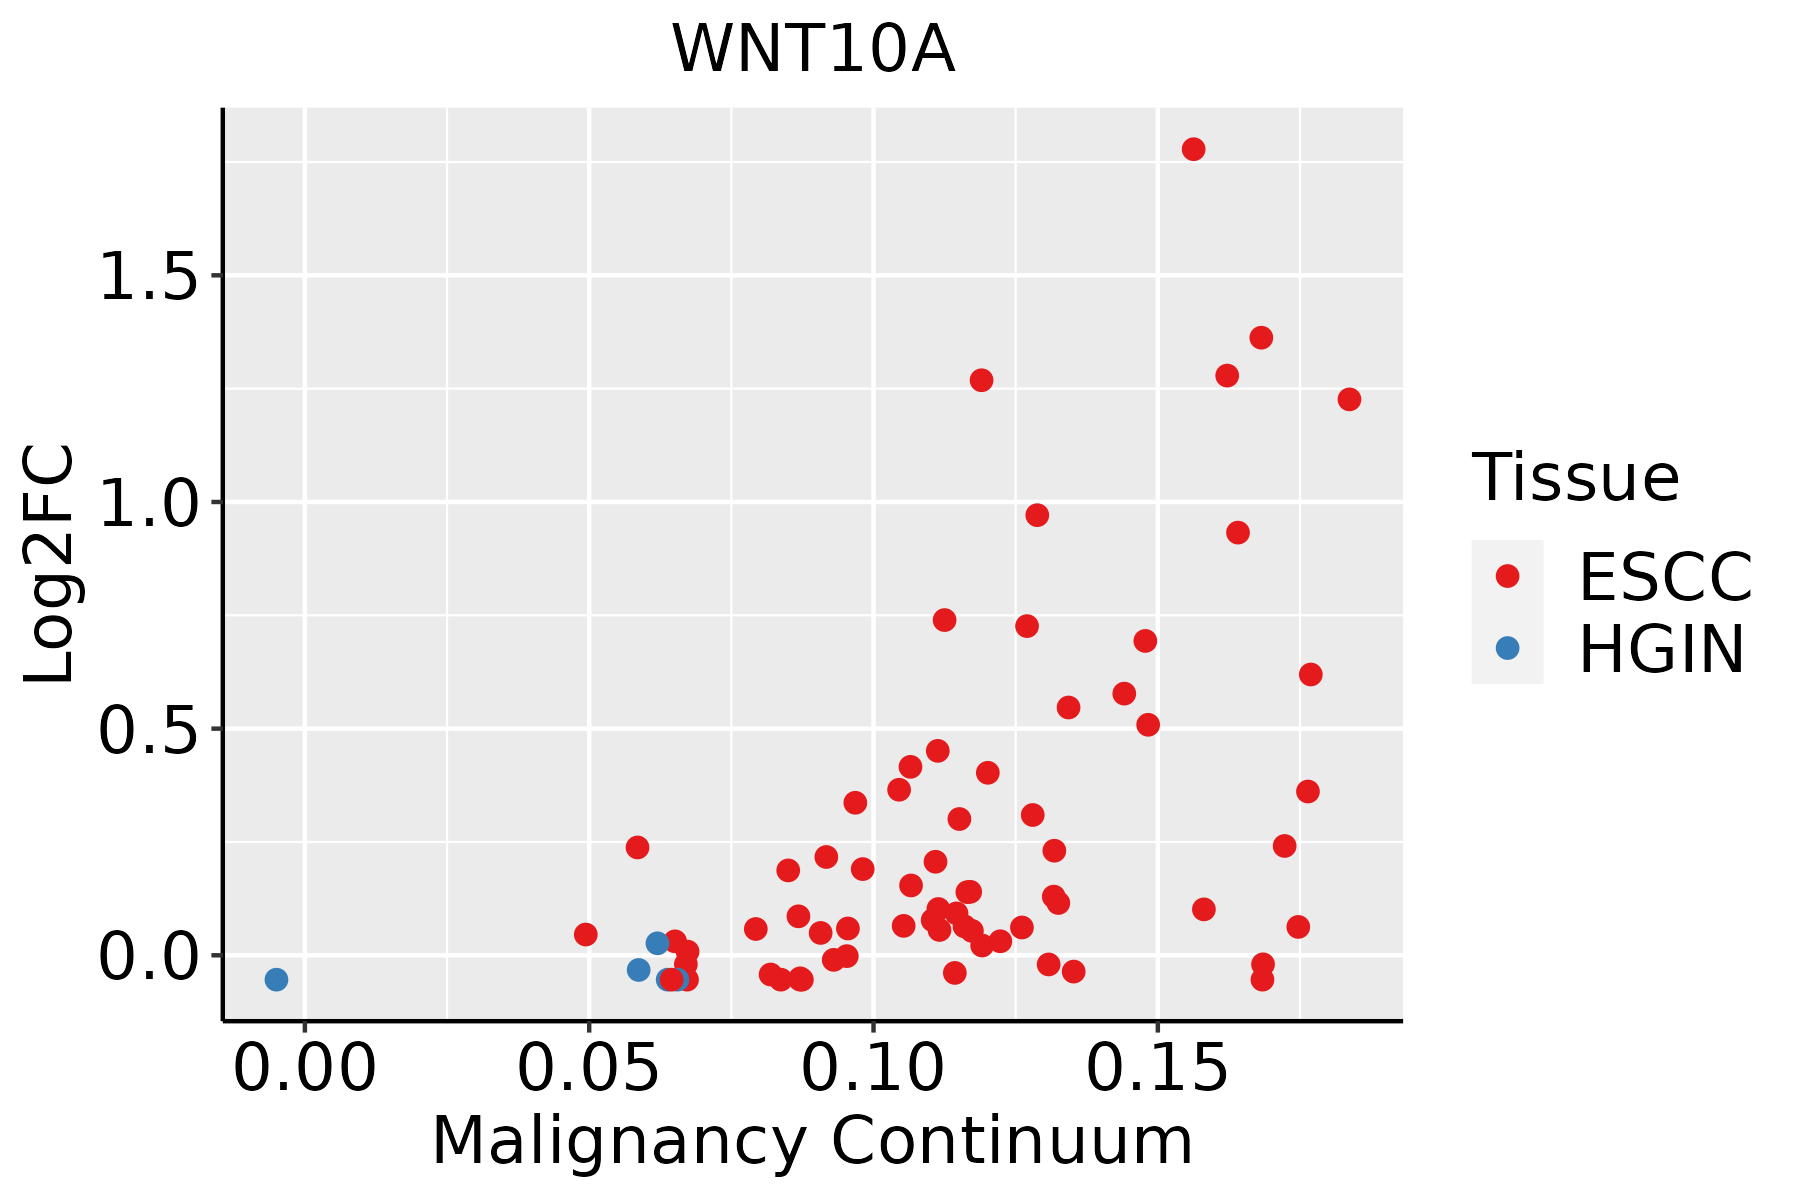 | ESCC: Esophageal squamous cell carcinoma |
| HGIN: High-grade intraepithelial neoplasias | ||
| LGIN: Low-grade intraepithelial neoplasias | ||
| Oral Cavity | 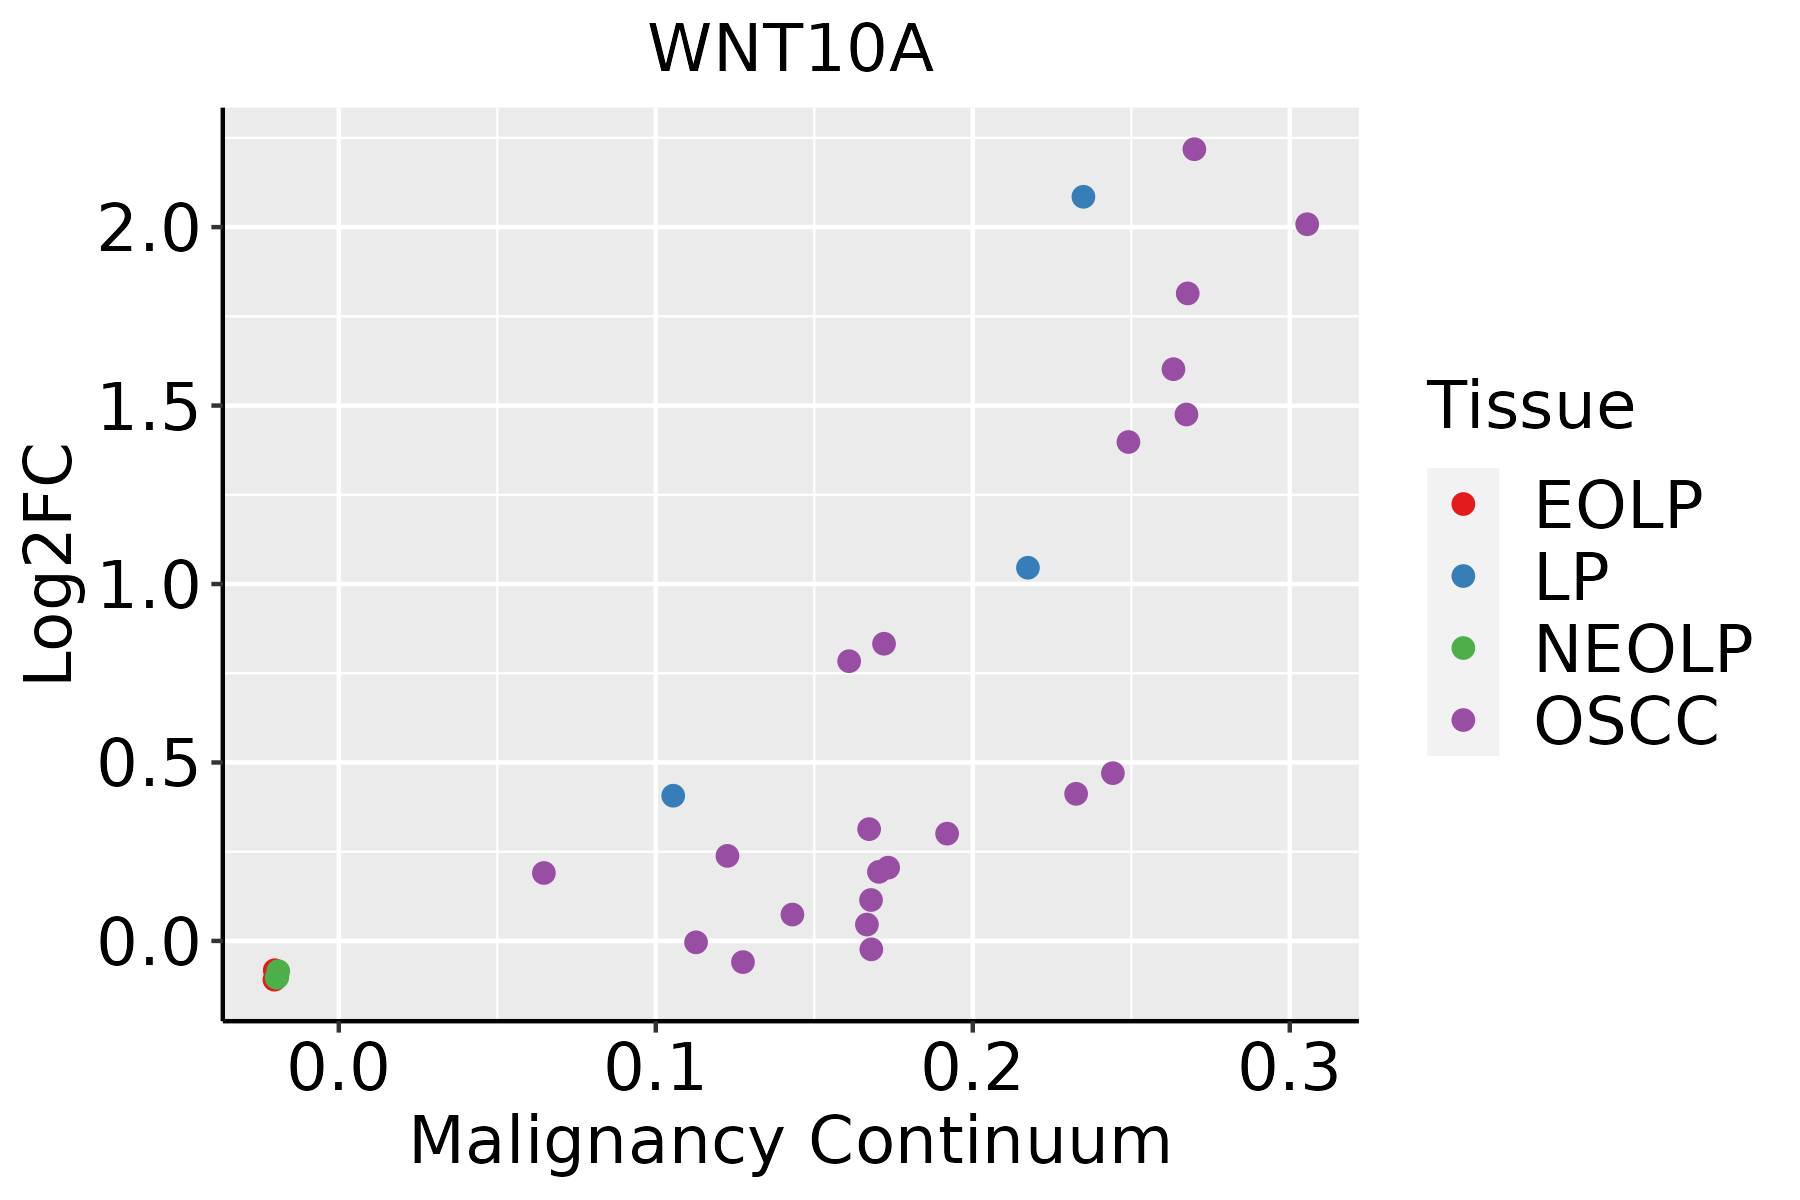 | EOLP: Erosive Oral lichen planus |
| LP: leukoplakia | ||
| NEOLP: Non-erosive oral lichen planus | ||
| OSCC: Oral squamous cell carcinoma | ||
| Skin |  | AK: Actinic keratosis |
| cSCC: Cutaneous squamous cell carcinoma | ||
| SCCIS:squamous cell carcinoma in situ |
| ∗log2FC in expression of this searched gene in stem-like cells from each diseased tissue sample relative to stem-like cells in normal samples in each tissue plotted against the malignancy continuum. Samples are colored based on if they are from different disease stage. |
Top |
Malignant transformation related pathway analysis |
| Find out the enriched GO biological processes and KEGG pathways involved in transition from healthy to precancer to cancer |
| Tissue | Disease Stage | Enriched GO biological Processes |
| Colorectum | AD |  |
| Colorectum | SER |  |
| Colorectum | MSS |  |
| Colorectum | MSI-H |  |
| Colorectum | FAP |  |
| ∗Top 15 enriched GO BP terms are showed in the bar plot of each disease state in each tissue. Each row represents a significant GO biological process which is colored according to the -log10(p.adjust). |
| Page: 1 2 3 4 5 6 7 8 9 |
| GO ID | Tissue | Disease Stage | Description | Gene Ratio | Bg Ratio | pvalue | p.adjust | Count |
| GO:0048732111 | Esophagus | ESCC | gland development | 269/8552 | 436/18723 | 7.81e-12 | 2.95e-10 | 269 |
| GO:001605517 | Esophagus | ESCC | Wnt signaling pathway | 268/8552 | 444/18723 | 2.32e-10 | 6.58e-09 | 268 |
| GO:019873817 | Esophagus | ESCC | cell-cell signaling by wnt | 269/8552 | 446/18723 | 2.41e-10 | 6.79e-09 | 269 |
| GO:00435888 | Esophagus | ESCC | skin development | 163/8552 | 263/18723 | 6.48e-08 | 1.14e-06 | 163 |
| GO:000854410 | Esophagus | ESCC | epidermis development | 193/8552 | 324/18723 | 2.87e-07 | 4.19e-06 | 193 |
| GO:00715599 | Esophagus | ESCC | response to transforming growth factor beta | 157/8552 | 256/18723 | 2.95e-07 | 4.23e-06 | 157 |
| GO:006007016 | Esophagus | ESCC | canonical Wnt signaling pathway | 180/8552 | 303/18723 | 9.15e-07 | 1.17e-05 | 180 |
| GO:00715609 | Esophagus | ESCC | cellular response to transforming growth factor beta stimulus | 151/8552 | 250/18723 | 1.78e-06 | 2.10e-05 | 151 |
| GO:00488638 | Esophagus | ESCC | stem cell differentiation | 122/8552 | 206/18723 | 5.95e-05 | 4.59e-04 | 122 |
| GO:00487628 | Esophagus | ESCC | mesenchymal cell differentiation | 133/8552 | 236/18723 | 5.94e-04 | 3.22e-03 | 133 |
| GO:00224043 | Esophagus | ESCC | molting cycle process | 53/8552 | 84/18723 | 9.62e-04 | 4.88e-03 | 53 |
| GO:00224053 | Esophagus | ESCC | hair cycle process | 53/8552 | 84/18723 | 9.62e-04 | 4.88e-03 | 53 |
| GO:0001942 | Esophagus | ESCC | hair follicle development | 51/8552 | 81/18723 | 1.27e-03 | 6.14e-03 | 51 |
| GO:0098773 | Esophagus | ESCC | skin epidermis development | 53/8552 | 85/18723 | 1.43e-03 | 6.77e-03 | 53 |
| GO:00423033 | Esophagus | ESCC | molting cycle | 64/8552 | 107/18723 | 2.24e-03 | 9.85e-03 | 64 |
| GO:00426333 | Esophagus | ESCC | hair cycle | 64/8552 | 107/18723 | 2.24e-03 | 9.85e-03 | 64 |
| GO:00604856 | Esophagus | ESCC | mesenchyme development | 156/8552 | 291/18723 | 3.76e-03 | 1.53e-02 | 156 |
| GO:20000274 | Esophagus | ESCC | regulation of animal organ morphogenesis | 71/8552 | 125/18723 | 7.97e-03 | 2.84e-02 | 71 |
| GO:004873220 | Oral cavity | OSCC | gland development | 226/7305 | 436/18723 | 2.78e-08 | 5.39e-07 | 226 |
| GO:001605510 | Oral cavity | OSCC | Wnt signaling pathway | 227/7305 | 444/18723 | 1.10e-07 | 1.87e-06 | 227 |
| Page: 1 2 3 4 |
| Pathway ID | Tissue | Disease Stage | Description | Gene Ratio | Bg Ratio | pvalue | p.adjust | qvalue | Count |
| hsa0439016 | Oral cavity | OSCC | Hippo signaling pathway | 86/3704 | 157/8465 | 3.30e-03 | 8.24e-03 | 4.20e-03 | 86 |
| hsa05010112 | Oral cavity | OSCC | Alzheimer disease | 244/3704 | 384/8465 | 1.18e-15 | 3.60e-14 | 1.83e-14 | 244 |
| hsa05022112 | Oral cavity | OSCC | Pathways of neurodegeneration - multiple diseases | 292/3704 | 476/8465 | 1.60e-15 | 4.47e-14 | 2.28e-14 | 292 |
| hsa0516514 | Oral cavity | OSCC | Human papillomavirus infection | 200/3704 | 331/8465 | 3.83e-10 | 4.93e-09 | 2.51e-09 | 200 |
| hsa05205111 | Oral cavity | OSCC | Proteoglycans in cancer | 128/3704 | 205/8465 | 4.00e-08 | 3.12e-07 | 1.59e-07 | 128 |
| hsa0522517 | Oral cavity | OSCC | Hepatocellular carcinoma | 97/3704 | 168/8465 | 1.63e-04 | 5.52e-04 | 2.81e-04 | 97 |
| hsa0415012 | Oral cavity | OSCC | mTOR signaling pathway | 90/3704 | 156/8465 | 2.87e-04 | 9.15e-04 | 4.66e-04 | 90 |
| hsa0439017 | Oral cavity | OSCC | Hippo signaling pathway | 86/3704 | 157/8465 | 3.30e-03 | 8.24e-03 | 4.20e-03 | 86 |
| hsa0501029 | Oral cavity | LP | Alzheimer disease | 197/2418 | 384/8465 | 6.66e-22 | 3.69e-20 | 2.38e-20 | 197 |
| hsa0502229 | Oral cavity | LP | Pathways of neurodegeneration - multiple diseases | 232/2418 | 476/8465 | 7.77e-22 | 3.69e-20 | 2.38e-20 | 232 |
| hsa0516523 | Oral cavity | LP | Human papillomavirus infection | 121/2418 | 331/8465 | 8.00e-04 | 3.86e-03 | 2.49e-03 | 121 |
| hsa0520527 | Oral cavity | LP | Proteoglycans in cancer | 77/2418 | 205/8465 | 3.01e-03 | 1.29e-02 | 8.35e-03 | 77 |
| hsa0501037 | Oral cavity | LP | Alzheimer disease | 197/2418 | 384/8465 | 6.66e-22 | 3.69e-20 | 2.38e-20 | 197 |
| hsa0502237 | Oral cavity | LP | Pathways of neurodegeneration - multiple diseases | 232/2418 | 476/8465 | 7.77e-22 | 3.69e-20 | 2.38e-20 | 232 |
| hsa0516533 | Oral cavity | LP | Human papillomavirus infection | 121/2418 | 331/8465 | 8.00e-04 | 3.86e-03 | 2.49e-03 | 121 |
| hsa0520536 | Oral cavity | LP | Proteoglycans in cancer | 77/2418 | 205/8465 | 3.01e-03 | 1.29e-02 | 8.35e-03 | 77 |
| Page: 1 2 |
Top |
Cell-cell communication analysis |
| Identification of potential cell-cell interactions between two cell types and their ligand-receptor pairs for different disease states |
| Ligand | Receptor | LRpair | Pathway | Tissue | Disease Stage |
| WNT10A | FZD10_LRP6 | WNT10A_FZD10_LRP6 | WNT | Esophagus | ESCC |
| WNT10A | FZD3_LRP6 | WNT10A_FZD3_LRP6 | WNT | Esophagus | ESCC |
| WNT10A | FZD4_LRP6 | WNT10A_FZD4_LRP6 | WNT | Esophagus | ESCC |
| WNT10A | FZD5_LRP6 | WNT10A_FZD5_LRP6 | WNT | Esophagus | ESCC |
| WNT10A | FZD6_LRP6 | WNT10A_FZD6_LRP6 | WNT | Esophagus | ESCC |
| WNT10A | FZD8_LRP6 | WNT10A_FZD8_LRP6 | WNT | Esophagus | ESCC |
| WNT10A | FZD4_LRP5 | WNT10A_FZD4_LRP5 | WNT | HNSCC | OSCC |
| WNT10A | FZD6_LRP5 | WNT10A_FZD6_LRP5 | WNT | HNSCC | OSCC |
| WNT10A | FZD6_LRP6 | WNT10A_FZD6_LRP6 | WNT | HNSCC | OSCC |
| WNT10A | FZD6_LRP5 | WNT10A_FZD6_LRP5 | WNT | HNSCC | Precancer |
| WNT10A | FZD6_LRP6 | WNT10A_FZD6_LRP6 | WNT | HNSCC | Precancer |
| Page: 1 |
Top |
Single-cell gene regulatory network inference analysis |
| Find out the significant the regulons (TFs) and the target genes of each regulon across cell types for different disease states |
| TF | Cell Type | Tissue | Disease Stage | Target Gene | RSS | Regulon Activity |
| ∗The dot plots of a searched regulon are shown for all cell subpopulations in each disease state of each tissue based on the regulon specific score inferred using pySCENIC and by calculating the average expression. |
| Page: 1 |
Top |
Somatic mutation of malignant transformation related genes |
| Annotation of somatic variants for genes involved in malignant transformation |
| Hugo Symbol | Variant Class | Variant Classification | dbSNP RS | HGVSc | HGVSp | HGVSp Short | SWISSPROT | BIOTYPE | SIFT | PolyPhen | Tumor Sample Barcode | Tissue | Histology | Sex | Age | Stage | Therapy Types | Drugs | Outcome |
| WNT10A | SNV | Missense_Mutation | novel | c.604A>G | p.Ser202Gly | p.S202G | Q9GZT5 | protein_coding | tolerated(0.4) | benign(0.006) | TCGA-2W-A8YY-01 | Cervix | cervical & endocervical cancer | Female | <65 | I/II | Chemotherapy | cisplatin | CR |
| WNT10A | SNV | Missense_Mutation | rs779978162 | c.421G>A | p.Val141Met | p.V141M | Q9GZT5 | protein_coding | deleterious(0.01) | probably_damaging(0.982) | TCGA-DS-A0VL-01 | Cervix | cervical & endocervical cancer | Female | <65 | I/II | Unknown | Unknown | SD |
| WNT10A | SNV | Missense_Mutation | c.775N>T | p.Arg259Trp | p.R259W | Q9GZT5 | protein_coding | deleterious(0) | benign(0.096) | TCGA-AZ-6599-01 | Colorectum | colon adenocarcinoma | Male | >=65 | I/II | Unknown | Unknown | SD | |
| WNT10A | SNV | Missense_Mutation | c.73N>T | p.Leu25Phe | p.L25F | Q9GZT5 | protein_coding | deleterious(0.02) | possibly_damaging(0.587) | TCGA-CK-4951-01 | Colorectum | colon adenocarcinoma | Female | >=65 | I/II | Unknown | Unknown | PD | |
| WNT10A | SNV | Missense_Mutation | c.599C>T | p.Thr200Ile | p.T200I | Q9GZT5 | protein_coding | tolerated(0.18) | benign(0.085) | TCGA-D5-5538-01 | Colorectum | colon adenocarcinoma | Female | <65 | III/IV | Chemotherapy | calcium | PD | |
| WNT10A | SNV | Missense_Mutation | rs779978162 | c.421N>A | p.Val141Met | p.V141M | Q9GZT5 | protein_coding | deleterious(0.01) | probably_damaging(0.982) | TCGA-NH-A5IV-01 | Colorectum | colon adenocarcinoma | Female | >=65 | I/II | Unknown | Unknown | SD |
| WNT10A | SNV | Missense_Mutation | c.194C>G | p.Pro65Arg | p.P65R | Q9GZT5 | protein_coding | deleterious(0) | possibly_damaging(0.808) | TCGA-QG-A5YV-01 | Colorectum | colon adenocarcinoma | Female | <65 | III/IV | Chemotherapy | xeloda | CR | |
| WNT10A | insertion | Frame_Shift_Ins | novel | c.219_220insGT | p.Arg77CysfsTer79 | p.R77Cfs*79 | Q9GZT5 | protein_coding | TCGA-G4-6309-01 | Colorectum | colon adenocarcinoma | Female | <65 | III/IV | Chemotherapy | xeloda | PD | ||
| WNT10A | SNV | Missense_Mutation | novel | c.562N>A | p.Leu188Met | p.L188M | Q9GZT5 | protein_coding | tolerated(0.63) | benign(0.077) | TCGA-A5-A0G2-01 | Endometrium | uterine corpus endometrioid carcinoma | Female | <65 | III/IV | Unknown | Unknown | SD |
| WNT10A | SNV | Missense_Mutation | novel | c.497N>G | p.Asp166Gly | p.D166G | Q9GZT5 | protein_coding | tolerated(0.13) | benign(0.012) | TCGA-A5-A0GP-01 | Endometrium | uterine corpus endometrioid carcinoma | Female | <65 | I/II | Unknown | Unknown | SD |
| Page: 1 2 3 |
Top |
Related drugs of malignant transformation related genes |
| Identification of chemicals and drugs interact with genes involved in malignant transfromation |
| (DGIdb 4.0) |
| Entrez ID | Symbol | Category | Interaction Types | Drug Claim Name | Drug Name | PMIDs |
| Page: 1 |

Copyright 2023-Present -The University of Texas Health Science Center at Houston |