
|
|||||
|
 | |
| |
| |
| |
| |
| |
|
Gene: SH3GLB1 |
Gene summary for SH3GLB1 |
| Gene information | Species | Human | Gene symbol | SH3GLB1 | Gene ID | 51100 |
| Gene name | SH3 domain containing GRB2 like, endophilin B1 | |
| Gene Alias | Bif-1 | |
| Cytomap | 1p22.3 | |
| Gene Type | protein-coding | GO ID | GO:0000045 | UniProtAcc | A0A087WW40 |
Top |
Malignant transformation analysis |
| Identification of the aberrant gene expression in precancerous and cancerous lesions by comparing the gene expression of stem-like cells in diseased tissues with normal stem cells |
| Entrez ID | Symbol | Replicates | Species | Organ | Tissue | Adj P-value | Log2FC | Malignancy |
| 51100 | SH3GLB1 | LZE2T | Human | Esophagus | ESCC | 1.92e-02 | 3.43e-01 | 0.082 |
| 51100 | SH3GLB1 | LZE4T | Human | Esophagus | ESCC | 2.57e-07 | 3.28e-01 | 0.0811 |
| 51100 | SH3GLB1 | LZE8T | Human | Esophagus | ESCC | 1.46e-12 | 1.89e-01 | 0.067 |
| 51100 | SH3GLB1 | LZE20T | Human | Esophagus | ESCC | 1.53e-05 | 5.54e-01 | 0.0662 |
| 51100 | SH3GLB1 | LZE22D1 | Human | Esophagus | HGIN | 1.47e-05 | 1.79e-01 | 0.0595 |
| 51100 | SH3GLB1 | LZE22T | Human | Esophagus | ESCC | 5.16e-09 | 2.29e-01 | 0.068 |
| 51100 | SH3GLB1 | LZE24T | Human | Esophagus | ESCC | 9.95e-20 | 6.67e-01 | 0.0596 |
| 51100 | SH3GLB1 | LZE21T | Human | Esophagus | ESCC | 3.42e-07 | 3.46e-02 | 0.0655 |
| 51100 | SH3GLB1 | LZE6T | Human | Esophagus | ESCC | 4.01e-06 | 3.08e-02 | 0.0845 |
| 51100 | SH3GLB1 | P1T-E | Human | Esophagus | ESCC | 2.33e-09 | 9.50e-01 | 0.0875 |
| 51100 | SH3GLB1 | P2T-E | Human | Esophagus | ESCC | 1.80e-39 | 6.46e-01 | 0.1177 |
| 51100 | SH3GLB1 | P4T-E | Human | Esophagus | ESCC | 7.76e-25 | 7.39e-01 | 0.1323 |
| 51100 | SH3GLB1 | P5T-E | Human | Esophagus | ESCC | 2.14e-36 | 9.61e-01 | 0.1327 |
| 51100 | SH3GLB1 | P8T-E | Human | Esophagus | ESCC | 3.36e-29 | 7.17e-01 | 0.0889 |
| 51100 | SH3GLB1 | P9T-E | Human | Esophagus | ESCC | 1.07e-12 | 5.82e-01 | 0.1131 |
| 51100 | SH3GLB1 | P10T-E | Human | Esophagus | ESCC | 1.14e-29 | 6.32e-01 | 0.116 |
| 51100 | SH3GLB1 | P11T-E | Human | Esophagus | ESCC | 7.21e-17 | 1.16e+00 | 0.1426 |
| 51100 | SH3GLB1 | P12T-E | Human | Esophagus | ESCC | 2.27e-94 | 2.19e+00 | 0.1122 |
| 51100 | SH3GLB1 | P15T-E | Human | Esophagus | ESCC | 5.64e-32 | 8.25e-01 | 0.1149 |
| 51100 | SH3GLB1 | P16T-E | Human | Esophagus | ESCC | 2.09e-24 | 3.21e-01 | 0.1153 |
| Page: 1 2 3 4 5 6 7 |
| Tissue | Expression Dynamics | Abbreviation |
| Esophagus |  | ESCC: Esophageal squamous cell carcinoma |
| HGIN: High-grade intraepithelial neoplasias | ||
| LGIN: Low-grade intraepithelial neoplasias | ||
| Liver | 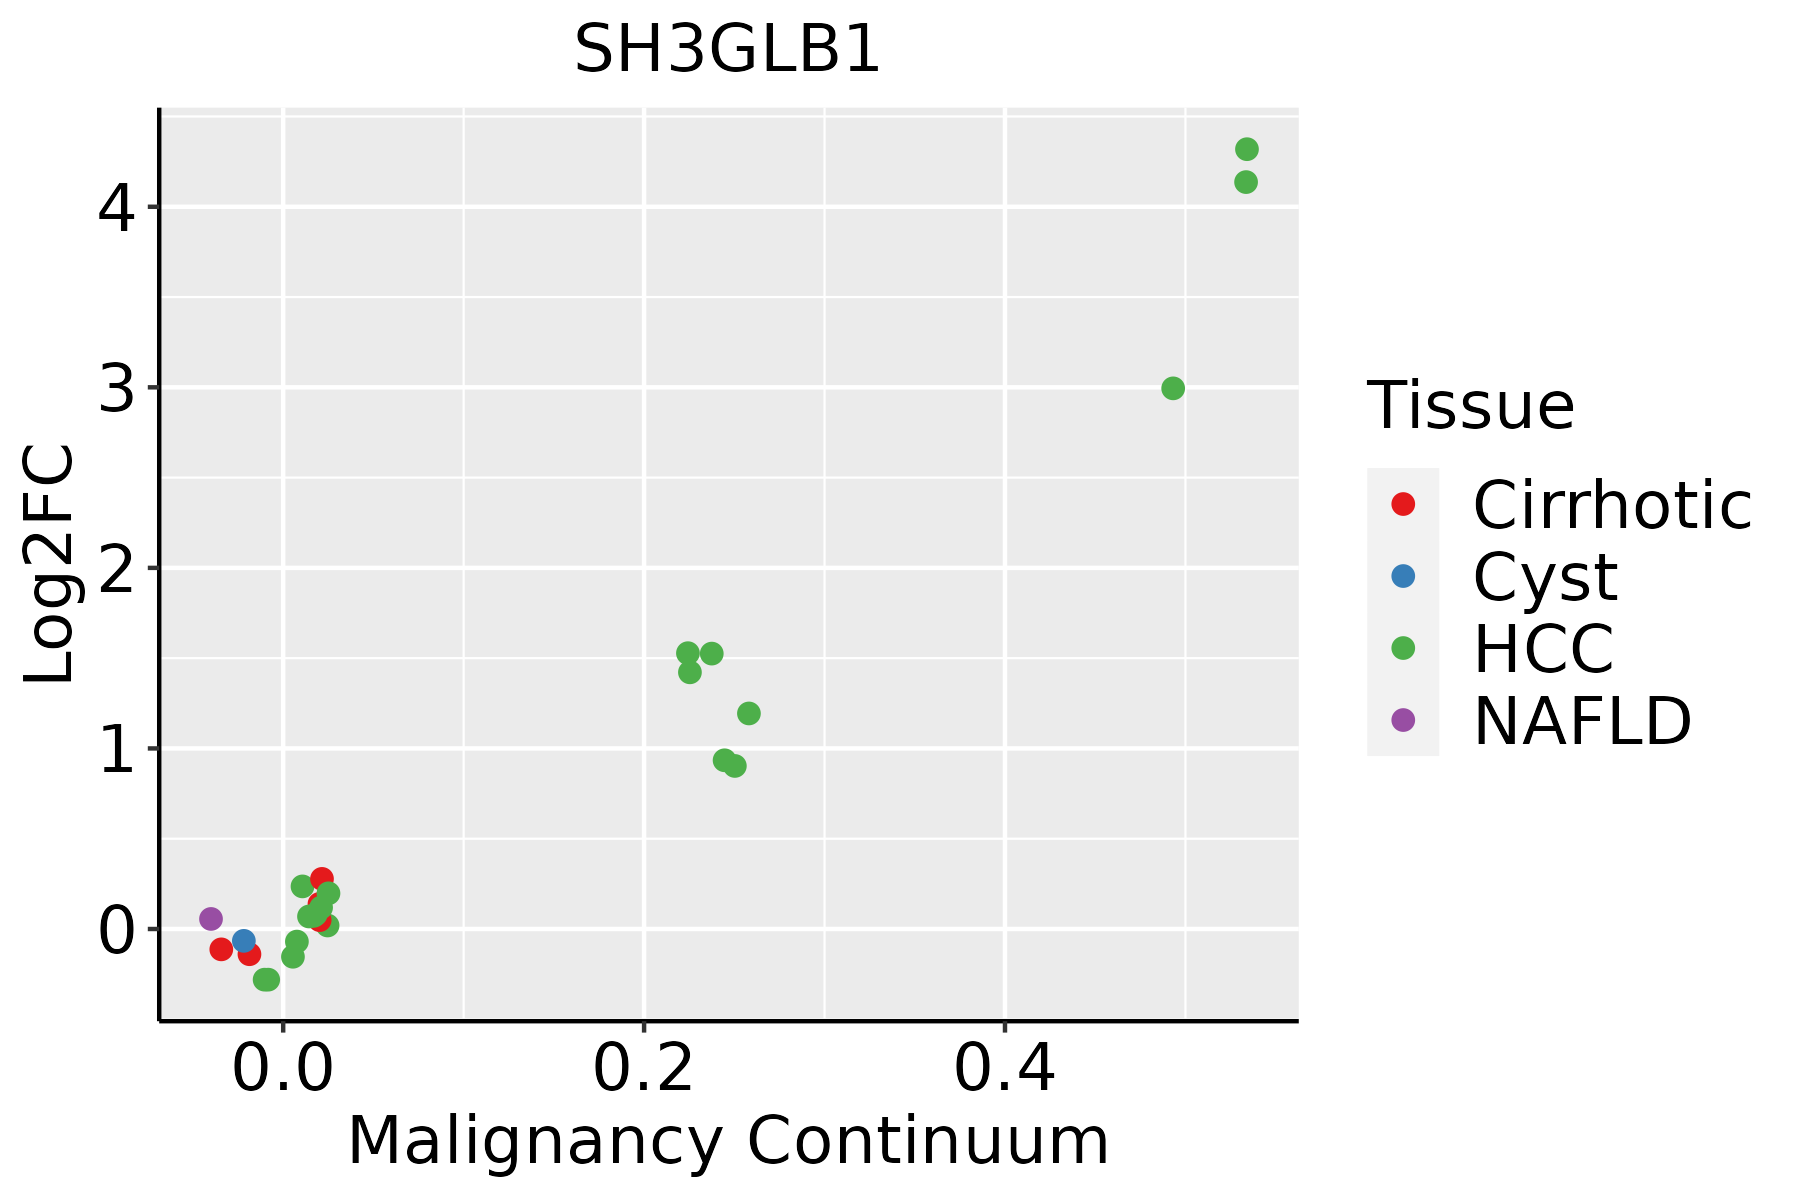 | HCC: Hepatocellular carcinoma |
| NAFLD: Non-alcoholic fatty liver disease | ||
| Oral Cavity | 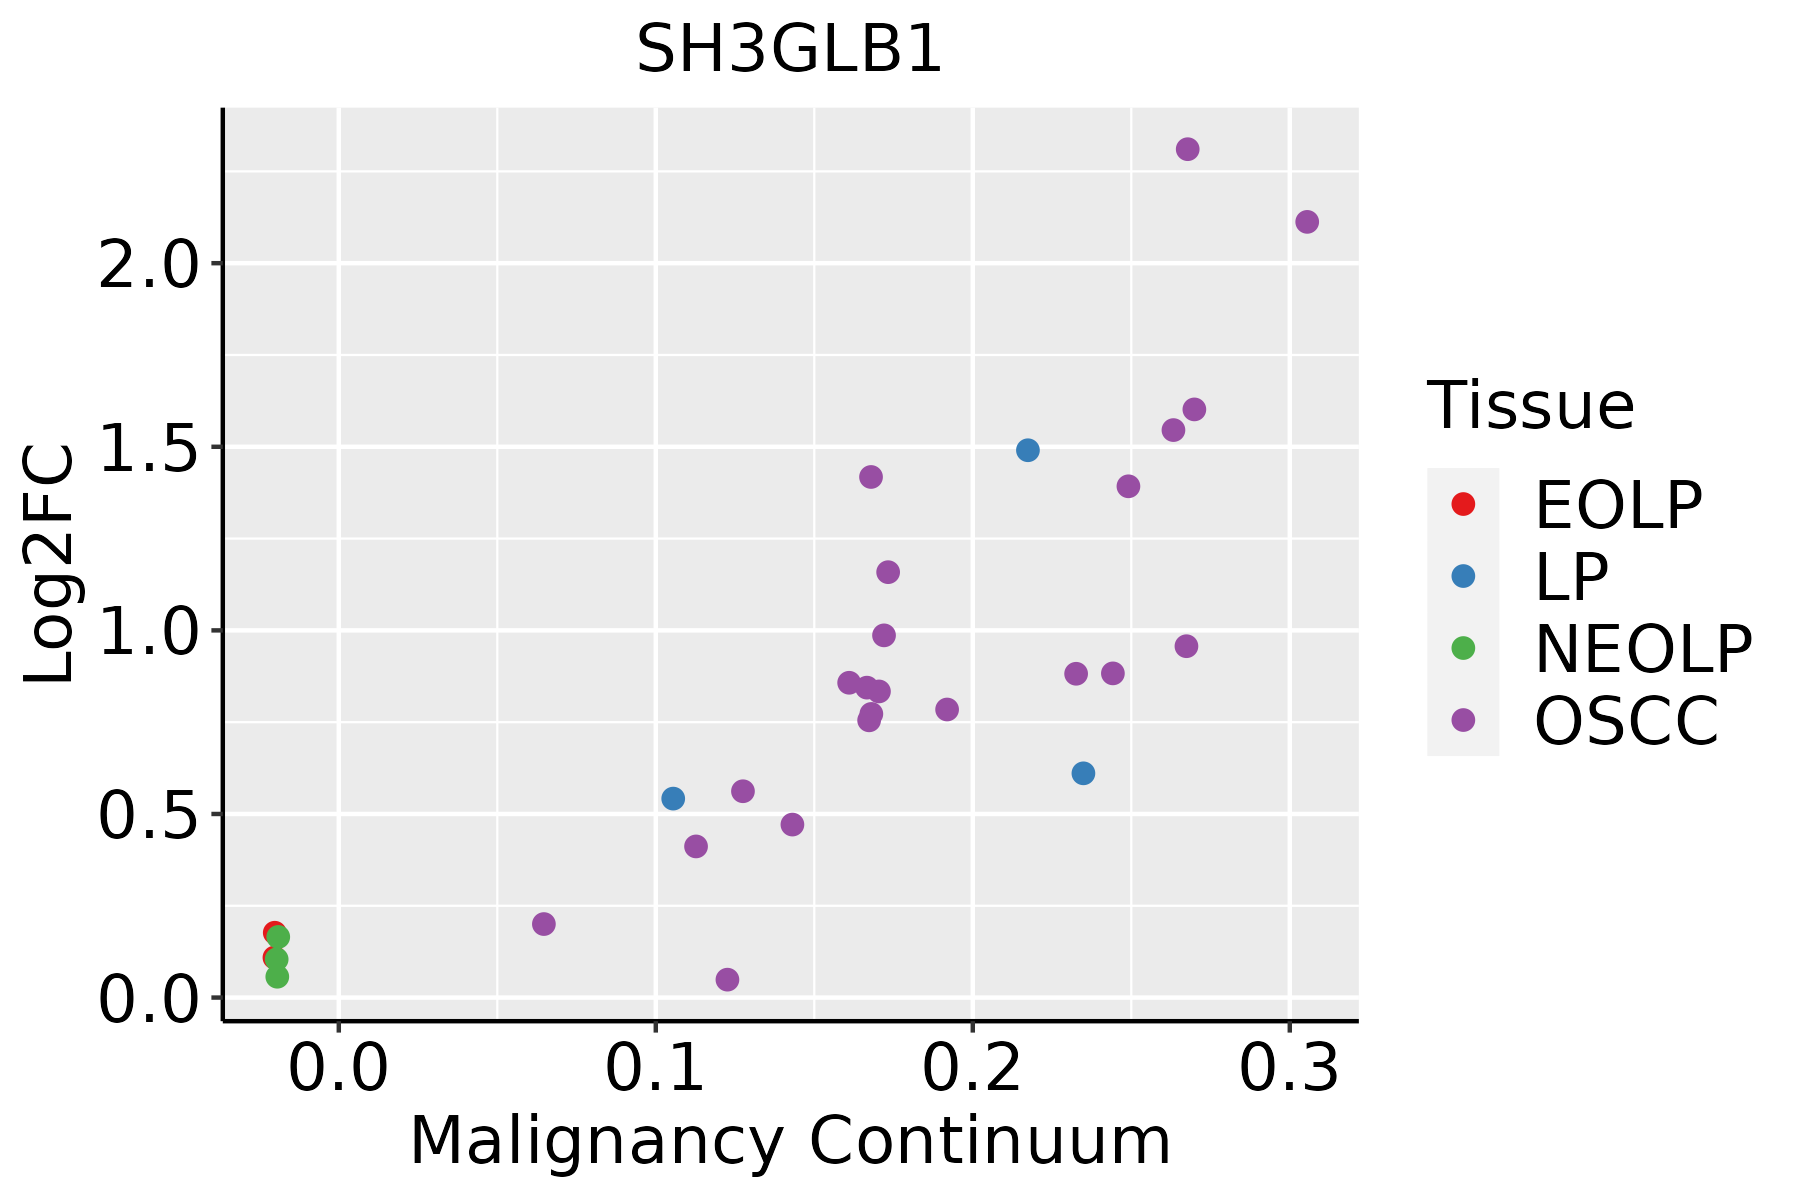 | EOLP: Erosive Oral lichen planus |
| LP: leukoplakia | ||
| NEOLP: Non-erosive oral lichen planus | ||
| OSCC: Oral squamous cell carcinoma | ||
| Prostate | 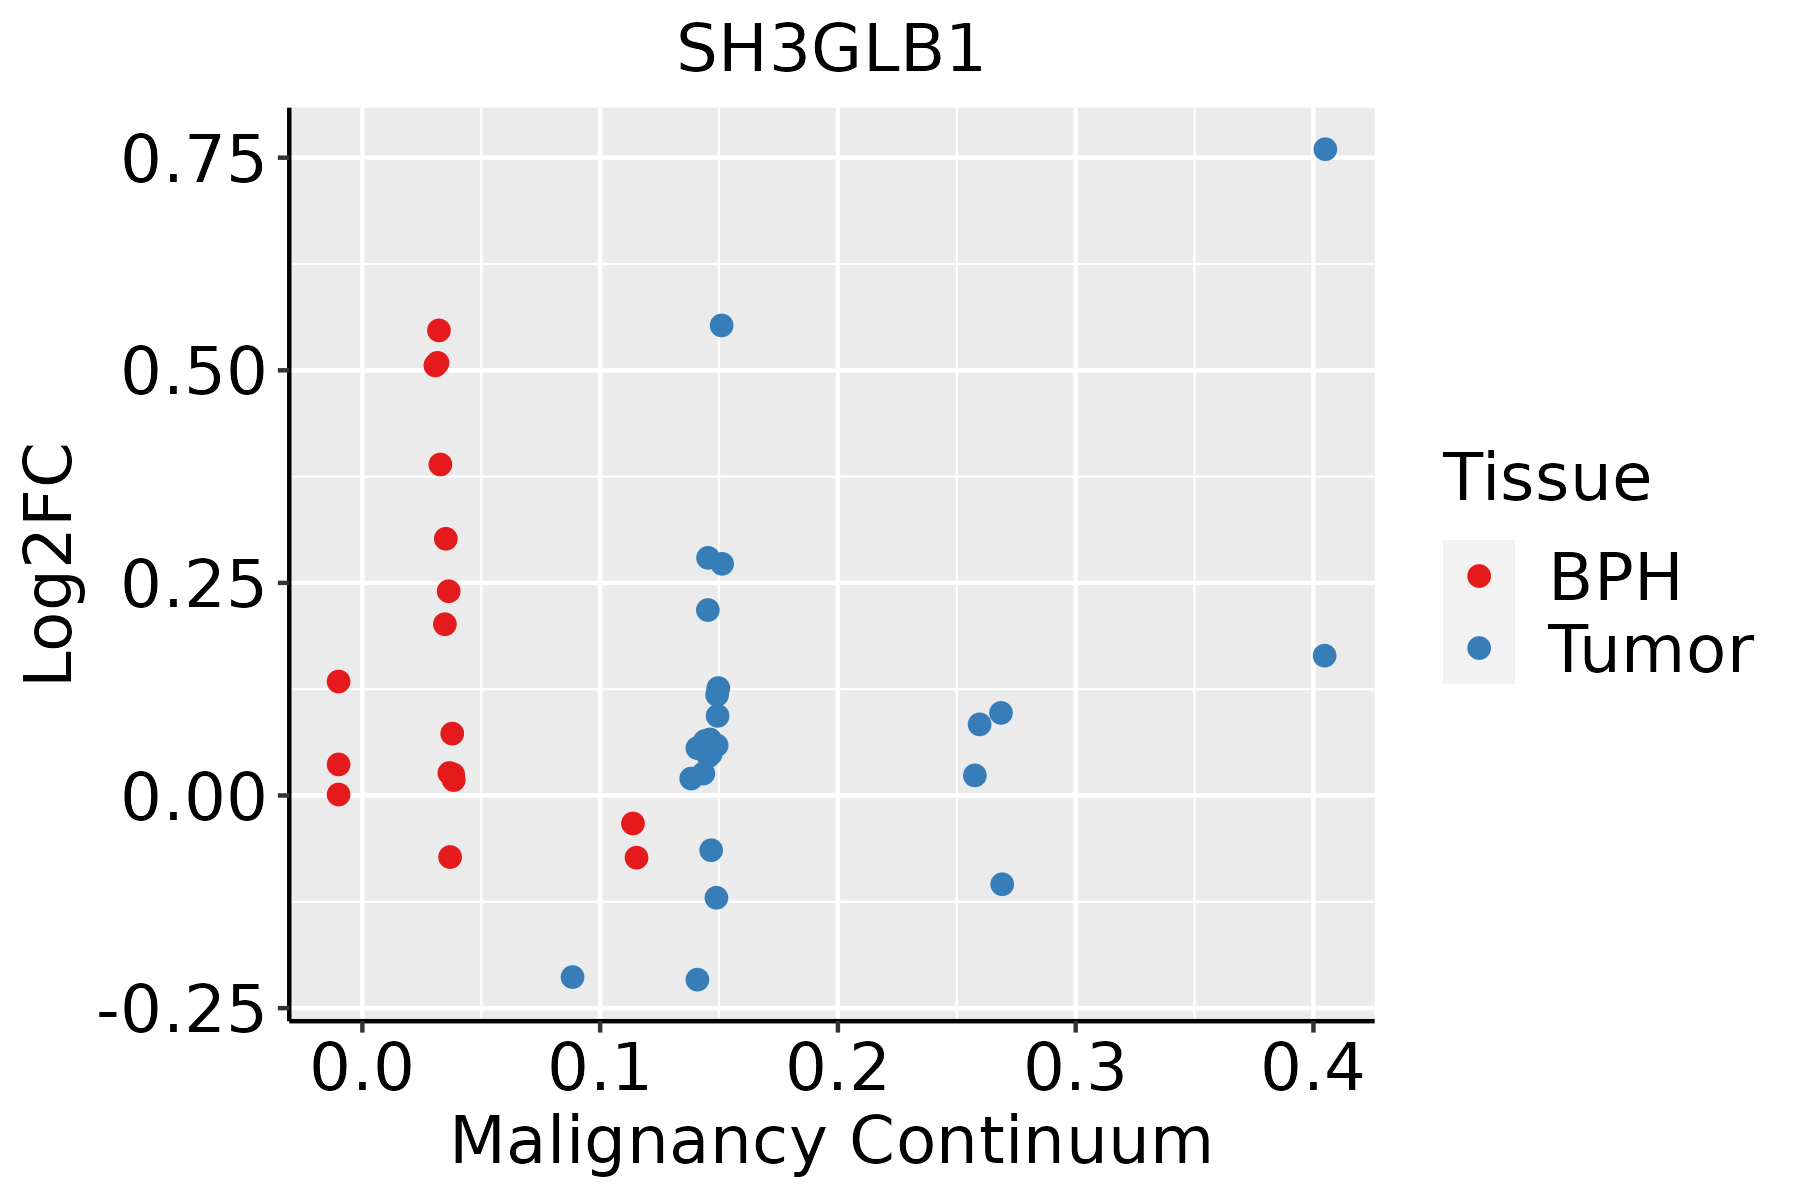 | BPH: Benign Prostatic Hyperplasia |
| Skin |  | AK: Actinic keratosis |
| cSCC: Cutaneous squamous cell carcinoma | ||
| SCCIS:squamous cell carcinoma in situ | ||
| Thyroid | 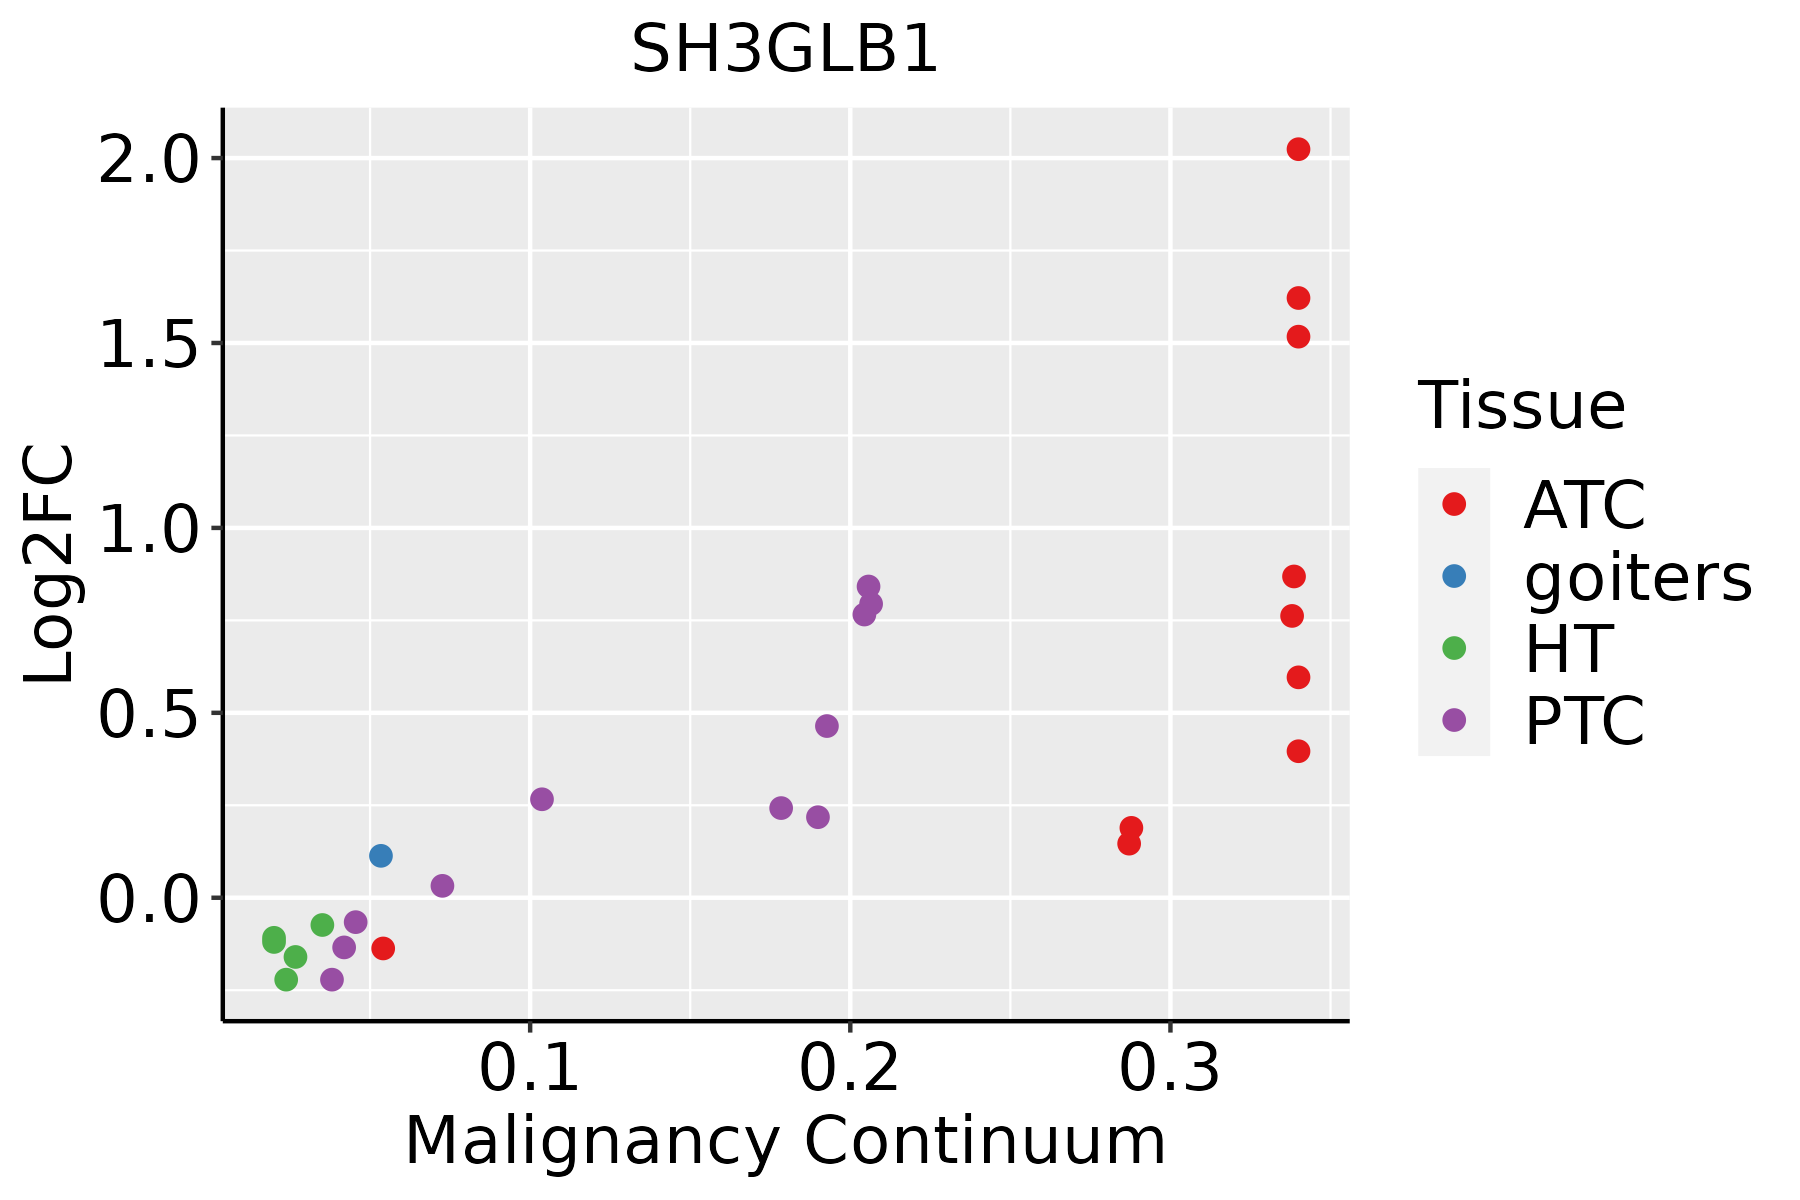 | ATC: Anaplastic thyroid cancer |
| HT: Hashimoto's thyroiditis | ||
| PTC: Papillary thyroid cancer |
| ∗log2FC in expression of this searched gene in stem-like cells from each diseased tissue sample relative to stem-like cells in normal samples in each tissue plotted against the malignancy continuum. Samples are colored based on if they are from different disease stage. |
Top |
Malignant transformation related pathway analysis |
| Find out the enriched GO biological processes and KEGG pathways involved in transition from healthy to precancer to cancer |
| Tissue | Disease Stage | Enriched GO biological Processes |
| Colorectum | AD |  |
| Colorectum | SER |  |
| Colorectum | MSS |  |
| Colorectum | MSI-H |  |
| Colorectum | FAP |  |
| ∗Top 15 enriched GO BP terms are showed in the bar plot of each disease state in each tissue. Each row represents a significant GO biological process which is colored according to the -log10(p.adjust). |
| Page: 1 2 3 4 5 6 7 8 9 |
| GO ID | Tissue | Disease Stage | Description | Gene Ratio | Bg Ratio | pvalue | p.adjust | Count |
| GO:003164727 | Esophagus | HGIN | regulation of protein stability | 96/2587 | 298/18723 | 2.21e-16 | 5.76e-14 | 96 |
| GO:007259420 | Esophagus | HGIN | establishment of protein localization to organelle | 120/2587 | 422/18723 | 1.73e-15 | 4.00e-13 | 120 |
| GO:000989626 | Esophagus | HGIN | positive regulation of catabolic process | 126/2587 | 492/18723 | 1.46e-12 | 2.09e-10 | 126 |
| GO:003133126 | Esophagus | HGIN | positive regulation of cellular catabolic process | 112/2587 | 427/18723 | 5.15e-12 | 6.72e-10 | 112 |
| GO:000683920 | Esophagus | HGIN | mitochondrial transport | 74/2587 | 254/18723 | 1.32e-10 | 1.32e-08 | 74 |
| GO:001050616 | Esophagus | HGIN | regulation of autophagy | 84/2587 | 317/18723 | 1.39e-09 | 1.08e-07 | 84 |
| GO:190382926 | Esophagus | HGIN | positive regulation of cellular protein localization | 75/2587 | 276/18723 | 3.19e-09 | 2.30e-07 | 75 |
| GO:007058520 | Esophagus | HGIN | protein localization to mitochondrion | 43/2587 | 125/18723 | 4.43e-09 | 3.03e-07 | 43 |
| GO:001623616 | Esophagus | HGIN | macroautophagy | 77/2587 | 291/18723 | 7.15e-09 | 4.61e-07 | 77 |
| GO:007265520 | Esophagus | HGIN | establishment of protein localization to mitochondrion | 41/2587 | 120/18723 | 1.26e-08 | 7.96e-07 | 41 |
| GO:000660525 | Esophagus | HGIN | protein targeting | 78/2587 | 314/18723 | 1.08e-07 | 5.47e-06 | 78 |
| GO:003133425 | Esophagus | HGIN | positive regulation of protein-containing complex assembly | 61/2587 | 237/18723 | 7.10e-07 | 3.00e-05 | 61 |
| GO:000662620 | Esophagus | HGIN | protein targeting to mitochondrion | 33/2587 | 100/18723 | 7.99e-07 | 3.35e-05 | 33 |
| GO:003238617 | Esophagus | HGIN | regulation of intracellular transport | 79/2587 | 337/18723 | 1.11e-06 | 4.36e-05 | 79 |
| GO:003315720 | Esophagus | HGIN | regulation of intracellular protein transport | 58/2587 | 229/18723 | 2.29e-06 | 8.29e-05 | 58 |
| GO:004325427 | Esophagus | HGIN | regulation of protein-containing complex assembly | 94/2587 | 428/18723 | 2.39e-06 | 8.55e-05 | 94 |
| GO:190495120 | Esophagus | HGIN | positive regulation of establishment of protein localization | 73/2587 | 319/18723 | 6.99e-06 | 2.14e-04 | 73 |
| GO:003238820 | Esophagus | HGIN | positive regulation of intracellular transport | 51/2587 | 202/18723 | 1.00e-05 | 2.92e-04 | 51 |
| GO:009031616 | Esophagus | HGIN | positive regulation of intracellular protein transport | 42/2587 | 160/18723 | 2.18e-05 | 5.78e-04 | 42 |
| GO:007149626 | Esophagus | HGIN | cellular response to external stimulus | 71/2587 | 320/18723 | 2.77e-05 | 7.19e-04 | 71 |
| Page: 1 2 3 4 5 6 7 8 9 10 11 12 13 14 15 16 17 18 19 20 21 22 23 24 25 26 27 28 29 30 |
| Pathway ID | Tissue | Disease Stage | Description | Gene Ratio | Bg Ratio | pvalue | p.adjust | qvalue | Count |
| hsa0414436 | Oral cavity | LP | Endocytosis | 121/2418 | 251/8465 | 1.89e-11 | 3.70e-10 | 2.38e-10 | 121 |
| hsa0414034 | Oral cavity | LP | Autophagy - animal | 55/2418 | 141/8465 | 4.54e-03 | 1.87e-02 | 1.20e-02 | 55 |
| hsa0414442 | Oral cavity | EOLP | Endocytosis | 71/1218 | 251/8465 | 5.28e-09 | 8.97e-08 | 5.29e-08 | 71 |
| hsa0414041 | Oral cavity | EOLP | Autophagy - animal | 39/1218 | 141/8465 | 2.68e-05 | 1.38e-04 | 8.12e-05 | 39 |
| hsa0414452 | Oral cavity | EOLP | Endocytosis | 71/1218 | 251/8465 | 5.28e-09 | 8.97e-08 | 5.29e-08 | 71 |
| hsa0414051 | Oral cavity | EOLP | Autophagy - animal | 39/1218 | 141/8465 | 2.68e-05 | 1.38e-04 | 8.12e-05 | 39 |
| hsa0414461 | Oral cavity | NEOLP | Endocytosis | 62/1112 | 251/8465 | 3.56e-07 | 4.92e-06 | 3.09e-06 | 62 |
| hsa0414471 | Oral cavity | NEOLP | Endocytosis | 62/1112 | 251/8465 | 3.56e-07 | 4.92e-06 | 3.09e-06 | 62 |
| hsa0414425 | Prostate | BPH | Endocytosis | 89/1718 | 251/8465 | 1.06e-08 | 1.29e-07 | 7.99e-08 | 89 |
| hsa041408 | Prostate | BPH | Autophagy - animal | 42/1718 | 141/8465 | 4.46e-03 | 1.53e-02 | 9.49e-03 | 42 |
| hsa04144111 | Prostate | BPH | Endocytosis | 89/1718 | 251/8465 | 1.06e-08 | 1.29e-07 | 7.99e-08 | 89 |
| hsa0414013 | Prostate | BPH | Autophagy - animal | 42/1718 | 141/8465 | 4.46e-03 | 1.53e-02 | 9.49e-03 | 42 |
| hsa0414426 | Prostate | Tumor | Endocytosis | 92/1791 | 251/8465 | 7.83e-09 | 1.04e-07 | 6.43e-08 | 92 |
| hsa0414023 | Prostate | Tumor | Autophagy - animal | 44/1791 | 141/8465 | 3.16e-03 | 1.15e-02 | 7.12e-03 | 44 |
| hsa0414435 | Prostate | Tumor | Endocytosis | 92/1791 | 251/8465 | 7.83e-09 | 1.04e-07 | 6.43e-08 | 92 |
| hsa0414033 | Prostate | Tumor | Autophagy - animal | 44/1791 | 141/8465 | 3.16e-03 | 1.15e-02 | 7.12e-03 | 44 |
| Page: 1 2 |
Top |
Cell-cell communication analysis |
| Identification of potential cell-cell interactions between two cell types and their ligand-receptor pairs for different disease states |
| Ligand | Receptor | LRpair | Pathway | Tissue | Disease Stage |
| Page: 1 |
Top |
Single-cell gene regulatory network inference analysis |
| Find out the significant the regulons (TFs) and the target genes of each regulon across cell types for different disease states |
| TF | Cell Type | Tissue | Disease Stage | Target Gene | RSS | Regulon Activity |
| ∗The dot plots of a searched regulon are shown for all cell subpopulations in each disease state of each tissue based on the regulon specific score inferred using pySCENIC and by calculating the average expression. |
| Page: 1 |
Top |
Somatic mutation of malignant transformation related genes |
| Annotation of somatic variants for genes involved in malignant transformation |
| Hugo Symbol | Variant Class | Variant Classification | dbSNP RS | HGVSc | HGVSp | HGVSp Short | SWISSPROT | BIOTYPE | SIFT | PolyPhen | Tumor Sample Barcode | Tissue | Histology | Sex | Age | Stage | Therapy Types | Drugs | Outcome |
| SH3GLB1 | SNV | Missense_Mutation | rs533090731 | c.878N>G | p.Asn293Ser | p.N293S | protein_coding | tolerated(0.87) | benign(0.077) | TCGA-C8-A26Z-01 | Breast | breast invasive carcinoma | Female | <65 | I/II | Hormone Therapy | tamoxiphen | CR | |
| SH3GLB1 | SNV | Missense_Mutation | rs777019424 | c.413N>T | p.Thr138Met | p.T138M | protein_coding | deleterious(0.01) | probably_damaging(0.979) | TCGA-EK-A2RL-01 | Cervix | cervical & endocervical cancer | Female | <65 | I/II | Chemotherapy | taxol | PD | |
| SH3GLB1 | SNV | Missense_Mutation | c.254N>C | p.Arg85Thr | p.R85T | protein_coding | deleterious(0.03) | probably_damaging(0.962) | TCGA-EK-A3GK-01 | Cervix | cervical & endocervical cancer | Female | <65 | I/II | Unknown | Unknown | SD | ||
| SH3GLB1 | SNV | Missense_Mutation | c.926N>A | p.Gly309Asp | p.G309D | protein_coding | tolerated(0.28) | benign(0.088) | TCGA-AA-3852-01 | Colorectum | colon adenocarcinoma | Male | >=65 | I/II | Unknown | Unknown | PD | ||
| SH3GLB1 | SNV | Missense_Mutation | novel | c.666N>T | p.Gln222His | p.Q222H | protein_coding | tolerated(0.41) | probably_damaging(0.978) | TCGA-AA-3947-01 | Colorectum | colon adenocarcinoma | Female | <65 | I/II | Unknown | Unknown | SD | |
| SH3GLB1 | SNV | Missense_Mutation | rs751120404 | c.618N>A | p.Phe206Leu | p.F206L | protein_coding | tolerated(0.79) | benign(0.007) | TCGA-AA-A010-01 | Colorectum | colon adenocarcinoma | Female | <65 | I/II | Chemotherapy | folinic | CR | |
| SH3GLB1 | SNV | Missense_Mutation | c.1181N>G | p.Asn394Ser | p.N394S | protein_coding | tolerated(1) | probably_damaging(0.999) | TCGA-G4-6625-01 | Colorectum | colon adenocarcinoma | Female | >=65 | I/II | Unknown | Unknown | PD | ||
| SH3GLB1 | SNV | Missense_Mutation | novel | c.427T>G | p.Phe143Val | p.F143V | protein_coding | tolerated(0.05) | probably_damaging(0.999) | TCGA-AG-A002-01 | Colorectum | rectum adenocarcinoma | Male | <65 | I/II | Unknown | Unknown | SD | |
| SH3GLB1 | SNV | Missense_Mutation | novel | c.940N>A | p.Ala314Thr | p.A314T | protein_coding | tolerated(0.27) | benign(0.007) | TCGA-A5-A0G1-01 | Endometrium | uterine corpus endometrioid carcinoma | Female | >=65 | I/II | Unknown | Unknown | SD | |
| SH3GLB1 | SNV | Missense_Mutation | novel | c.133N>A | p.Leu45Ile | p.L45I | protein_coding | deleterious(0) | probably_damaging(0.999) | TCGA-A5-A0G2-01 | Endometrium | uterine corpus endometrioid carcinoma | Female | <65 | III/IV | Unknown | Unknown | SD |
| Page: 1 2 3 4 |
Top |
Related drugs of malignant transformation related genes |
| Identification of chemicals and drugs interact with genes involved in malignant transfromation |
| (DGIdb 4.0) |
| Entrez ID | Symbol | Category | Interaction Types | Drug Claim Name | Drug Name | PMIDs |
| Page: 1 |

Copyright 2023-Present -The University of Texas Health Science Center at Houston |