
|
|||||
|
 | |
| |
| |
| |
| |
| |
|
Gene: PIK3CA |
Gene summary for PIK3CA |
| Gene information | Species | Human | Gene symbol | PIK3CA | Gene ID | 5290 |
| Gene name | phosphatidylinositol-4,5-bisphosphate 3-kinase catalytic subunit alpha | |
| Gene Alias | CLAPO | |
| Cytomap | 3q26.32 | |
| Gene Type | protein-coding | GO ID | GO:0001101 | UniProtAcc | P42336 |
Top |
Malignant transformation analysis |
| Identification of the aberrant gene expression in precancerous and cancerous lesions by comparing the gene expression of stem-like cells in diseased tissues with normal stem cells |
| Entrez ID | Symbol | Replicates | Species | Organ | Tissue | Adj P-value | Log2FC | Malignancy |
| 5290 | PIK3CA | CA_HPV_2 | Human | Cervix | CC | 6.44e-06 | 3.23e-01 | 0.0391 |
| 5290 | PIK3CA | CCI_2 | Human | Cervix | CC | 3.01e-09 | 1.19e+00 | 0.5249 |
| 5290 | PIK3CA | CCI_3 | Human | Cervix | CC | 8.00e-05 | 6.32e-01 | 0.516 |
| 5290 | PIK3CA | HCC1_Meng | Human | Liver | HCC | 7.90e-28 | 1.41e-02 | 0.0246 |
| 5290 | PIK3CA | HCC2_Meng | Human | Liver | HCC | 8.04e-25 | 1.29e-01 | 0.0107 |
| 5290 | PIK3CA | HCC1 | Human | Liver | HCC | 6.95e-10 | 3.40e+00 | 0.5336 |
| 5290 | PIK3CA | HCC2 | Human | Liver | HCC | 1.23e-13 | 3.78e+00 | 0.5341 |
| 5290 | PIK3CA | S028 | Human | Liver | HCC | 9.79e-07 | 3.87e-01 | 0.2503 |
| 5290 | PIK3CA | S029 | Human | Liver | HCC | 2.66e-04 | 3.62e-01 | 0.2581 |
| 5290 | PIK3CA | male-WTA | Human | Thyroid | PTC | 3.74e-13 | 5.74e-02 | 0.1037 |
| 5290 | PIK3CA | PTC01 | Human | Thyroid | PTC | 2.99e-12 | 4.20e-02 | 0.1899 |
| 5290 | PIK3CA | PTC04 | Human | Thyroid | PTC | 2.28e-16 | 2.51e-01 | 0.1927 |
| 5290 | PIK3CA | PTC05 | Human | Thyroid | PTC | 3.40e-11 | 4.25e-01 | 0.2065 |
| 5290 | PIK3CA | PTC06 | Human | Thyroid | PTC | 9.79e-15 | 4.11e-01 | 0.2057 |
| 5290 | PIK3CA | PTC07 | Human | Thyroid | PTC | 8.04e-18 | 2.27e-01 | 0.2044 |
| 5290 | PIK3CA | ATC09 | Human | Thyroid | ATC | 4.79e-05 | 1.50e-01 | 0.2871 |
| 5290 | PIK3CA | ATC11 | Human | Thyroid | ATC | 1.53e-05 | 4.32e-01 | 0.3386 |
| 5290 | PIK3CA | ATC12 | Human | Thyroid | ATC | 1.44e-08 | 8.02e-02 | 0.34 |
| 5290 | PIK3CA | ATC13 | Human | Thyroid | ATC | 1.25e-43 | 7.28e-01 | 0.34 |
| 5290 | PIK3CA | ATC1 | Human | Thyroid | ATC | 4.24e-06 | 2.20e-01 | 0.2878 |
| Page: 1 2 |
| Tissue | Expression Dynamics | Abbreviation |
| Cervix | 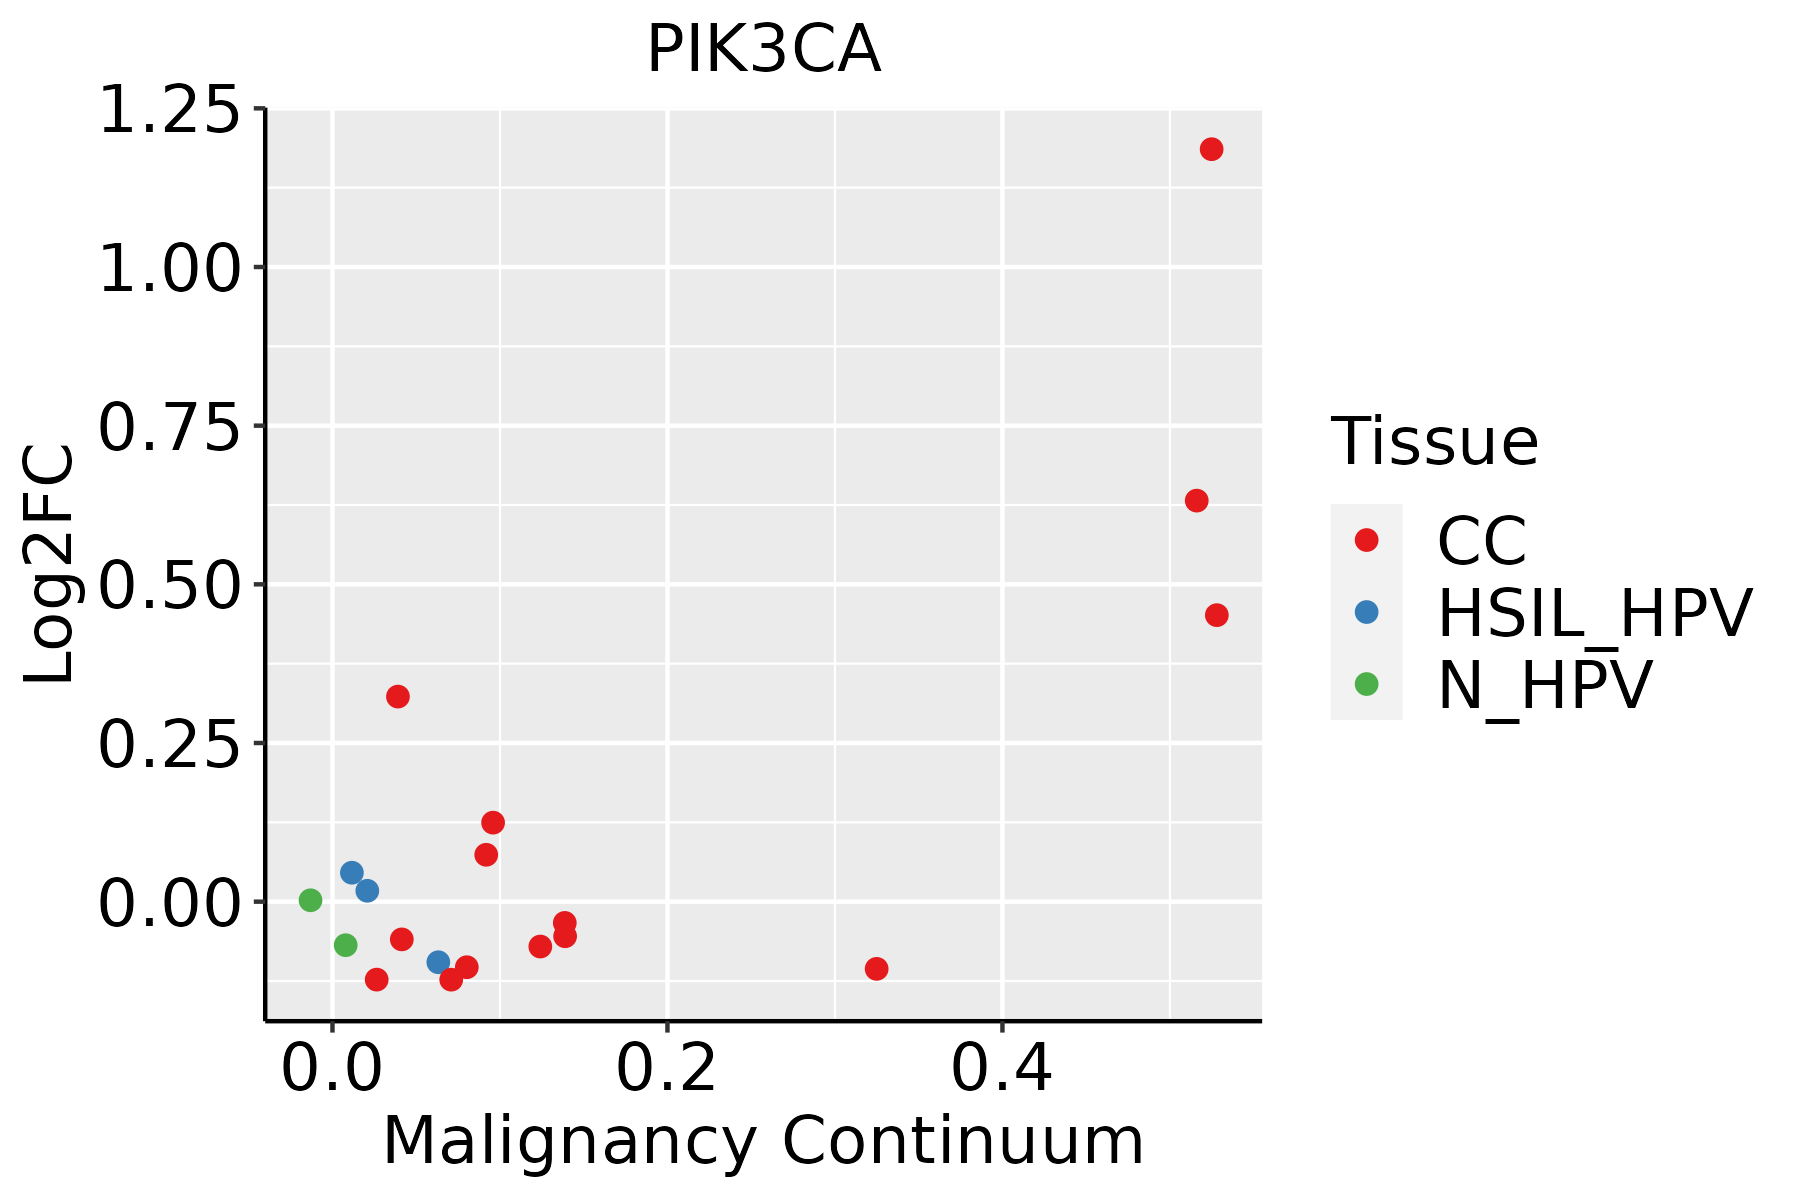 | CC: Cervix cancer |
| HSIL_HPV: HPV-infected high-grade squamous intraepithelial lesions | ||
| N_HPV: HPV-infected normal cervix | ||
| Liver | 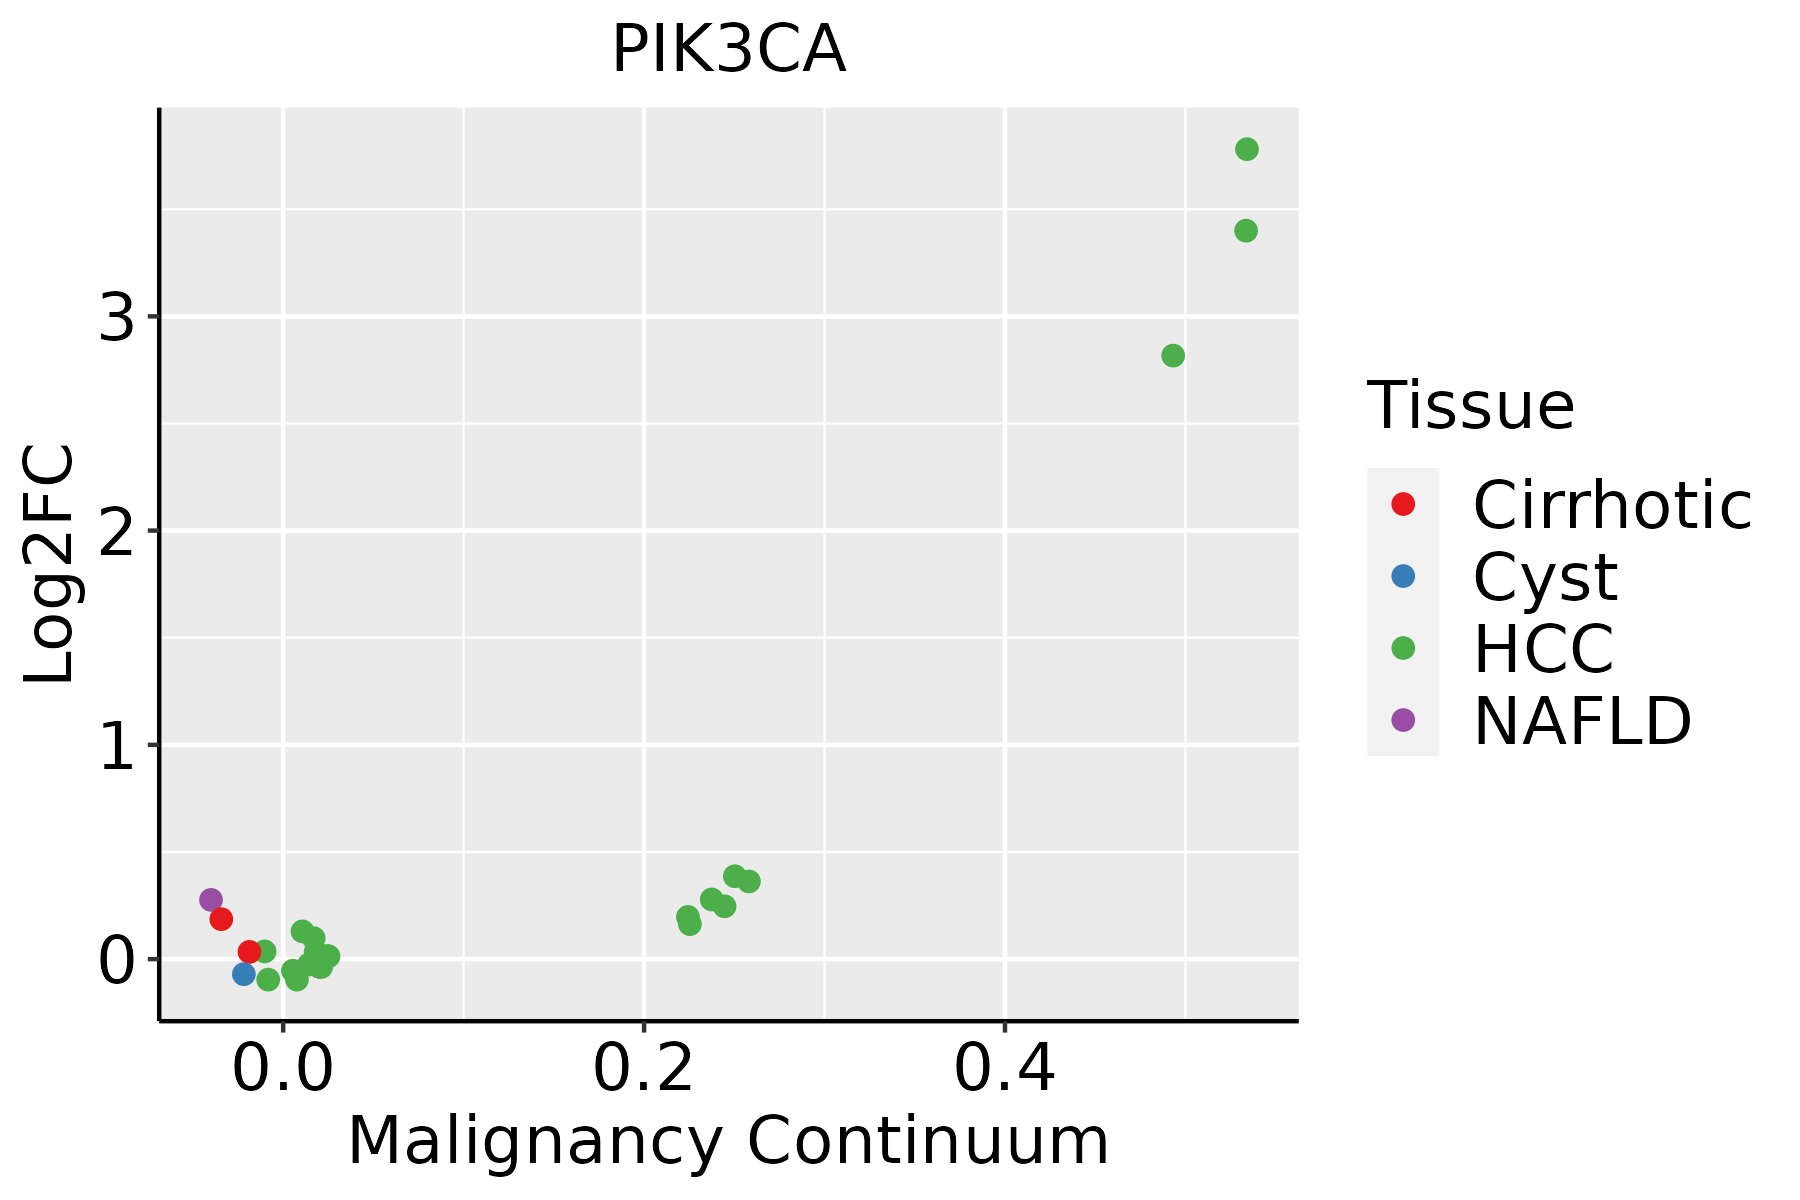 | HCC: Hepatocellular carcinoma |
| NAFLD: Non-alcoholic fatty liver disease | ||
| Thyroid | 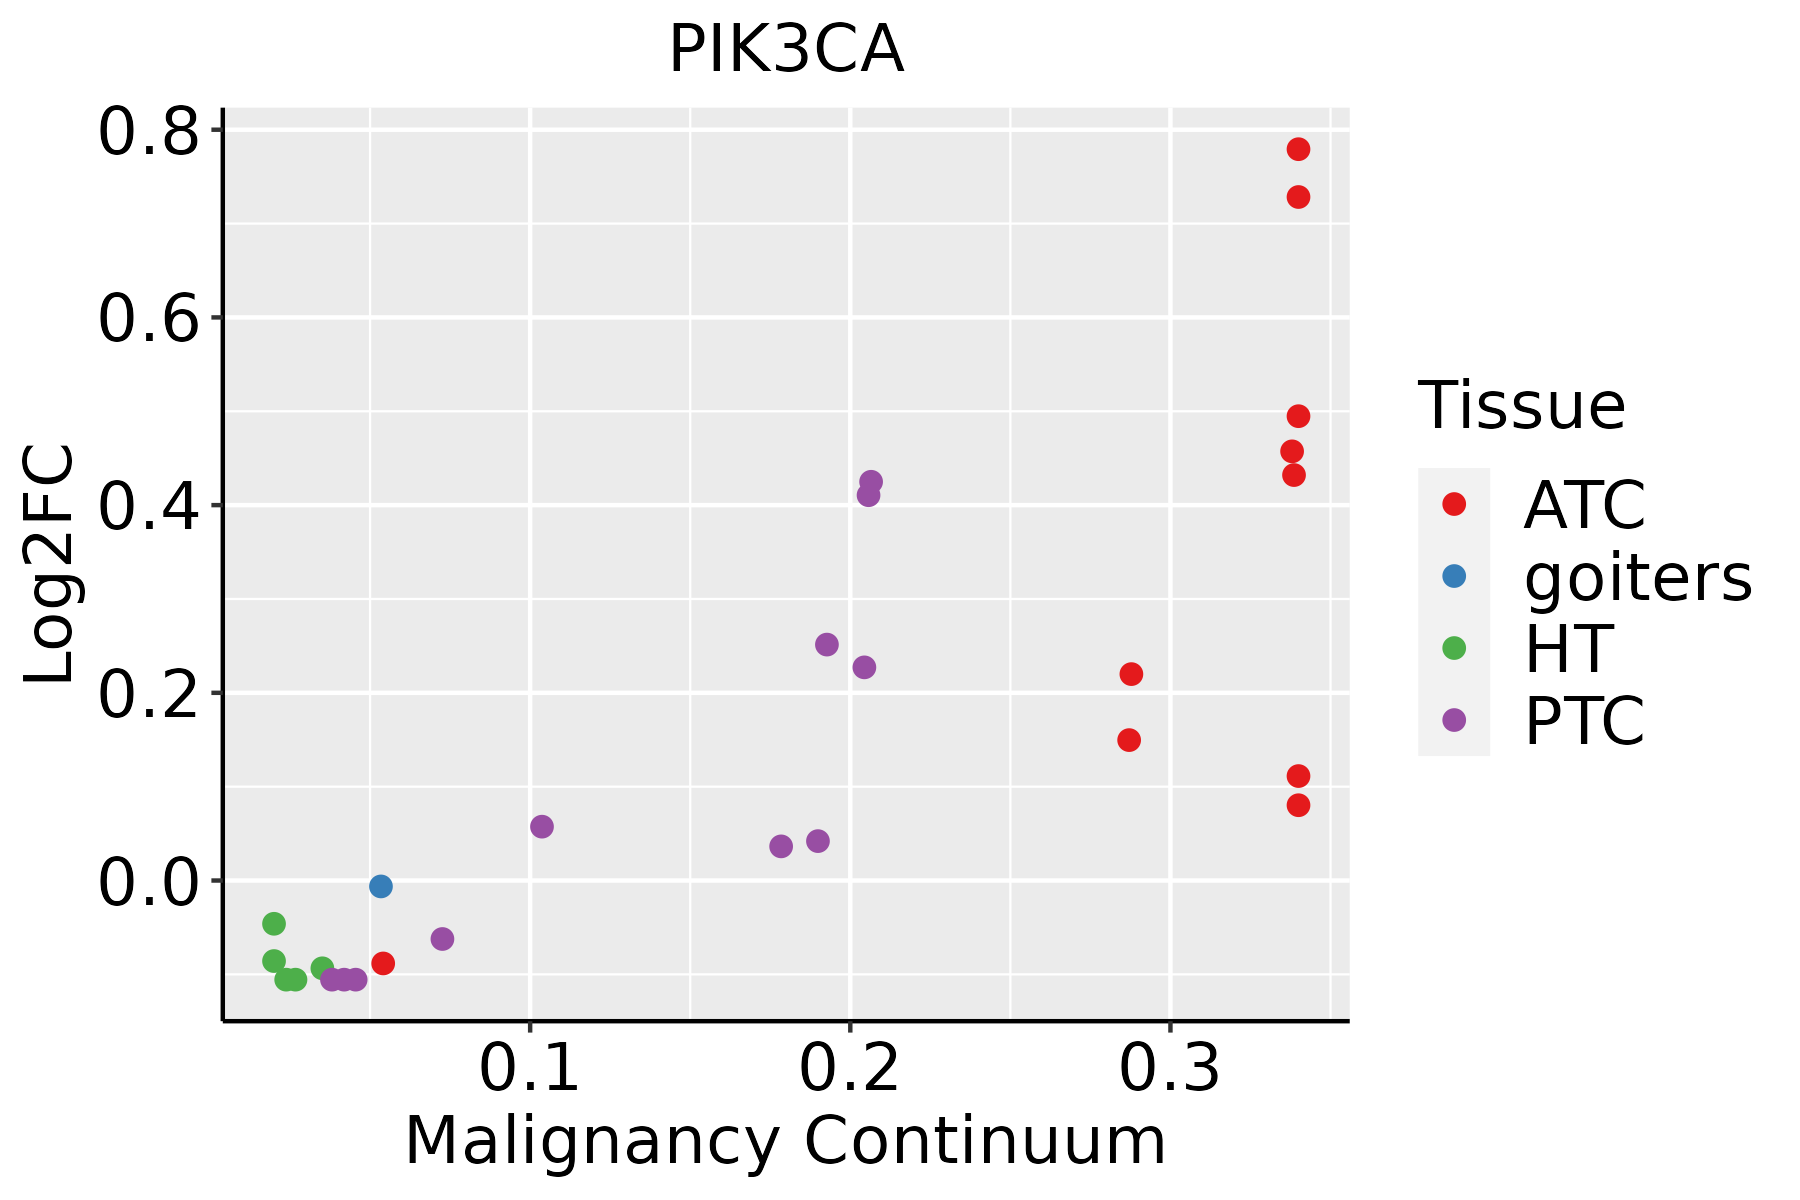 | ATC: Anaplastic thyroid cancer |
| HT: Hashimoto's thyroiditis | ||
| PTC: Papillary thyroid cancer |
| ∗log2FC in expression of this searched gene in stem-like cells from each diseased tissue sample relative to stem-like cells in normal samples in each tissue plotted against the malignancy continuum. Samples are colored based on if they are from different disease stage. |
Top |
Malignant transformation related pathway analysis |
| Find out the enriched GO biological processes and KEGG pathways involved in transition from healthy to precancer to cancer |
| Tissue | Disease Stage | Enriched GO biological Processes |
| Colorectum | AD |  |
| Colorectum | SER |  |
| Colorectum | MSS |  |
| Colorectum | MSI-H |  |
| Colorectum | FAP |  |
| ∗Top 15 enriched GO BP terms are showed in the bar plot of each disease state in each tissue. Each row represents a significant GO biological process which is colored according to the -log10(p.adjust). |
| Page: 1 2 3 4 5 6 7 8 9 |
| GO ID | Tissue | Disease Stage | Description | Gene Ratio | Bg Ratio | pvalue | p.adjust | Count |
| GO:004206010 | Cervix | CC | wound healing | 109/2311 | 422/18723 | 1.84e-14 | 1.57e-11 | 109 |
| GO:000701510 | Cervix | CC | actin filament organization | 109/2311 | 442/18723 | 4.92e-13 | 2.45e-10 | 109 |
| GO:00453339 | Cervix | CC | cellular respiration | 66/2311 | 230/18723 | 2.07e-11 | 5.39e-09 | 66 |
| GO:009013210 | Cervix | CC | epithelium migration | 90/2311 | 360/18723 | 2.45e-11 | 6.11e-09 | 90 |
| GO:00016679 | Cervix | CC | ameboidal-type cell migration | 110/2311 | 475/18723 | 2.66e-11 | 6.36e-09 | 110 |
| GO:001063110 | Cervix | CC | epithelial cell migration | 89/2311 | 357/18723 | 3.72e-11 | 8.54e-09 | 89 |
| GO:003297010 | Cervix | CC | regulation of actin filament-based process | 96/2311 | 397/18723 | 4.00e-11 | 8.54e-09 | 96 |
| GO:009013010 | Cervix | CC | tissue migration | 90/2311 | 365/18723 | 5.42e-11 | 1.05e-08 | 90 |
| GO:190290310 | Cervix | CC | regulation of supramolecular fiber organization | 92/2311 | 383/18723 | 1.49e-10 | 2.48e-08 | 92 |
| GO:002240710 | Cervix | CC | regulation of cell-cell adhesion | 103/2311 | 448/18723 | 1.78e-10 | 2.87e-08 | 103 |
| GO:004578510 | Cervix | CC | positive regulation of cell adhesion | 101/2311 | 437/18723 | 1.96e-10 | 3.08e-08 | 101 |
| GO:003295610 | Cervix | CC | regulation of actin cytoskeleton organization | 86/2311 | 358/18723 | 5.90e-10 | 7.51e-08 | 86 |
| GO:00421108 | Cervix | CC | T cell activation | 107/2311 | 487/18723 | 1.24e-09 | 1.46e-07 | 107 |
| GO:00508638 | Cervix | CC | regulation of T cell activation | 80/2311 | 329/18723 | 1.28e-09 | 1.47e-07 | 80 |
| GO:00060919 | Cervix | CC | generation of precursor metabolites and energy | 105/2311 | 490/18723 | 7.40e-09 | 6.61e-07 | 105 |
| GO:00071598 | Cervix | CC | leukocyte cell-cell adhesion | 85/2311 | 371/18723 | 8.27e-09 | 7.07e-07 | 85 |
| GO:003367410 | Cervix | CC | positive regulation of kinase activity | 101/2311 | 467/18723 | 8.66e-09 | 7.22e-07 | 101 |
| GO:00071738 | Cervix | CC | epidermal growth factor receptor signaling pathway | 36/2311 | 108/18723 | 1.04e-08 | 8.44e-07 | 36 |
| GO:00159809 | Cervix | CC | energy derivation by oxidation of organic compounds | 74/2311 | 318/18723 | 3.83e-08 | 2.53e-06 | 74 |
| GO:011005310 | Cervix | CC | regulation of actin filament organization | 67/2311 | 278/18723 | 4.01e-08 | 2.54e-06 | 67 |
| Page: 1 2 3 4 5 6 7 8 9 10 11 12 13 14 15 16 17 18 19 20 21 22 |
| Pathway ID | Tissue | Disease Stage | Description | Gene Ratio | Bg Ratio | pvalue | p.adjust | qvalue | Count |
| hsa0401512 | Cervix | CC | Rap1 signaling pathway | 56/1267 | 210/8465 | 6.23e-06 | 5.61e-05 | 3.32e-05 | 56 |
| hsa0466612 | Cervix | CC | Fc gamma R-mediated phagocytosis | 31/1267 | 97/8465 | 1.78e-05 | 1.42e-04 | 8.40e-05 | 31 |
| hsa0517016 | Cervix | CC | Human immunodeficiency virus 1 infection | 55/1267 | 212/8465 | 1.80e-05 | 1.42e-04 | 8.40e-05 | 55 |
| hsa0401210 | Cervix | CC | ErbB signaling pathway | 28/1267 | 85/8465 | 2.40e-05 | 1.82e-04 | 1.08e-04 | 28 |
| hsa0513516 | Cervix | CC | Yersinia infection | 39/1267 | 137/8465 | 3.27e-05 | 2.41e-04 | 1.42e-04 | 39 |
| hsa052226 | Cervix | CC | Small cell lung cancer | 29/1267 | 92/8465 | 4.38e-05 | 3.09e-04 | 1.83e-04 | 29 |
| hsa0407110 | Cervix | CC | Sphingolipid signaling pathway | 35/1267 | 121/8465 | 5.70e-05 | 3.93e-04 | 2.32e-04 | 35 |
| hsa043609 | Cervix | CC | Axon guidance | 47/1267 | 182/8465 | 8.13e-05 | 5.38e-04 | 3.18e-04 | 47 |
| hsa0521010 | Cervix | CC | Colorectal cancer | 27/1267 | 86/8465 | 8.60e-05 | 5.57e-04 | 3.30e-04 | 27 |
| hsa052148 | Cervix | CC | Glioma | 24/1267 | 75/8465 | 1.51e-04 | 9.20e-04 | 5.44e-04 | 24 |
| hsa051657 | Cervix | CC | Human papillomavirus infection | 74/1267 | 331/8465 | 1.70e-04 | 1.02e-03 | 6.03e-04 | 74 |
| hsa052128 | Cervix | CC | Pancreatic cancer | 24/1267 | 76/8465 | 1.89e-04 | 1.11e-03 | 6.55e-04 | 24 |
| hsa04664 | Cervix | CC | Fc epsilon RI signaling pathway | 22/1267 | 68/8465 | 2.35e-04 | 1.31e-03 | 7.77e-04 | 22 |
| hsa0516414 | Cervix | CC | Influenza A | 43/1267 | 171/8465 | 3.03e-04 | 1.64e-03 | 9.68e-04 | 43 |
| hsa0491918 | Cervix | CC | Thyroid hormone signaling pathway | 33/1267 | 121/8465 | 3.11e-04 | 1.65e-03 | 9.78e-04 | 33 |
| hsa042109 | Cervix | CC | Apoptosis | 36/1267 | 136/8465 | 3.21e-04 | 1.68e-03 | 9.91e-04 | 36 |
| hsa051465 | Cervix | CC | Amoebiasis | 29/1267 | 102/8465 | 3.31e-04 | 1.70e-03 | 1.01e-03 | 29 |
| hsa015223 | Cervix | CC | Endocrine resistance | 28/1267 | 98/8465 | 3.82e-04 | 1.87e-03 | 1.11e-03 | 28 |
| hsa0472214 | Cervix | CC | Neurotrophin signaling pathway | 32/1267 | 119/8465 | 5.01e-04 | 2.42e-03 | 1.43e-03 | 32 |
| hsa0510020 | Cervix | CC | Bacterial invasion of epithelial cells | 23/1267 | 77/8465 | 6.25e-04 | 2.93e-03 | 1.73e-03 | 23 |
| Page: 1 2 3 4 5 6 7 8 9 10 11 12 13 |
Top |
Cell-cell communication analysis |
| Identification of potential cell-cell interactions between two cell types and their ligand-receptor pairs for different disease states |
| Ligand | Receptor | LRpair | Pathway | Tissue | Disease Stage |
| Page: 1 |
Top |
Single-cell gene regulatory network inference analysis |
| Find out the significant the regulons (TFs) and the target genes of each regulon across cell types for different disease states |
| TF | Cell Type | Tissue | Disease Stage | Target Gene | RSS | Regulon Activity |
| ∗The dot plots of a searched regulon are shown for all cell subpopulations in each disease state of each tissue based on the regulon specific score inferred using pySCENIC and by calculating the average expression. |
| Page: 1 |
Top |
Somatic mutation of malignant transformation related genes |
| Annotation of somatic variants for genes involved in malignant transformation |
| Hugo Symbol | Variant Class | Variant Classification | dbSNP RS | HGVSc | HGVSp | HGVSp Short | SWISSPROT | BIOTYPE | SIFT | PolyPhen | Tumor Sample Barcode | Tissue | Histology | Sex | Age | Stage | Therapy Types | Drugs | Outcome |
| PIK3CA | SNV | Missense_Mutation | rs121913273 | c.1624G>A | p.Glu542Lys | p.E542K | P42336 | protein_coding | deleterious(0.04) | probably_damaging(0.912) | TCGA-3C-AALK-01 | Breast | breast invasive carcinoma | Female | <65 | I/II | Chemotherapy | docetaxel | SD |
| PIK3CA | SNV | Missense_Mutation | c.3012G>T | p.Met1004Ile | p.M1004I | P42336 | protein_coding | deleterious(0.01) | benign(0.047) | TCGA-3C-AALK-01 | Breast | breast invasive carcinoma | Female | <65 | I/II | Chemotherapy | docetaxel | SD | |
| PIK3CA | SNV | Missense_Mutation | rs121913279 | c.3140A>T | p.His1047Leu | p.H1047L | P42336 | protein_coding | tolerated(0.44) | benign(0.007) | TCGA-5L-AAT0-01 | Breast | breast invasive carcinoma | Female | <65 | I/II | Hormone Therapy | tamoxiphen | SD |
| PIK3CA | SNV | Missense_Mutation | rs121913287 | c.263G>A | p.Arg88Gln | p.R88Q | P42336 | protein_coding | tolerated(0.06) | probably_damaging(0.971) | TCGA-5L-AAT1-01 | Breast | breast invasive carcinoma | Female | <65 | III/IV | Hormone Therapy | letrozol | SD |
| PIK3CA | SNV | Missense_Mutation | rs121913273 | c.1624G>A | p.Glu542Lys | p.E542K | P42336 | protein_coding | deleterious(0.04) | probably_damaging(0.912) | TCGA-5L-AAT1-01 | Breast | breast invasive carcinoma | Female | <65 | III/IV | Hormone Therapy | letrozol | SD |
| PIK3CA | SNV | Missense_Mutation | rs867262025 | c.2176N>A | p.Glu726Lys | p.E726K | P42336 | protein_coding | tolerated(0.36) | benign(0.396) | TCGA-A1-A0SI-01 | Breast | breast invasive carcinoma | Female | <65 | I/II | Unknown | Unknown | SD |
| PIK3CA | SNV | Missense_Mutation | rs121913279 | c.3140N>G | p.His1047Arg | p.H1047R | P42336 | protein_coding | tolerated(0.11) | benign(0.085) | TCGA-A1-A0SI-01 | Breast | breast invasive carcinoma | Female | <65 | I/II | Unknown | Unknown | SD |
| PIK3CA | SNV | Missense_Mutation | rs121913273 | c.1624N>A | p.Glu542Lys | p.E542K | P42336 | protein_coding | deleterious(0.04) | probably_damaging(0.912) | TCGA-A2-A04N-01 | Breast | breast invasive carcinoma | Female | >=65 | I/II | Chemotherapy | cytoxan | SD |
| PIK3CA | SNV | Missense_Mutation | rs121913287 | c.263N>A | p.Arg88Gln | p.R88Q | P42336 | protein_coding | tolerated(0.06) | probably_damaging(0.971) | TCGA-A2-A04P-01 | Breast | breast invasive carcinoma | Female | <65 | III/IV | Chemotherapy | taxol | PD |
| PIK3CA | SNV | Missense_Mutation | rs121913281 | c.3139N>T | p.His1047Tyr | p.H1047Y | P42336 | protein_coding | tolerated(1) | benign(0) | TCGA-A2-A04T-01 | Breast | breast invasive carcinoma | Female | <65 | I/II | Chemotherapy | cyclophosphamide | SD |
| Page: 1 2 3 4 5 6 7 8 9 10 11 12 13 14 15 16 17 18 19 20 21 22 23 24 25 26 27 28 29 30 31 32 33 34 35 36 37 38 39 40 41 42 43 44 45 46 47 48 49 50 51 52 53 54 55 56 57 58 59 60 61 62 63 64 65 66 67 68 69 70 71 72 73 74 75 76 77 78 79 80 81 82 83 84 85 86 87 88 89 90 91 92 93 94 95 96 97 98 99 100 101 102 103 104 105 106 107 108 109 110 111 112 113 114 115 116 117 118 119 120 121 122 123 124 125 126 127 128 129 130 |
Top |
Related drugs of malignant transformation related genes |
| Identification of chemicals and drugs interact with genes involved in malignant transfromation |
| (DGIdb 4.0) |
| Entrez ID | Symbol | Category | Interaction Types | Drug Claim Name | Drug Name | PMIDs |
| 5290 | PIK3CA | PHOSPHATIDYLINOSITOL 3 KINASE, DRUGGABLE GENOME, CLINICALLY ACTIONABLE, KINASE, ENZYME, SERINE THREONINE KINASE, DRUG RESISTANCE | inhibitor | 249565638 | ALPELISIB | |
| 5290 | PIK3CA | PHOSPHATIDYLINOSITOL 3 KINASE, DRUGGABLE GENOME, CLINICALLY ACTIONABLE, KINASE, ENZYME, SERINE THREONINE KINASE, DRUG RESISTANCE | inhibitor | INK-1117 | INK-1117 | |
| 5290 | PIK3CA | PHOSPHATIDYLINOSITOL 3 KINASE, DRUGGABLE GENOME, CLINICALLY ACTIONABLE, KINASE, ENZYME, SERINE THREONINE KINASE, DRUG RESISTANCE | inhibitor | 354702297 | GSK-1059615 | |
| 5290 | PIK3CA | PHOSPHATIDYLINOSITOL 3 KINASE, DRUGGABLE GENOME, CLINICALLY ACTIONABLE, KINASE, ENZYME, SERINE THREONINE KINASE, DRUG RESISTANCE | MS417 | 26058079 | ||
| 5290 | PIK3CA | PHOSPHATIDYLINOSITOL 3 KINASE, DRUGGABLE GENOME, CLINICALLY ACTIONABLE, KINASE, ENZYME, SERINE THREONINE KINASE, DRUG RESISTANCE | Olaparib | OLAPARIB | 26909613 | |
| 5290 | PIK3CA | PHOSPHATIDYLINOSITOL 3 KINASE, DRUGGABLE GENOME, CLINICALLY ACTIONABLE, KINASE, ENZYME, SERINE THREONINE KINASE, DRUG RESISTANCE | NSC-79888 | CHEMBL1939433 | 22212721 | |
| 5290 | PIK3CA | PHOSPHATIDYLINOSITOL 3 KINASE, DRUGGABLE GENOME, CLINICALLY ACTIONABLE, KINASE, ENZYME, SERINE THREONINE KINASE, DRUG RESISTANCE | CH-5132799 | PA-799 | ||
| 5290 | PIK3CA | PHOSPHATIDYLINOSITOL 3 KINASE, DRUGGABLE GENOME, CLINICALLY ACTIONABLE, KINASE, ENZYME, SERINE THREONINE KINASE, DRUG RESISTANCE | inhibitor | 381118806 | ACALISIB | |
| 5290 | PIK3CA | PHOSPHATIDYLINOSITOL 3 KINASE, DRUGGABLE GENOME, CLINICALLY ACTIONABLE, KINASE, ENZYME, SERINE THREONINE KINASE, DRUG RESISTANCE | ALPELISIB | ALPELISIB | 31091374,24608574 | |
| 5290 | PIK3CA | PHOSPHATIDYLINOSITOL 3 KINASE, DRUGGABLE GENOME, CLINICALLY ACTIONABLE, KINASE, ENZYME, SERINE THREONINE KINASE, DRUG RESISTANCE | Linsitinib | LINSITINIB | 27196766 |
| Page: 1 2 3 4 5 6 7 8 9 10 11 12 13 14 15 16 17 18 19 20 21 22 23 24 25 26 27 28 29 30 31 32 33 34 35 36 37 38 39 |

Copyright 2023-Present -The University of Texas Health Science Center at Houston |