
|
|||||
|
 | |
| |
| |
| |
| |
| |
|
Gene: NDUFA4L2 |
Gene summary for NDUFA4L2 |
| Gene information | Species | Human | Gene symbol | NDUFA4L2 | Gene ID | 56901 |
| Gene name | NDUFA4 mitochondrial complex associated like 2 | |
| Gene Alias | COXFA4L2 | |
| Cytomap | 12q13.3 | |
| Gene Type | protein-coding | GO ID | GO:0005575 | UniProtAcc | A0A024RB39 |
Top |
Malignant transformation analysis |
| Identification of the aberrant gene expression in precancerous and cancerous lesions by comparing the gene expression of stem-like cells in diseased tissues with normal stem cells |
| Entrez ID | Symbol | Replicates | Species | Organ | Tissue | Adj P-value | Log2FC | Malignancy |
| 56901 | NDUFA4L2 | GSM4909281 | Human | Breast | IDC | 1.25e-05 | 3.46e-01 | 0.21 |
| 56901 | NDUFA4L2 | GSM4909282 | Human | Breast | IDC | 1.43e-76 | 1.17e+00 | -0.0288 |
| 56901 | NDUFA4L2 | GSM4909285 | Human | Breast | IDC | 3.82e-92 | 1.42e+00 | 0.21 |
| 56901 | NDUFA4L2 | ctrl6 | Human | Breast | Precancer | 1.72e-03 | 2.70e-01 | -0.0061 |
| 56901 | NDUFA4L2 | brca10 | Human | Breast | Precancer | 8.80e-04 | 3.22e-01 | -0.0029 |
| 56901 | NDUFA4L2 | P2 | Human | Breast | IDC | 2.40e-06 | 4.31e-01 | 0.21 |
| 56901 | NDUFA4L2 | CA_HPV_2 | Human | Cervix | CC | 1.52e-12 | 4.00e-01 | 0.0391 |
| 56901 | NDUFA4L2 | Tumor | Human | Cervix | CC | 5.33e-71 | 1.26e+00 | 0.1241 |
| 56901 | NDUFA4L2 | sample1 | Human | Cervix | CC | 5.89e-28 | 8.95e-01 | 0.0959 |
| 56901 | NDUFA4L2 | sample3 | Human | Cervix | CC | 9.80e-97 | 1.46e+00 | 0.1387 |
| 56901 | NDUFA4L2 | L1 | Human | Cervix | CC | 1.76e-17 | 8.35e-01 | 0.0802 |
| 56901 | NDUFA4L2 | T1 | Human | Cervix | CC | 3.66e-41 | 8.55e-01 | 0.0918 |
| 56901 | NDUFA4L2 | T3 | Human | Cervix | CC | 2.70e-97 | 1.44e+00 | 0.1389 |
| 56901 | NDUFA4L2 | LZE4T | Human | Esophagus | ESCC | 7.13e-48 | 2.35e+00 | 0.0811 |
| 56901 | NDUFA4L2 | LZE8T | Human | Esophagus | ESCC | 6.92e-19 | 1.65e+00 | 0.067 |
| 56901 | NDUFA4L2 | LZE20T | Human | Esophagus | ESCC | 1.86e-26 | 2.21e+00 | 0.0662 |
| 56901 | NDUFA4L2 | LZE22T | Human | Esophagus | ESCC | 2.66e-14 | 1.96e+00 | 0.068 |
| 56901 | NDUFA4L2 | LZE6T | Human | Esophagus | ESCC | 7.14e-05 | 7.73e-01 | 0.0845 |
| 56901 | NDUFA4L2 | P2T-E | Human | Esophagus | ESCC | 5.94e-55 | 1.69e+00 | 0.1177 |
| 56901 | NDUFA4L2 | P4T-E | Human | Esophagus | ESCC | 3.25e-45 | 2.97e+00 | 0.1323 |
| Page: 1 2 3 4 5 |
| Tissue | Expression Dynamics | Abbreviation |
| Breast | 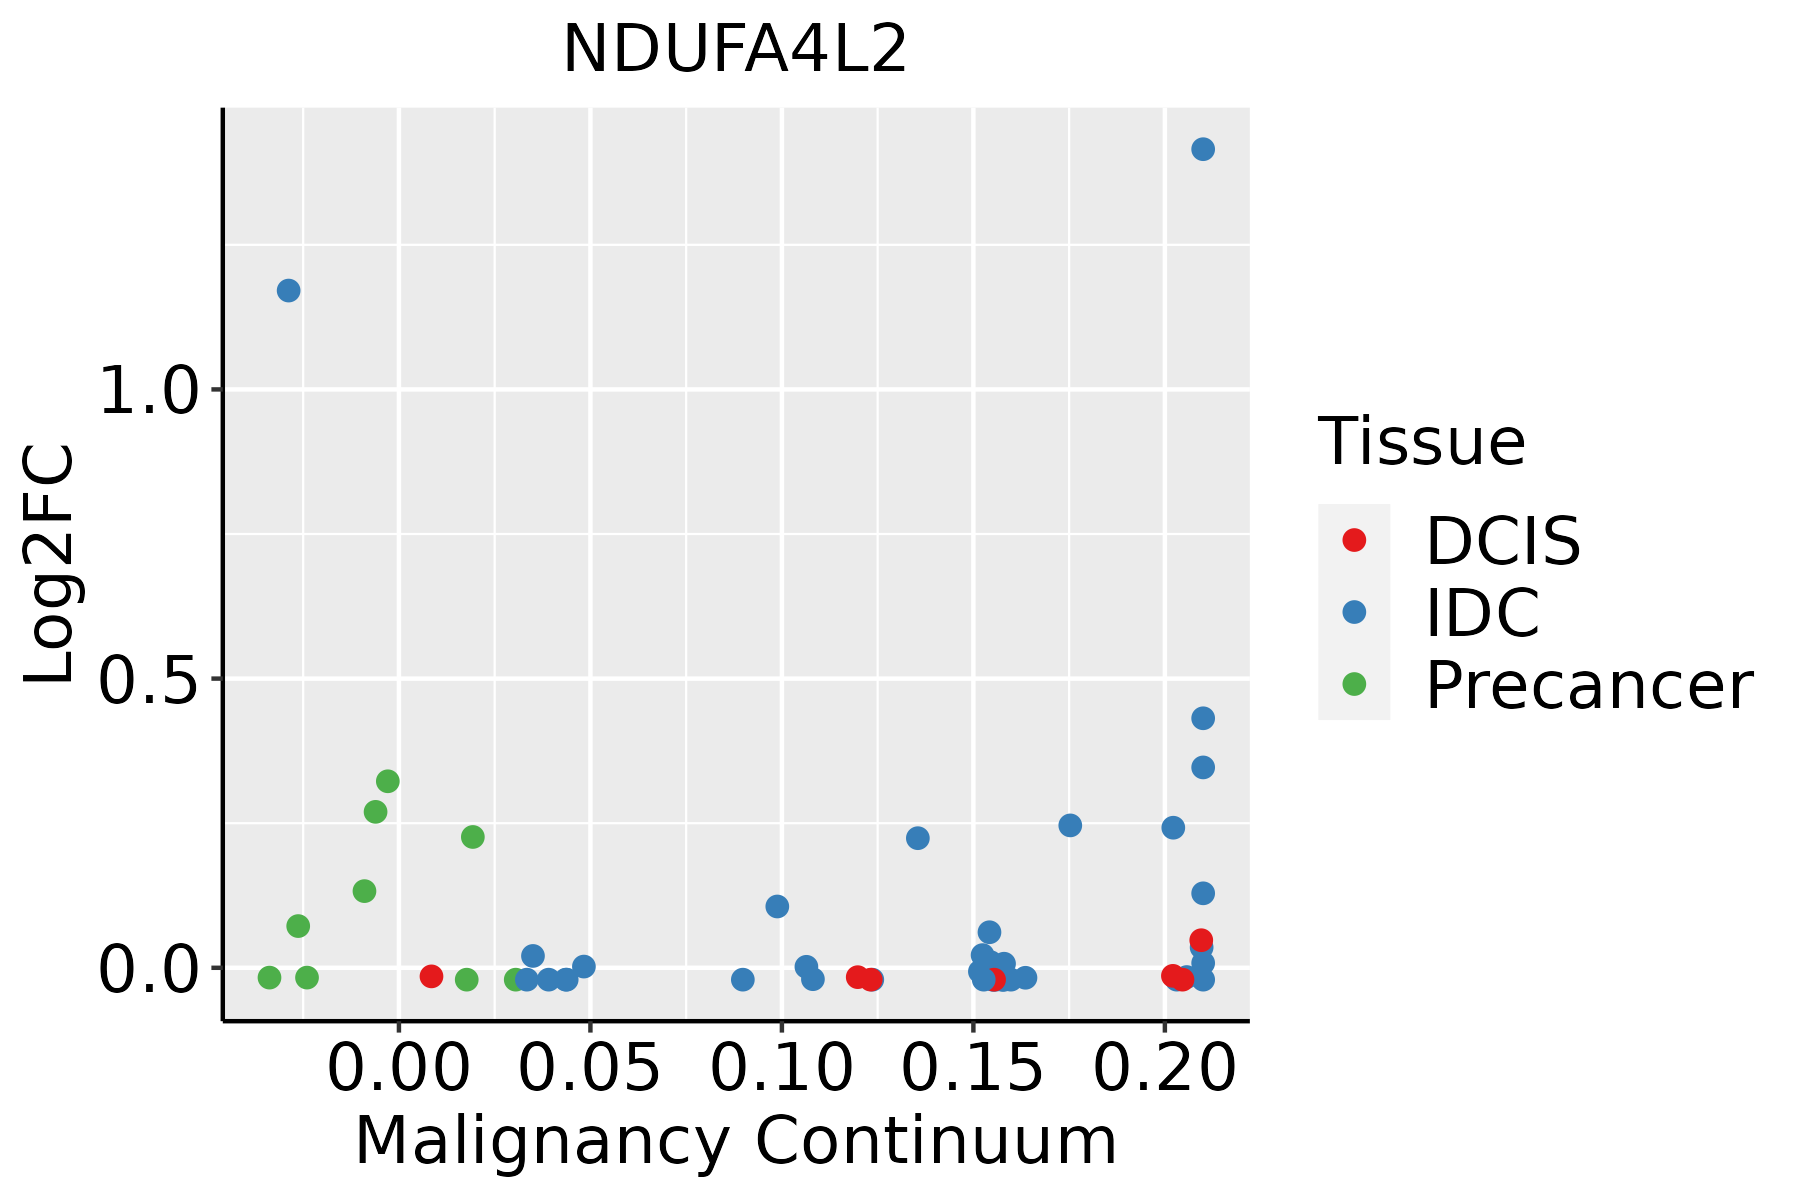 | IDC: Invasive ductal carcinoma |
| DCIS: Ductal carcinoma in situ | ||
| Precancer(BRCA1-mut): Precancerous lesion from BRCA1 mutation carriers | ||
| Cervix | 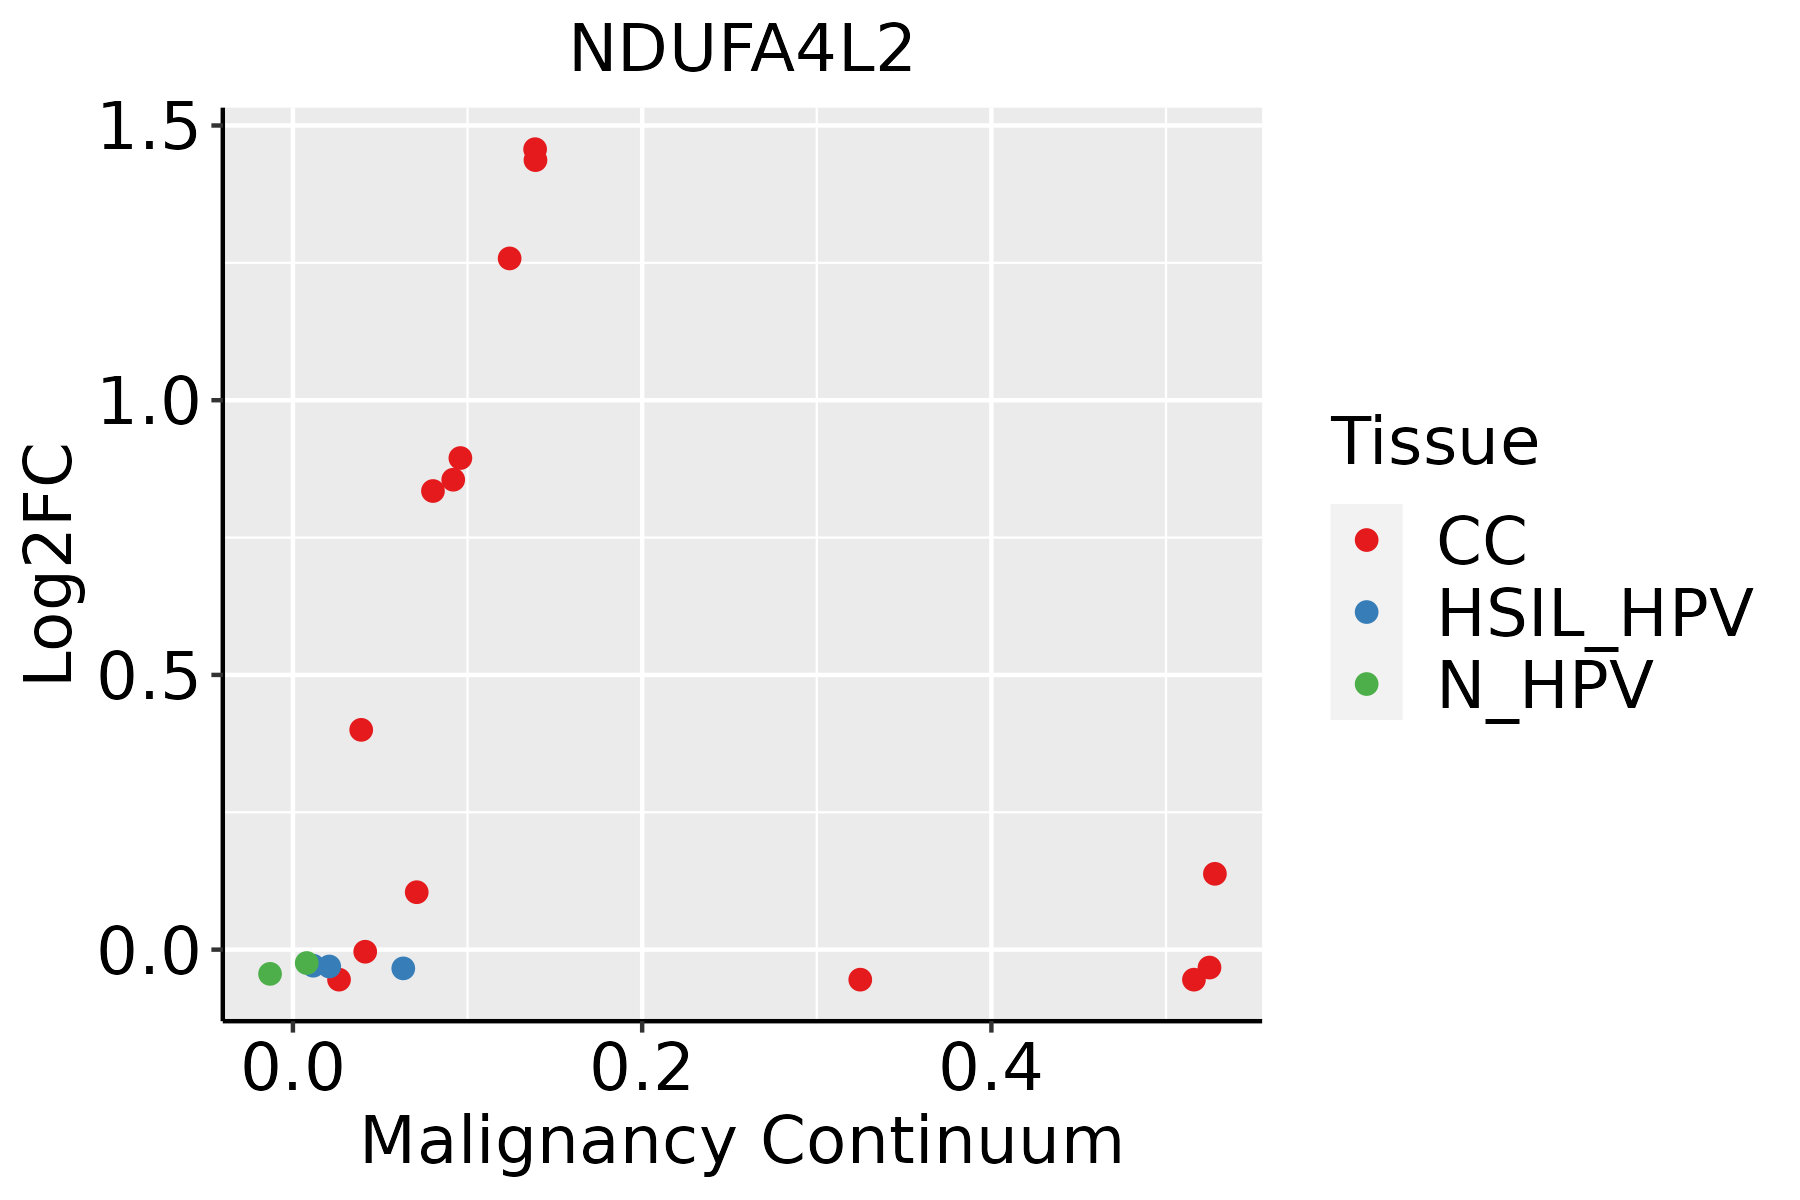 | CC: Cervix cancer |
| HSIL_HPV: HPV-infected high-grade squamous intraepithelial lesions | ||
| N_HPV: HPV-infected normal cervix | ||
| Esophagus |  | ESCC: Esophageal squamous cell carcinoma |
| HGIN: High-grade intraepithelial neoplasias | ||
| LGIN: Low-grade intraepithelial neoplasias | ||
| Liver |  | HCC: Hepatocellular carcinoma |
| NAFLD: Non-alcoholic fatty liver disease | ||
| Oral Cavity | 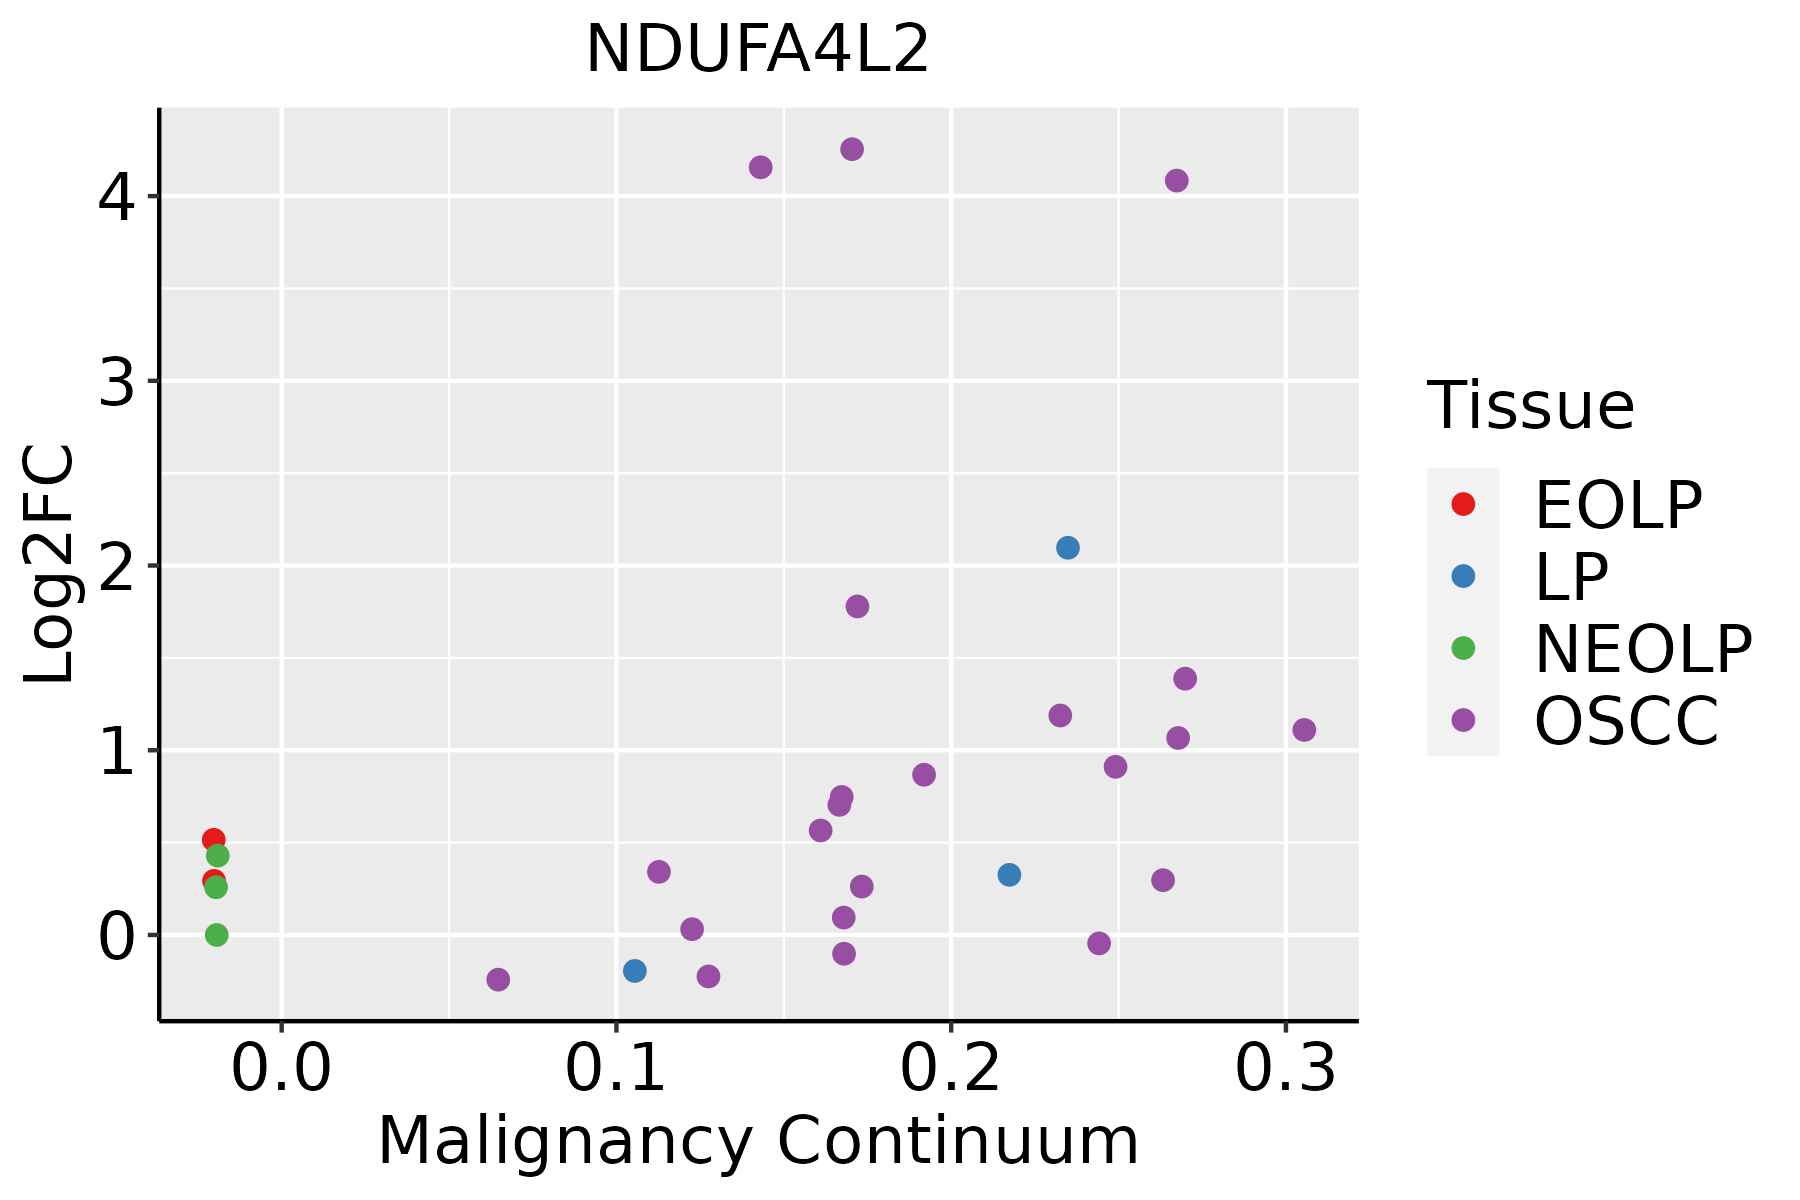 | EOLP: Erosive Oral lichen planus |
| LP: leukoplakia | ||
| NEOLP: Non-erosive oral lichen planus | ||
| OSCC: Oral squamous cell carcinoma | ||
| Skin |  | AK: Actinic keratosis |
| cSCC: Cutaneous squamous cell carcinoma | ||
| SCCIS:squamous cell carcinoma in situ | ||
| Thyroid |  | ATC: Anaplastic thyroid cancer |
| HT: Hashimoto's thyroiditis | ||
| PTC: Papillary thyroid cancer |
| ∗log2FC in expression of this searched gene in stem-like cells from each diseased tissue sample relative to stem-like cells in normal samples in each tissue plotted against the malignancy continuum. Samples are colored based on if they are from different disease stage. |
Top |
Malignant transformation related pathway analysis |
| Find out the enriched GO biological processes and KEGG pathways involved in transition from healthy to precancer to cancer |
| Tissue | Disease Stage | Enriched GO biological Processes |
| Colorectum | AD |  |
| Colorectum | SER |  |
| Colorectum | MSS |  |
| Colorectum | MSI-H |  |
| Colorectum | FAP |  |
| ∗Top 15 enriched GO BP terms are showed in the bar plot of each disease state in each tissue. Each row represents a significant GO biological process which is colored according to the -log10(p.adjust). |
| Page: 1 2 3 4 5 6 7 8 9 |
| GO ID | Tissue | Disease Stage | Description | Gene Ratio | Bg Ratio | pvalue | p.adjust | Count |
| Page: 1 |
| Pathway ID | Tissue | Disease Stage | Description | Gene Ratio | Bg Ratio | pvalue | p.adjust | qvalue | Count |
| hsa0471419 | Breast | Precancer | Thermogenesis | 68/684 | 232/8465 | 4.40e-22 | 1.26e-20 | 9.69e-21 | 68 |
| hsa0541519 | Breast | Precancer | Diabetic cardiomyopathy | 63/684 | 203/8465 | 5.63e-22 | 1.48e-20 | 1.14e-20 | 63 |
| hsa0493217 | Breast | Precancer | Non-alcoholic fatty liver disease | 48/684 | 155/8465 | 6.16e-17 | 1.50e-15 | 1.15e-15 | 48 |
| hsa0472317 | Breast | Precancer | Retrograde endocannabinoid signaling | 25/684 | 148/8465 | 3.05e-04 | 2.47e-03 | 1.89e-03 | 25 |
| hsa0501224 | Breast | IDC | Parkinson disease | 107/867 | 266/8465 | 2.57e-39 | 8.36e-37 | 6.26e-37 | 107 |
| hsa0502023 | Breast | IDC | Prion disease | 102/867 | 273/8465 | 3.70e-34 | 4.01e-32 | 3.00e-32 | 102 |
| hsa0501623 | Breast | IDC | Huntington disease | 103/867 | 306/8465 | 5.14e-30 | 4.17e-28 | 3.12e-28 | 103 |
| hsa0019023 | Breast | IDC | Oxidative phosphorylation | 62/867 | 134/8465 | 4.78e-27 | 2.59e-25 | 1.94e-25 | 62 |
| hsa0501023 | Breast | IDC | Alzheimer disease | 107/867 | 384/8465 | 1.70e-23 | 7.88e-22 | 5.90e-22 | 107 |
| hsa0501423 | Breast | IDC | Amyotrophic lateral sclerosis | 102/867 | 364/8465 | 1.29e-22 | 5.22e-21 | 3.91e-21 | 102 |
| hsa0471424 | Breast | IDC | Thermogenesis | 75/867 | 232/8465 | 8.41e-21 | 3.04e-19 | 2.27e-19 | 75 |
| hsa0502223 | Breast | IDC | Pathways of neurodegeneration - multiple diseases | 116/867 | 476/8465 | 3.63e-20 | 1.18e-18 | 8.82e-19 | 116 |
| hsa0520824 | Breast | IDC | Chemical carcinogenesis - reactive oxygen species | 71/867 | 223/8465 | 2.55e-19 | 7.53e-18 | 5.63e-18 | 71 |
| hsa0541523 | Breast | IDC | Diabetic cardiomyopathy | 67/867 | 203/8465 | 3.17e-19 | 8.59e-18 | 6.43e-18 | 67 |
| hsa0493223 | Breast | IDC | Non-alcoholic fatty liver disease | 50/867 | 155/8465 | 3.48e-14 | 8.08e-13 | 6.05e-13 | 50 |
| hsa0472323 | Breast | IDC | Retrograde endocannabinoid signaling | 31/867 | 148/8465 | 7.62e-05 | 7.50e-04 | 5.61e-04 | 31 |
| hsa0501234 | Breast | IDC | Parkinson disease | 107/867 | 266/8465 | 2.57e-39 | 8.36e-37 | 6.26e-37 | 107 |
| hsa0502033 | Breast | IDC | Prion disease | 102/867 | 273/8465 | 3.70e-34 | 4.01e-32 | 3.00e-32 | 102 |
| hsa0501633 | Breast | IDC | Huntington disease | 103/867 | 306/8465 | 5.14e-30 | 4.17e-28 | 3.12e-28 | 103 |
| hsa0019033 | Breast | IDC | Oxidative phosphorylation | 62/867 | 134/8465 | 4.78e-27 | 2.59e-25 | 1.94e-25 | 62 |
| Page: 1 2 3 4 5 6 7 8 9 |
Top |
Cell-cell communication analysis |
| Identification of potential cell-cell interactions between two cell types and their ligand-receptor pairs for different disease states |
| Ligand | Receptor | LRpair | Pathway | Tissue | Disease Stage |
| Page: 1 |
Top |
Single-cell gene regulatory network inference analysis |
| Find out the significant the regulons (TFs) and the target genes of each regulon across cell types for different disease states |
| TF | Cell Type | Tissue | Disease Stage | Target Gene | RSS | Regulon Activity |
| ∗The dot plots of a searched regulon are shown for all cell subpopulations in each disease state of each tissue based on the regulon specific score inferred using pySCENIC and by calculating the average expression. |
| Page: 1 |
Top |
Somatic mutation of malignant transformation related genes |
| Annotation of somatic variants for genes involved in malignant transformation |
| Hugo Symbol | Variant Class | Variant Classification | dbSNP RS | HGVSc | HGVSp | HGVSp Short | SWISSPROT | BIOTYPE | SIFT | PolyPhen | Tumor Sample Barcode | Tissue | Histology | Sex | Age | Stage | Therapy Types | Drugs | Outcome |
| NDUFA4L2 | SNV | Missense_Mutation | c.22G>C | p.Ala8Pro | p.A8P | Q9NRX3 | protein_coding | tolerated(0.26) | benign(0.137) | TCGA-BH-A0EE-01 | Breast | breast invasive carcinoma | Female | >=65 | I/II | Chemotherapy | docetaxel | SD | |
| NDUFA4L2 | SNV | Missense_Mutation | c.261N>G | p.Phe87Leu | p.F87L | Q9NRX3 | protein_coding | deleterious(0.01) | probably_damaging(0.973) | TCGA-D8-A27G-01 | Breast | breast invasive carcinoma | Female | >=65 | I/II | Unknown | Unknown | SD | |
| NDUFA4L2 | SNV | Missense_Mutation | c.185N>C | p.Leu62Pro | p.L62P | Q9NRX3 | protein_coding | deleterious(0.03) | probably_damaging(0.998) | TCGA-D5-6540-01 | Colorectum | colon adenocarcinoma | Male | >=65 | I/II | Unknown | Unknown | SD | |
| NDUFA4L2 | SNV | Missense_Mutation | c.112T>A | p.Leu38Met | p.L38M | Q9NRX3 | protein_coding | deleterious(0.01) | probably_damaging(0.998) | TCGA-F4-6856-01 | Colorectum | colon adenocarcinoma | Male | <65 | I/II | Ancillary | leucovorin | CR | |
| NDUFA4L2 | SNV | Missense_Mutation | novel | c.131N>A | p.Arg44His | p.R44H | Q9NRX3 | protein_coding | tolerated(0.21) | possibly_damaging(0.652) | TCGA-B5-A11E-01 | Endometrium | uterine corpus endometrioid carcinoma | Female | <65 | I/II | Unknown | Unknown | SD |
| NDUFA4L2 | SNV | Missense_Mutation | rs372249235 | c.73G>A | p.Gly25Ser | p.G25S | Q9NRX3 | protein_coding | deleterious(0.05) | benign(0) | TCGA-BS-A0UV-01 | Endometrium | uterine corpus endometrioid carcinoma | Female | <65 | III/IV | Unknown | Unknown | SD |
| NDUFA4L2 | SNV | Missense_Mutation | novel | c.4N>A | p.Ala2Thr | p.A2T | Q9NRX3 | protein_coding | tolerated(0.17) | benign(0.124) | TCGA-SJ-A6ZI-01 | Endometrium | uterine corpus endometrioid carcinoma | Female | <65 | I/II | Unknown | Unknown | SD |
| NDUFA4L2 | SNV | Missense_Mutation | novel | c.94G>T | p.Gly32Cys | p.G32C | Q9NRX3 | protein_coding | tolerated(0.09) | benign(0.306) | TCGA-34-2604-01 | Lung | lung squamous cell carcinoma | Female | >=65 | I/II | Unknown | Unknown | SD |
| NDUFA4L2 | SNV | Missense_Mutation | novel | c.181N>G | p.Arg61Gly | p.R61G | Q9NRX3 | protein_coding | deleterious(0) | possibly_damaging(0.634) | TCGA-NC-A5HK-01 | Lung | lung squamous cell carcinoma | Female | <65 | I/II | Chemotherapy | cisplatin | CR |
| Page: 1 |
Top |
Related drugs of malignant transformation related genes |
| Identification of chemicals and drugs interact with genes involved in malignant transfromation |
| (DGIdb 4.0) |
| Entrez ID | Symbol | Category | Interaction Types | Drug Claim Name | Drug Name | PMIDs |
| 56901 | NDUFA4L2 | NA | inhibitor | CHEMBL3545135 | NV-128 | |
| 56901 | NDUFA4L2 | NA | inhibitor | CHEMBL1703 | METFORMIN HYDROCHLORIDE | |
| 56901 | NDUFA4L2 | NA | inhibitor | CHEMBL3545320 | ME-344 |
| Page: 1 |

Copyright 2023-Present -The University of Texas Health Science Center at Houston |