
|
|||||
|
 | |
| |
| |
| |
| |
| |
|
Gene: GYS1 |
Gene summary for GYS1 |
| Gene information | Species | Human | Gene symbol | GYS1 | Gene ID | 2997 |
| Gene name | glycogen synthase 1 | |
| Gene Alias | GSY | |
| Cytomap | 19q13.33 | |
| Gene Type | protein-coding | GO ID | GO:0000271 | UniProtAcc | P13807 |
Top |
Malignant transformation analysis |
| Identification of the aberrant gene expression in precancerous and cancerous lesions by comparing the gene expression of stem-like cells in diseased tissues with normal stem cells |
| Entrez ID | Symbol | Replicates | Species | Organ | Tissue | Adj P-value | Log2FC | Malignancy |
| 2997 | GYS1 | LZE4T | Human | Esophagus | ESCC | 3.18e-07 | 2.29e-01 | 0.0811 |
| 2997 | GYS1 | LZE7T | Human | Esophagus | ESCC | 9.09e-03 | 1.44e-01 | 0.0667 |
| 2997 | GYS1 | LZE8T | Human | Esophagus | ESCC | 8.81e-03 | 1.46e-01 | 0.067 |
| 2997 | GYS1 | LZE24T | Human | Esophagus | ESCC | 3.53e-03 | 1.59e-01 | 0.0596 |
| 2997 | GYS1 | P1T-E | Human | Esophagus | ESCC | 4.88e-08 | 3.49e-01 | 0.0875 |
| 2997 | GYS1 | P2T-E | Human | Esophagus | ESCC | 1.15e-15 | 1.67e-01 | 0.1177 |
| 2997 | GYS1 | P4T-E | Human | Esophagus | ESCC | 3.77e-13 | 2.89e-01 | 0.1323 |
| 2997 | GYS1 | P5T-E | Human | Esophagus | ESCC | 5.44e-07 | 1.27e-01 | 0.1327 |
| 2997 | GYS1 | P8T-E | Human | Esophagus | ESCC | 2.62e-18 | 3.76e-01 | 0.0889 |
| 2997 | GYS1 | P9T-E | Human | Esophagus | ESCC | 1.17e-02 | 5.46e-02 | 0.1131 |
| 2997 | GYS1 | P10T-E | Human | Esophagus | ESCC | 1.59e-14 | 2.47e-01 | 0.116 |
| 2997 | GYS1 | P11T-E | Human | Esophagus | ESCC | 8.47e-07 | 3.17e-01 | 0.1426 |
| 2997 | GYS1 | P12T-E | Human | Esophagus | ESCC | 3.41e-16 | 1.41e-01 | 0.1122 |
| 2997 | GYS1 | P15T-E | Human | Esophagus | ESCC | 4.18e-15 | 2.98e-01 | 0.1149 |
| 2997 | GYS1 | P16T-E | Human | Esophagus | ESCC | 2.98e-07 | 1.36e-01 | 0.1153 |
| 2997 | GYS1 | P17T-E | Human | Esophagus | ESCC | 4.38e-07 | 2.67e-01 | 0.1278 |
| 2997 | GYS1 | P20T-E | Human | Esophagus | ESCC | 1.56e-07 | 1.45e-01 | 0.1124 |
| 2997 | GYS1 | P21T-E | Human | Esophagus | ESCC | 4.73e-23 | 3.02e-01 | 0.1617 |
| 2997 | GYS1 | P22T-E | Human | Esophagus | ESCC | 3.90e-14 | 2.96e-01 | 0.1236 |
| 2997 | GYS1 | P23T-E | Human | Esophagus | ESCC | 1.19e-08 | 1.53e-01 | 0.108 |
| Page: 1 2 3 4 |
| Tissue | Expression Dynamics | Abbreviation |
| Esophagus | 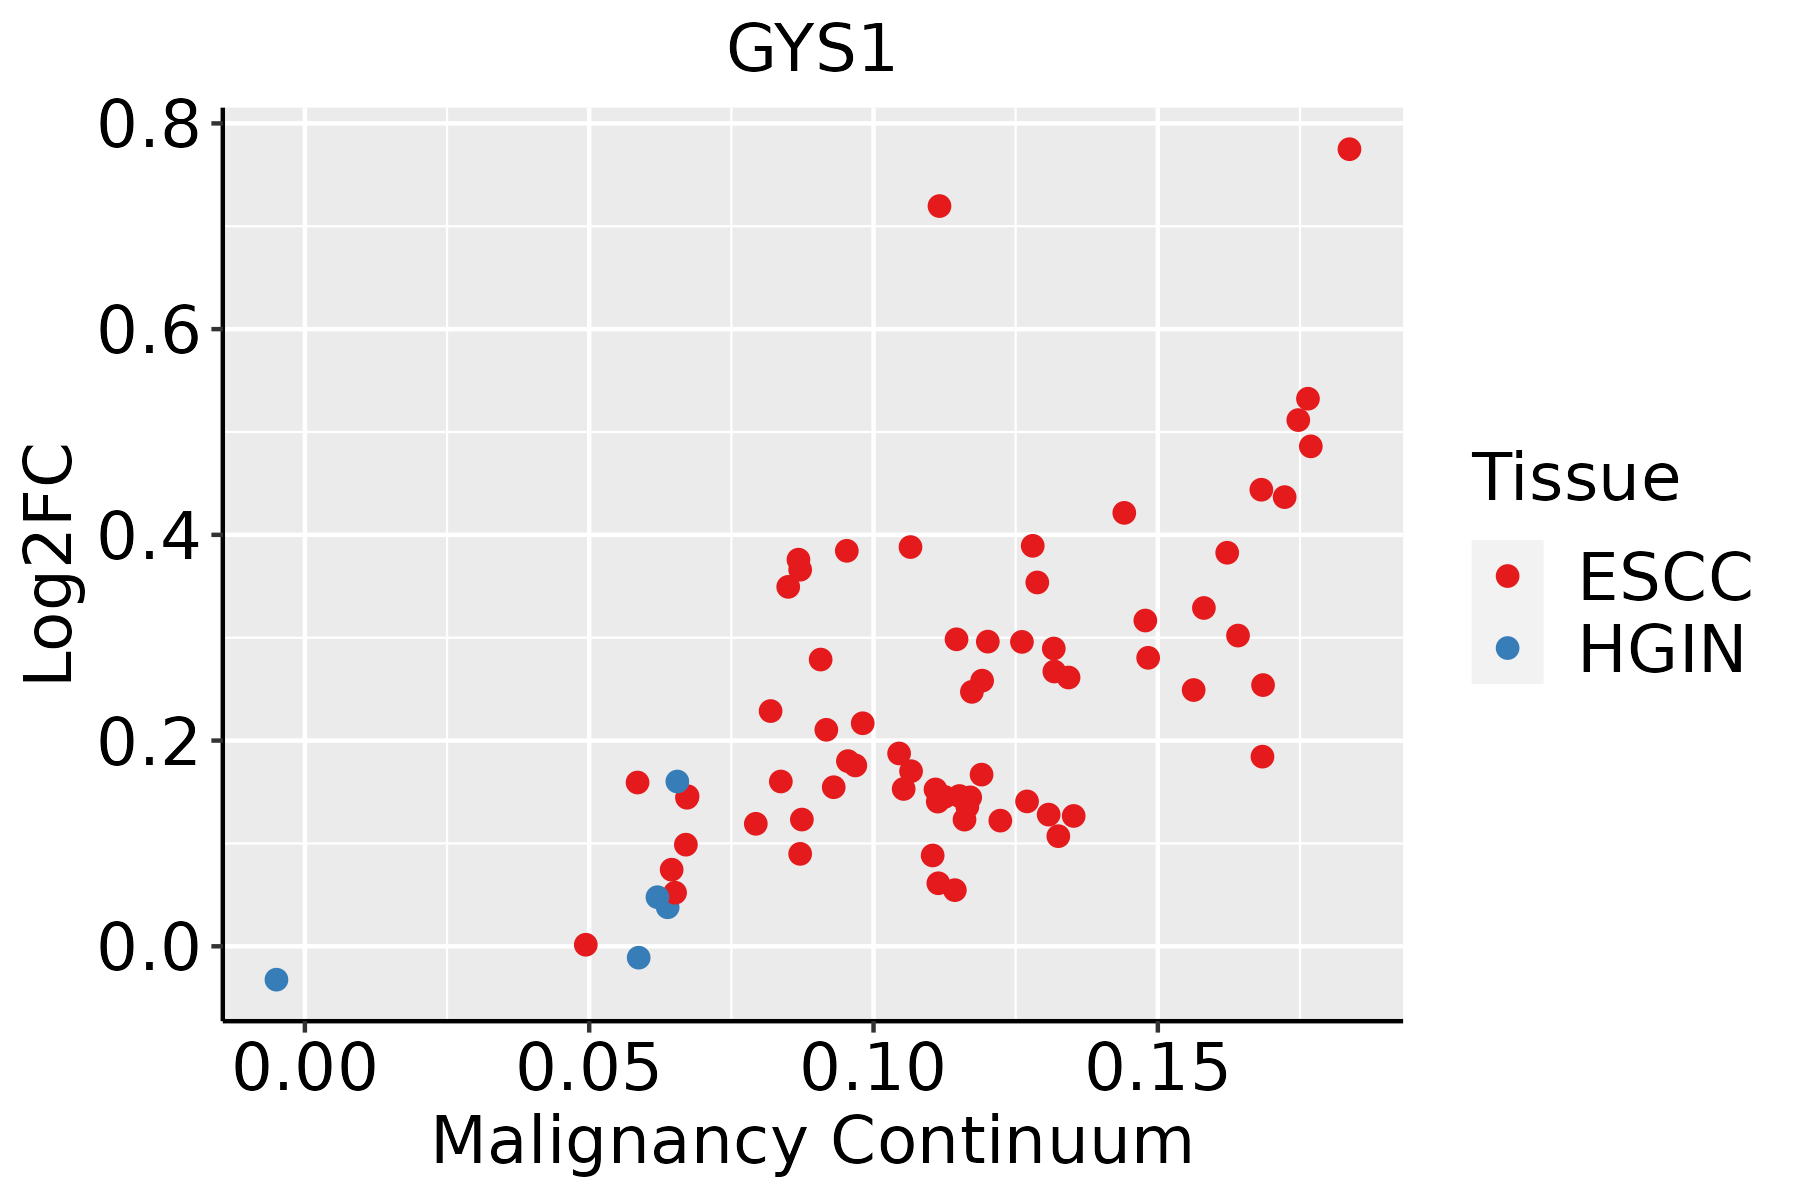 | ESCC: Esophageal squamous cell carcinoma |
| HGIN: High-grade intraepithelial neoplasias | ||
| LGIN: Low-grade intraepithelial neoplasias | ||
| Oral Cavity | 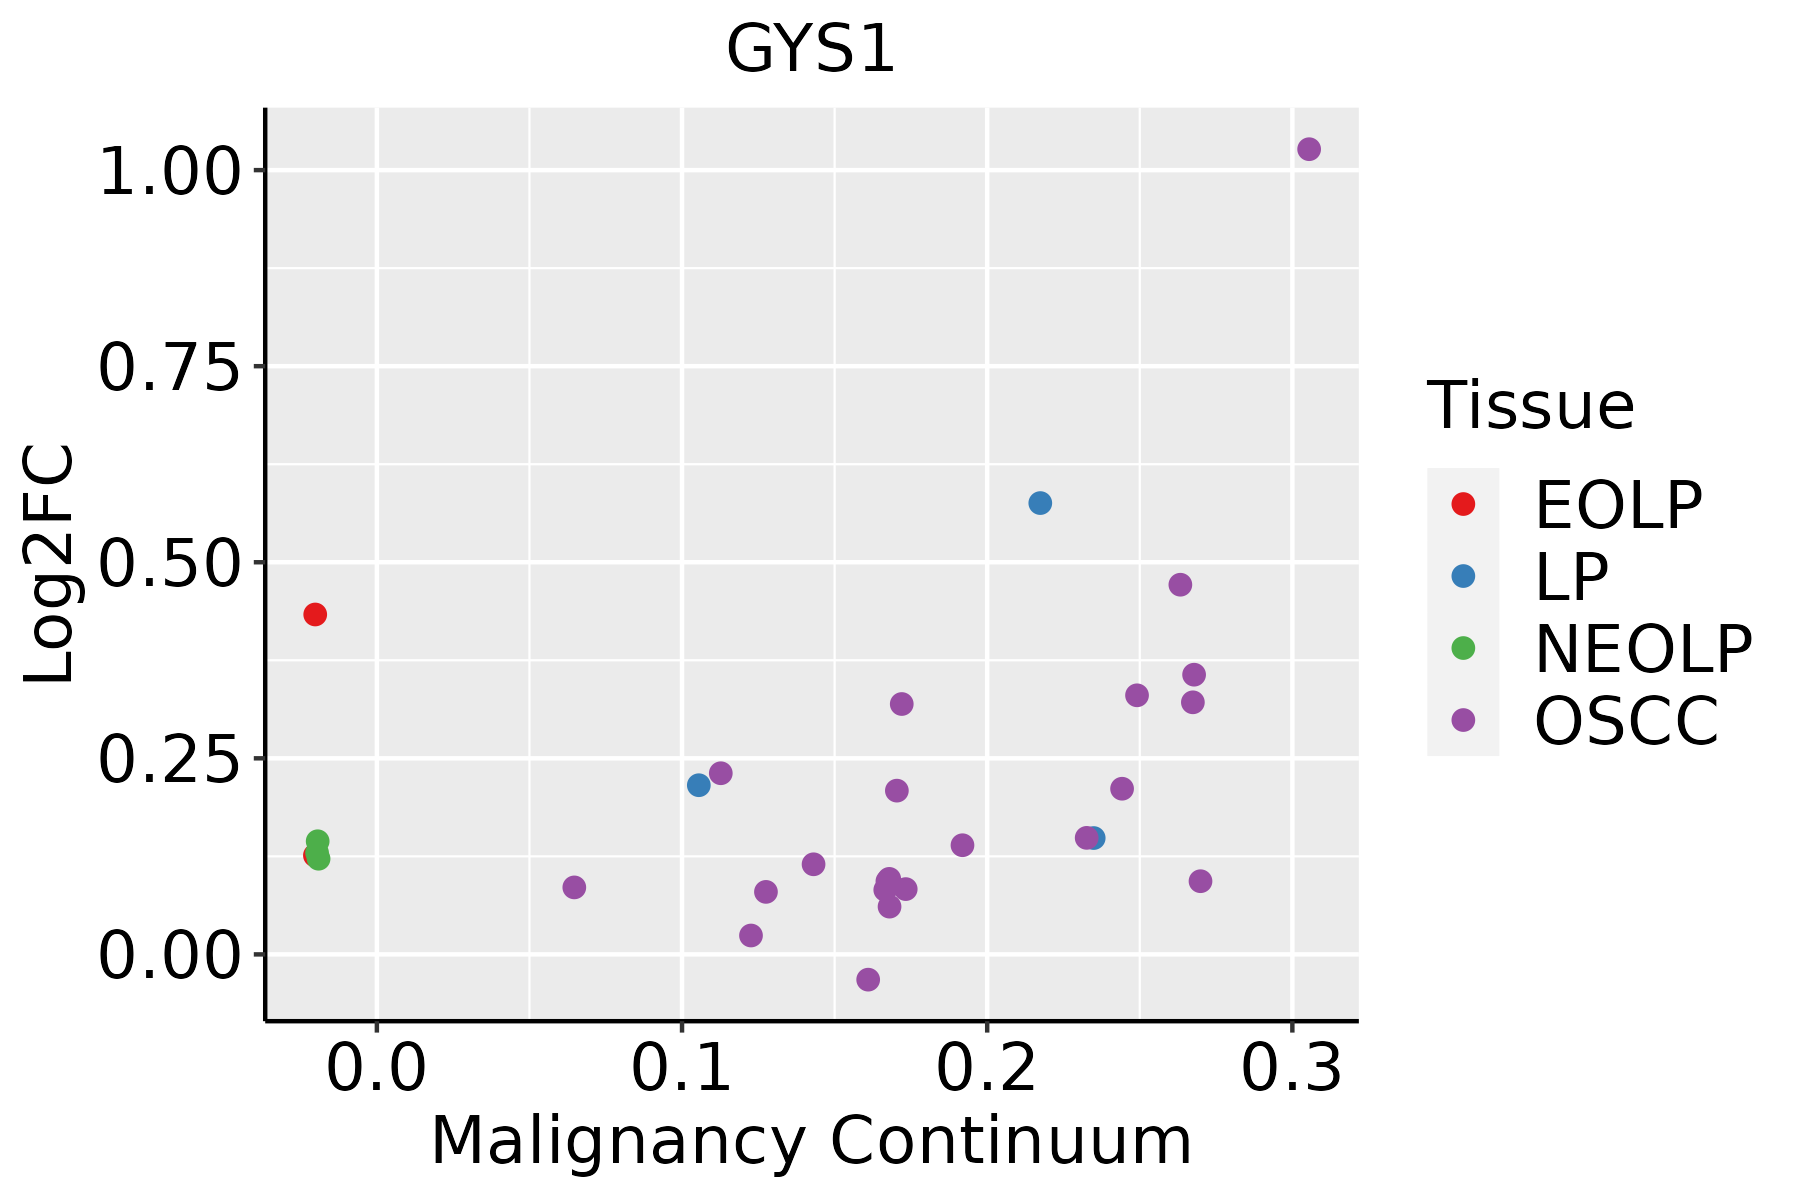 | EOLP: Erosive Oral lichen planus |
| LP: leukoplakia | ||
| NEOLP: Non-erosive oral lichen planus | ||
| OSCC: Oral squamous cell carcinoma |
| ∗log2FC in expression of this searched gene in stem-like cells from each diseased tissue sample relative to stem-like cells in normal samples in each tissue plotted against the malignancy continuum. Samples are colored based on if they are from different disease stage. |
Top |
Malignant transformation related pathway analysis |
| Find out the enriched GO biological processes and KEGG pathways involved in transition from healthy to precancer to cancer |
| Tissue | Disease Stage | Enriched GO biological Processes |
| Colorectum | AD |  |
| Colorectum | SER |  |
| Colorectum | MSS |  |
| Colorectum | MSI-H |  |
| Colorectum | FAP |  |
| ∗Top 15 enriched GO BP terms are showed in the bar plot of each disease state in each tissue. Each row represents a significant GO biological process which is colored according to the -log10(p.adjust). |
| Page: 1 2 3 4 5 6 7 8 9 |
| GO ID | Tissue | Disease Stage | Description | Gene Ratio | Bg Ratio | pvalue | p.adjust | Count |
| GO:0006091110 | Esophagus | ESCC | generation of precursor metabolites and energy | 331/8552 | 490/18723 | 3.86e-23 | 8.45e-21 | 331 |
| GO:0015980110 | Esophagus | ESCC | energy derivation by oxidation of organic compounds | 220/8552 | 318/18723 | 1.20e-17 | 1.09e-15 | 220 |
| GO:00442626 | Esophagus | ESCC | cellular carbohydrate metabolic process | 160/8552 | 283/18723 | 1.43e-04 | 9.66e-04 | 160 |
| GO:00160514 | Esophagus | ESCC | carbohydrate biosynthetic process | 117/8552 | 202/18723 | 2.96e-04 | 1.79e-03 | 117 |
| GO:00346372 | Esophagus | ESCC | cellular carbohydrate biosynthetic process | 46/8552 | 78/18723 | 1.24e-02 | 4.13e-02 | 46 |
| GO:000609118 | Oral cavity | OSCC | generation of precursor metabolites and energy | 286/7305 | 490/18723 | 1.45e-18 | 1.71e-16 | 286 |
| GO:001598018 | Oral cavity | OSCC | energy derivation by oxidation of organic compounds | 190/7305 | 318/18723 | 4.10e-14 | 2.26e-12 | 190 |
| GO:00160513 | Oral cavity | OSCC | carbohydrate biosynthetic process | 97/7305 | 202/18723 | 5.50e-03 | 2.13e-02 | 97 |
| GO:00442625 | Oral cavity | OSCC | cellular carbohydrate metabolic process | 130/7305 | 283/18723 | 9.98e-03 | 3.49e-02 | 130 |
| GO:000609119 | Oral cavity | LP | generation of precursor metabolites and energy | 214/4623 | 490/18723 | 1.12e-20 | 2.60e-18 | 214 |
| GO:001598019 | Oral cavity | LP | energy derivation by oxidation of organic compounds | 145/4623 | 318/18723 | 2.44e-16 | 3.64e-14 | 145 |
| GO:000609125 | Oral cavity | EOLP | generation of precursor metabolites and energy | 79/2218 | 490/18723 | 2.65e-03 | 1.59e-02 | 79 |
| GO:001598025 | Oral cavity | EOLP | energy derivation by oxidation of organic compounds | 54/2218 | 318/18723 | 4.02e-03 | 2.23e-02 | 54 |
| Page: 1 |
| Pathway ID | Tissue | Disease Stage | Description | Gene Ratio | Bg Ratio | pvalue | p.adjust | qvalue | Count |
| hsa0415212 | Oral cavity | OSCC | AMPK signaling pathway | 71/3704 | 121/8465 | 6.29e-04 | 1.86e-03 | 9.49e-04 | 71 |
| hsa0493112 | Oral cavity | OSCC | Insulin resistance | 60/3704 | 108/8465 | 8.66e-03 | 1.97e-02 | 1.00e-02 | 60 |
| hsa05415210 | Oral cavity | LP | Diabetic cardiomyopathy | 106/2418 | 203/8465 | 6.51e-13 | 1.36e-11 | 8.74e-12 | 106 |
| hsa0541537 | Oral cavity | LP | Diabetic cardiomyopathy | 106/2418 | 203/8465 | 6.51e-13 | 1.36e-11 | 8.74e-12 | 106 |
| hsa0541545 | Oral cavity | EOLP | Diabetic cardiomyopathy | 64/1218 | 203/8465 | 2.48e-10 | 1.00e-08 | 5.91e-09 | 64 |
| hsa0415123 | Oral cavity | EOLP | PI3K-Akt signaling pathway | 73/1218 | 354/8465 | 7.03e-04 | 2.69e-03 | 1.59e-03 | 73 |
| hsa0491023 | Oral cavity | EOLP | Insulin signaling pathway | 33/1218 | 137/8465 | 1.61e-03 | 5.60e-03 | 3.30e-03 | 33 |
| hsa0493122 | Oral cavity | EOLP | Insulin resistance | 25/1218 | 108/8465 | 9.53e-03 | 2.63e-02 | 1.55e-02 | 25 |
| hsa0541555 | Oral cavity | EOLP | Diabetic cardiomyopathy | 64/1218 | 203/8465 | 2.48e-10 | 1.00e-08 | 5.91e-09 | 64 |
| hsa0415133 | Oral cavity | EOLP | PI3K-Akt signaling pathway | 73/1218 | 354/8465 | 7.03e-04 | 2.69e-03 | 1.59e-03 | 73 |
| hsa0491033 | Oral cavity | EOLP | Insulin signaling pathway | 33/1218 | 137/8465 | 1.61e-03 | 5.60e-03 | 3.30e-03 | 33 |
| hsa0493132 | Oral cavity | EOLP | Insulin resistance | 25/1218 | 108/8465 | 9.53e-03 | 2.63e-02 | 1.55e-02 | 25 |
| Page: 1 2 |
Top |
Cell-cell communication analysis |
| Identification of potential cell-cell interactions between two cell types and their ligand-receptor pairs for different disease states |
| Ligand | Receptor | LRpair | Pathway | Tissue | Disease Stage |
| Page: 1 |
Top |
Single-cell gene regulatory network inference analysis |
| Find out the significant the regulons (TFs) and the target genes of each regulon across cell types for different disease states |
| TF | Cell Type | Tissue | Disease Stage | Target Gene | RSS | Regulon Activity |
| ∗The dot plots of a searched regulon are shown for all cell subpopulations in each disease state of each tissue based on the regulon specific score inferred using pySCENIC and by calculating the average expression. |
| Page: 1 |
Top |
Somatic mutation of malignant transformation related genes |
| Annotation of somatic variants for genes involved in malignant transformation |
| Hugo Symbol | Variant Class | Variant Classification | dbSNP RS | HGVSc | HGVSp | HGVSp Short | SWISSPROT | BIOTYPE | SIFT | PolyPhen | Tumor Sample Barcode | Tissue | Histology | Sex | Age | Stage | Therapy Types | Drugs | Outcome |
| GYS1 | SNV | Missense_Mutation | c.419G>A | p.Gly140Glu | p.G140E | P13807 | protein_coding | tolerated(0.15) | probably_damaging(0.968) | TCGA-A2-A0CK-01 | Breast | breast invasive carcinoma | Female | <65 | III/IV | Chemotherapy | taxotere | CR | |
| GYS1 | SNV | Missense_Mutation | c.1296N>G | p.Ile432Met | p.I432M | P13807 | protein_coding | tolerated(0.11) | possibly_damaging(0.815) | TCGA-A8-A06X-01 | Breast | breast invasive carcinoma | Female | >=65 | I/II | Unknown | Unknown | SD | |
| GYS1 | SNV | Missense_Mutation | rs774914573 | c.1385N>A | p.Arg462Gln | p.R462Q | P13807 | protein_coding | deleterious(0.05) | probably_damaging(0.999) | TCGA-AN-A046-01 | Breast | breast invasive carcinoma | Female | >=65 | I/II | Unknown | Unknown | SD |
| GYS1 | SNV | Missense_Mutation | novel | c.437G>A | p.Arg146His | p.R146H | P13807 | protein_coding | tolerated(0.46) | probably_damaging(0.956) | TCGA-B6-A3ZX-01 | Breast | breast invasive carcinoma | Female | <65 | III/IV | Chemotherapy | cyclophosphamide | PD |
| GYS1 | SNV | Missense_Mutation | rs560070875 | c.575N>A | p.Arg192His | p.R192H | P13807 | protein_coding | deleterious(0) | probably_damaging(1) | TCGA-BH-A0B9-01 | Breast | breast invasive carcinoma | Female | <65 | I/II | Chemotherapy | cyclophosphamide | SD |
| GYS1 | SNV | Missense_Mutation | c.451N>A | p.Ala151Thr | p.A151T | P13807 | protein_coding | tolerated(0.27) | possibly_damaging(0.558) | TCGA-BH-A0HA-01 | Breast | breast invasive carcinoma | Female | <65 | I/II | Unknown | Unknown | SD | |
| GYS1 | SNV | Missense_Mutation | c.2090C>T | p.Ala697Val | p.A697V | P13807 | protein_coding | tolerated_low_confidence(0.38) | benign(0.007) | TCGA-BH-A0HL-01 | Breast | breast invasive carcinoma | Female | <65 | I/II | Chemotherapy | cyclophosphamide | SD | |
| GYS1 | SNV | Missense_Mutation | rs781563966 | c.178N>A | p.Asp60Asn | p.D60N | P13807 | protein_coding | deleterious(0.05) | possibly_damaging(0.815) | TCGA-C8-A1HM-01 | Breast | breast invasive carcinoma | Female | >=65 | I/II | Chemotherapy | doxorubicin | CR |
| GYS1 | insertion | Nonsense_Mutation | novel | c.588_589insGGCAACATGGTGAAACCCCATCTCTACAAAAAATACAAAAATTAGC | p.Pro197GlyfsTer15 | p.P197Gfs*15 | P13807 | protein_coding | TCGA-A2-A0CP-01 | Breast | breast invasive carcinoma | Female | <65 | I/II | Chemotherapy | cytoxan | SD | ||
| GYS1 | insertion | Frame_Shift_Ins | novel | c.942-1_942insCCAGGCATGGTGGCTCACACGTGTAGTCCCA | p.His315GlnfsTer29 | p.H315Qfs*29 | P13807 | protein_coding | TCGA-A8-A08H-01 | Breast | breast invasive carcinoma | Female | >=65 | I/II | Unknown | Unknown | SD |
| Page: 1 2 3 4 5 6 7 8 |
Top |
Related drugs of malignant transformation related genes |
| Identification of chemicals and drugs interact with genes involved in malignant transfromation |
| (DGIdb 4.0) |
| Entrez ID | Symbol | Category | Interaction Types | Drug Claim Name | Drug Name | PMIDs |
| Page: 1 |

Copyright 2023-Present -The University of Texas Health Science Center at Houston |