
|
|||||
|
 | |
| |
| |
| |
| |
| |
|
Gene: COX14 |
Gene summary for COX14 |
| Gene information | Species | Human | Gene symbol | COX14 | Gene ID | 84987 |
| Gene name | cytochrome c oxidase assembly factor COX14 | |
| Gene Alias | C12orf62 | |
| Cytomap | 12q13.12 | |
| Gene Type | protein-coding | GO ID | GO:0006996 | UniProtAcc | Q96I36 |
Top |
Malignant transformation analysis |
| Identification of the aberrant gene expression in precancerous and cancerous lesions by comparing the gene expression of stem-like cells in diseased tissues with normal stem cells |
| Entrez ID | Symbol | Replicates | Species | Organ | Tissue | Adj P-value | Log2FC | Malignancy |
| 84987 | COX14 | CA_HPV_1 | Human | Cervix | CC | 8.95e-04 | -5.77e-02 | 0.0264 |
| 84987 | COX14 | CCI_1 | Human | Cervix | CC | 3.85e-08 | -5.39e-01 | 0.528 |
| 84987 | COX14 | CCI_2 | Human | Cervix | CC | 2.08e-07 | -5.39e-01 | 0.5249 |
| 84987 | COX14 | CCI_3 | Human | Cervix | CC | 1.69e-08 | -5.24e-01 | 0.516 |
| 84987 | COX14 | CCII_1 | Human | Cervix | CC | 1.35e-15 | -5.39e-01 | 0.3249 |
| 84987 | COX14 | HTA11_3410_2000001011 | Human | Colorectum | AD | 4.55e-09 | 2.03e-01 | 0.0155 |
| 84987 | COX14 | HTA11_2487_2000001011 | Human | Colorectum | SER | 2.31e-21 | 4.98e-01 | -0.1808 |
| 84987 | COX14 | HTA11_2951_2000001011 | Human | Colorectum | AD | 3.34e-04 | 2.52e-01 | 0.0216 |
| 84987 | COX14 | HTA11_1938_2000001011 | Human | Colorectum | AD | 1.06e-19 | 5.08e-01 | -0.0811 |
| 84987 | COX14 | HTA11_78_2000001011 | Human | Colorectum | AD | 2.20e-05 | 1.68e-01 | -0.1088 |
| 84987 | COX14 | HTA11_347_2000001011 | Human | Colorectum | AD | 1.94e-23 | 4.34e-01 | -0.1954 |
| 84987 | COX14 | HTA11_411_2000001011 | Human | Colorectum | SER | 1.35e-12 | 6.61e-01 | -0.2602 |
| 84987 | COX14 | HTA11_2112_2000001011 | Human | Colorectum | SER | 1.50e-04 | 2.76e-01 | -0.2196 |
| 84987 | COX14 | HTA11_3361_2000001011 | Human | Colorectum | AD | 8.67e-12 | 3.89e-01 | -0.1207 |
| 84987 | COX14 | HTA11_83_2000001011 | Human | Colorectum | SER | 2.45e-18 | 6.36e-01 | -0.1526 |
| 84987 | COX14 | HTA11_696_2000001011 | Human | Colorectum | AD | 3.45e-30 | 5.20e-01 | -0.1464 |
| 84987 | COX14 | HTA11_866_2000001011 | Human | Colorectum | AD | 1.75e-18 | 4.22e-01 | -0.1001 |
| 84987 | COX14 | HTA11_1391_2000001011 | Human | Colorectum | AD | 5.57e-29 | 7.02e-01 | -0.059 |
| 84987 | COX14 | HTA11_2992_2000001011 | Human | Colorectum | SER | 2.54e-11 | 4.65e-01 | -0.1706 |
| 84987 | COX14 | HTA11_5212_2000001011 | Human | Colorectum | AD | 1.21e-08 | 4.02e-01 | -0.2061 |
| Page: 1 2 3 4 5 6 7 8 9 10 11 |
| Tissue | Expression Dynamics | Abbreviation |
| Cervix | 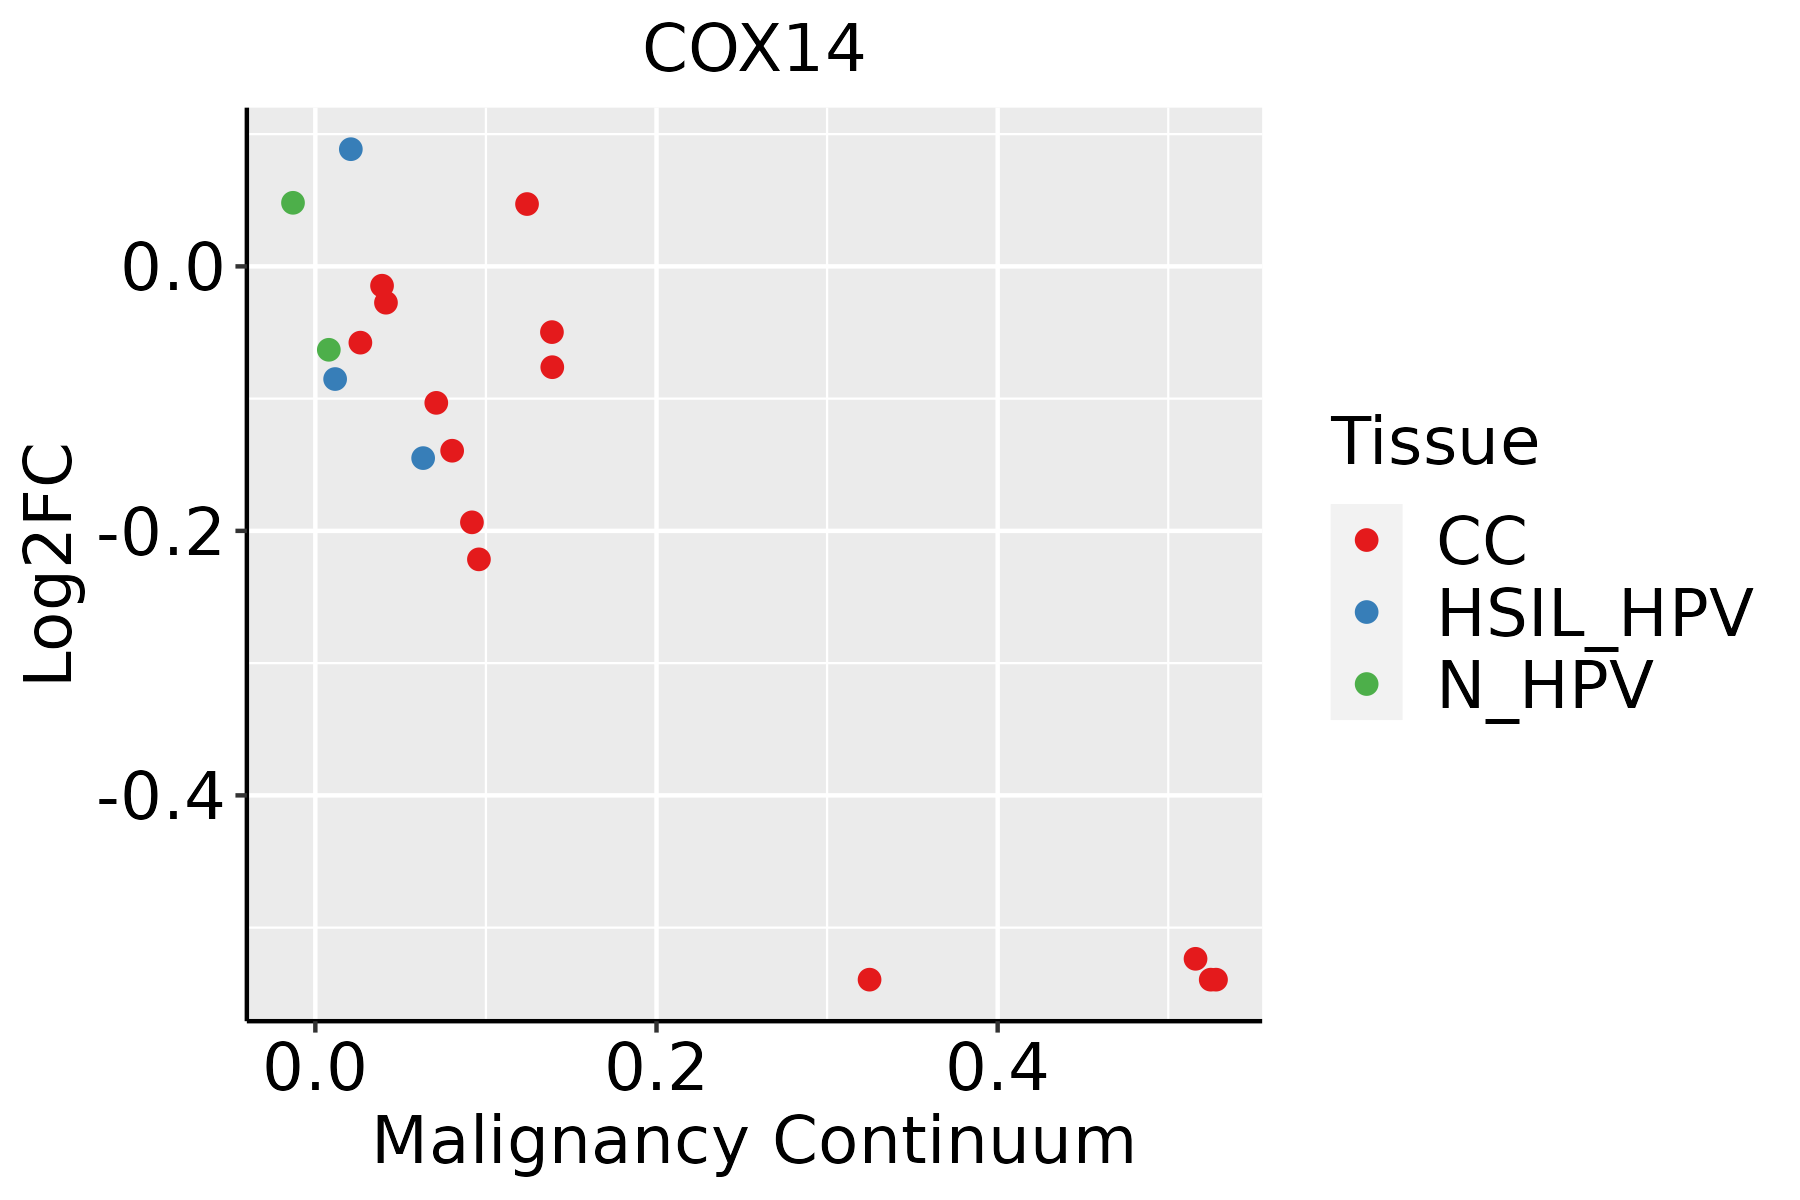 | CC: Cervix cancer |
| HSIL_HPV: HPV-infected high-grade squamous intraepithelial lesions | ||
| N_HPV: HPV-infected normal cervix | ||
| Colorectum (GSE201348) |  | FAP: Familial adenomatous polyposis |
| CRC: Colorectal cancer | ||
| Colorectum (HTA11) | 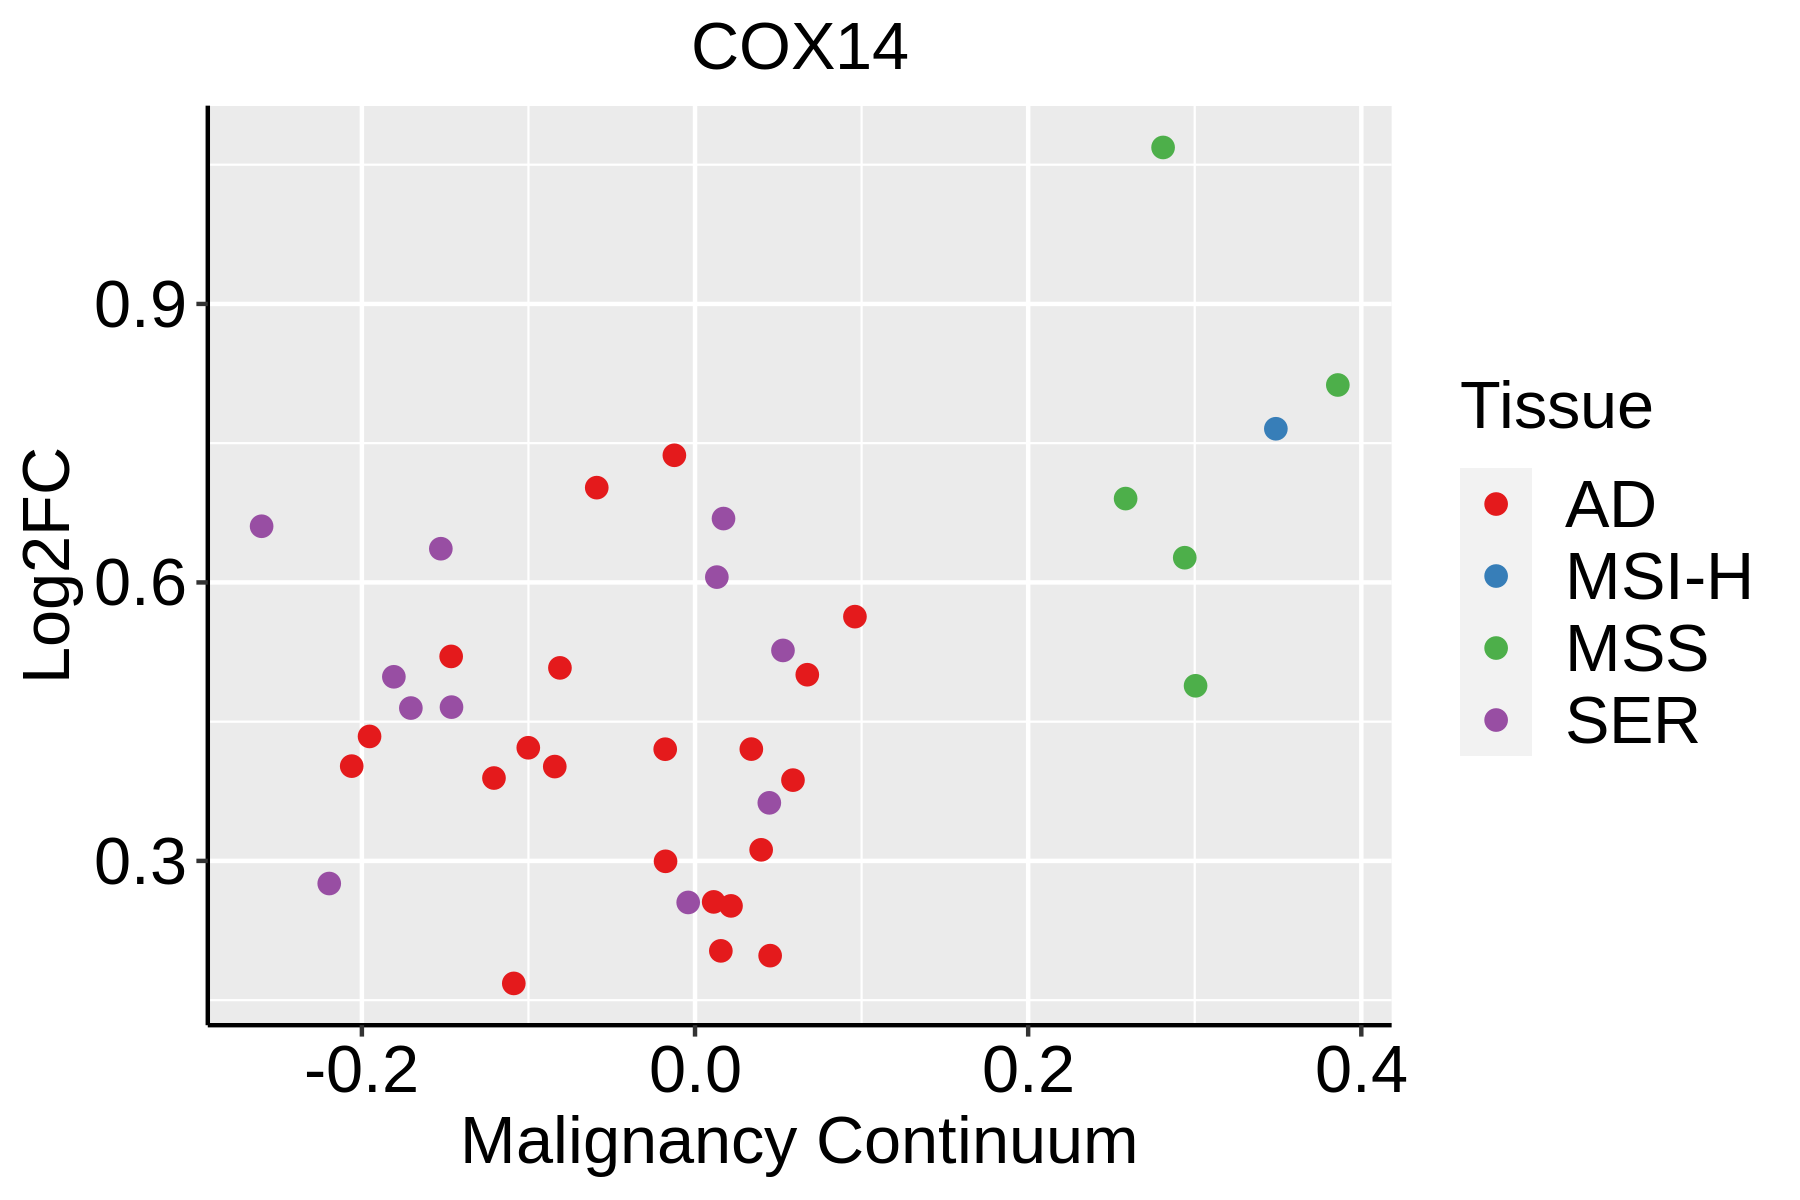 | AD: Adenomas |
| SER: Sessile serrated lesions | ||
| MSI-H: Microsatellite-high colorectal cancer | ||
| MSS: Microsatellite stable colorectal cancer | ||
| Endometrium | 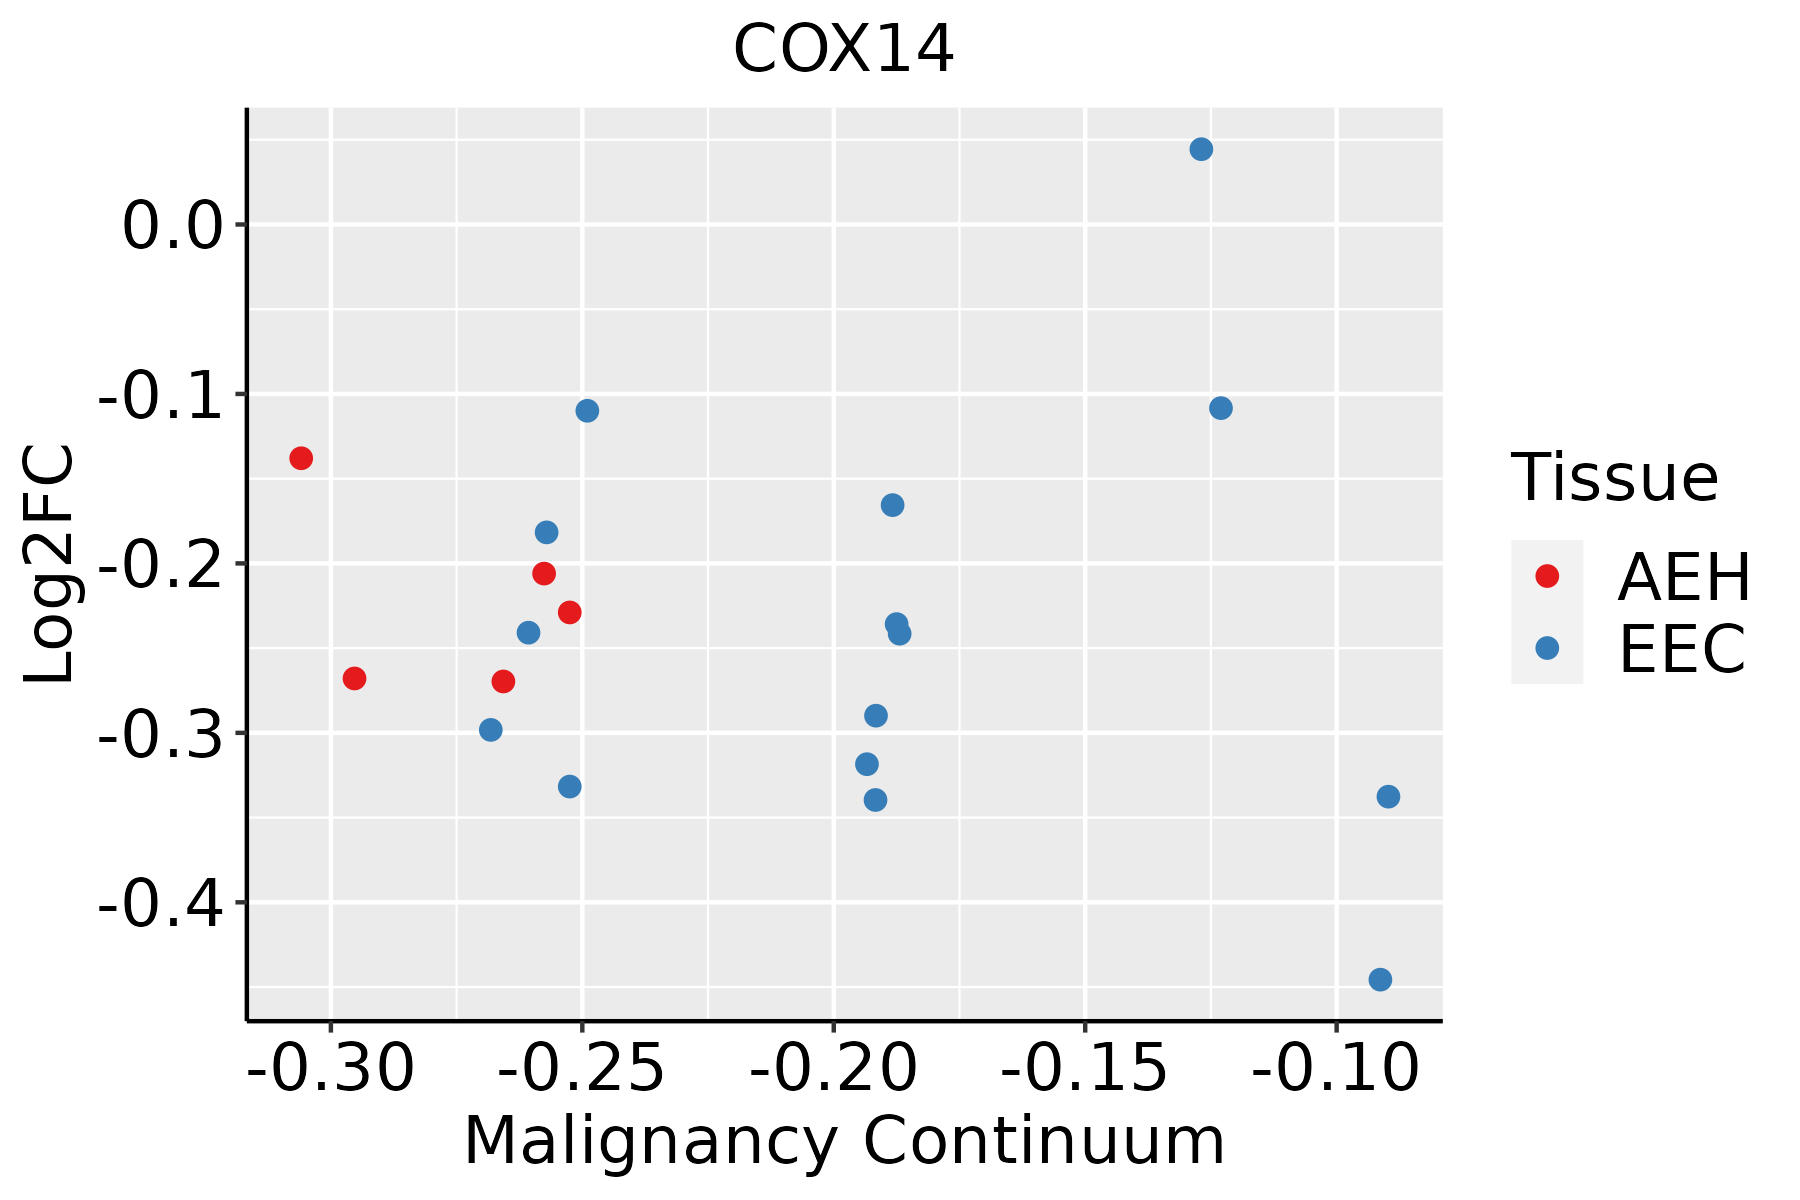 | AEH: Atypical endometrial hyperplasia |
| EEC: Endometrioid Cancer | ||
| Esophagus |  | ESCC: Esophageal squamous cell carcinoma |
| HGIN: High-grade intraepithelial neoplasias | ||
| LGIN: Low-grade intraepithelial neoplasias | ||
| Liver | 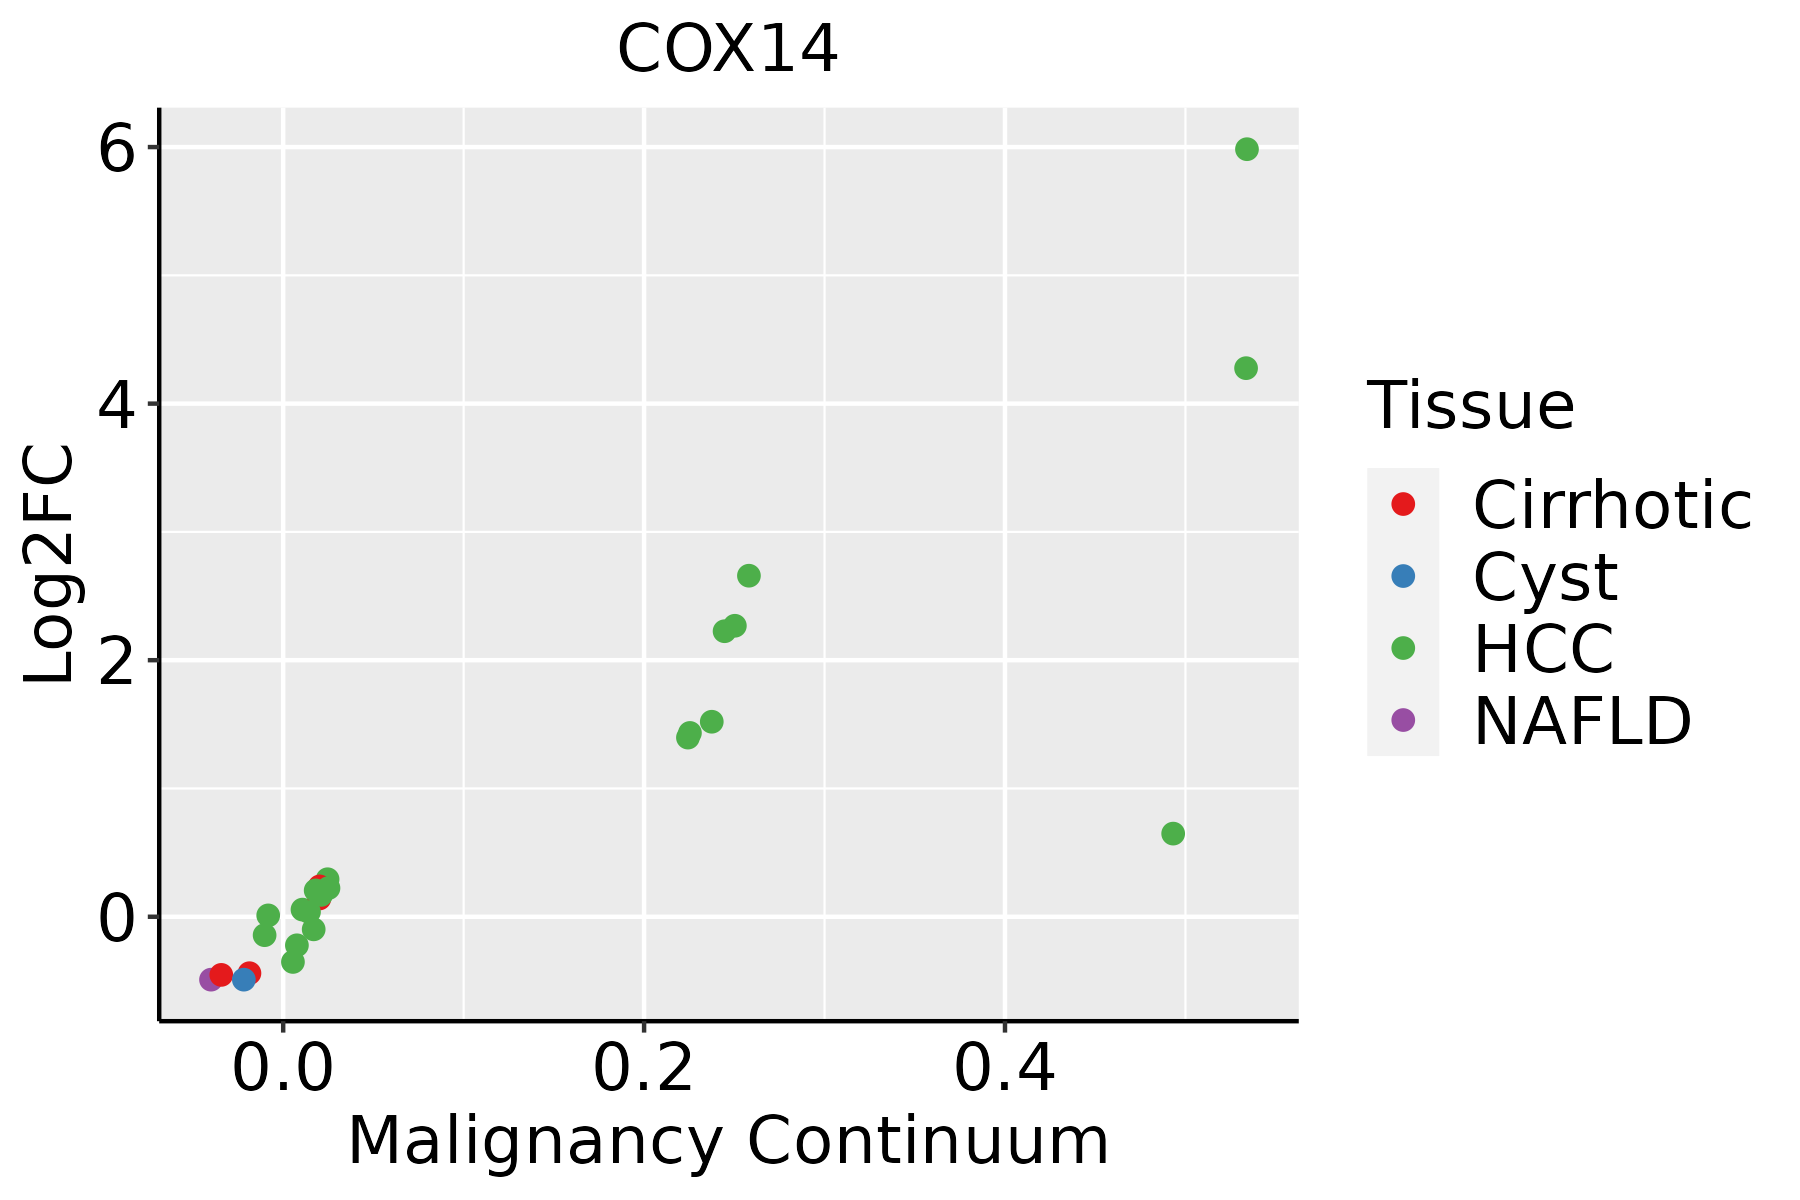 | HCC: Hepatocellular carcinoma |
| NAFLD: Non-alcoholic fatty liver disease | ||
| Oral Cavity | 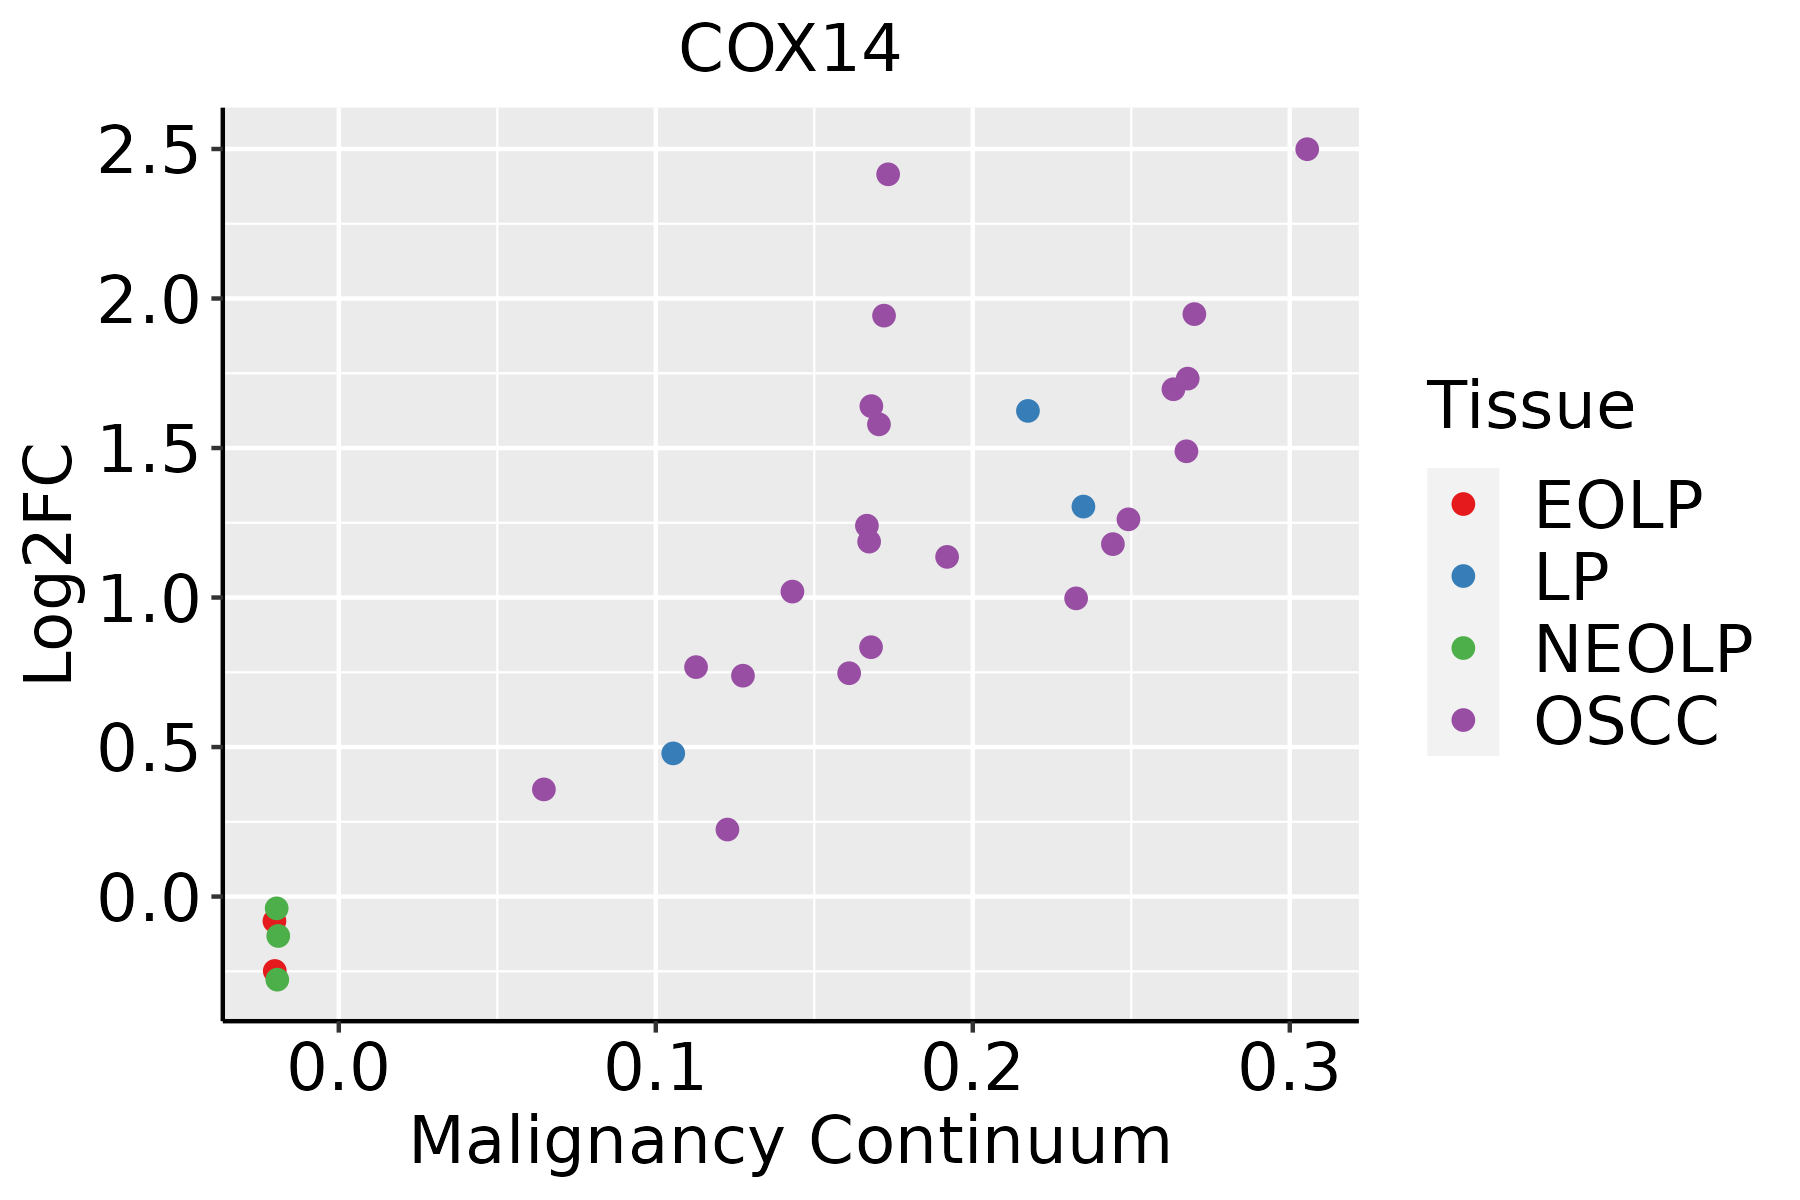 | EOLP: Erosive Oral lichen planus |
| LP: leukoplakia | ||
| NEOLP: Non-erosive oral lichen planus | ||
| OSCC: Oral squamous cell carcinoma | ||
| Prostate | 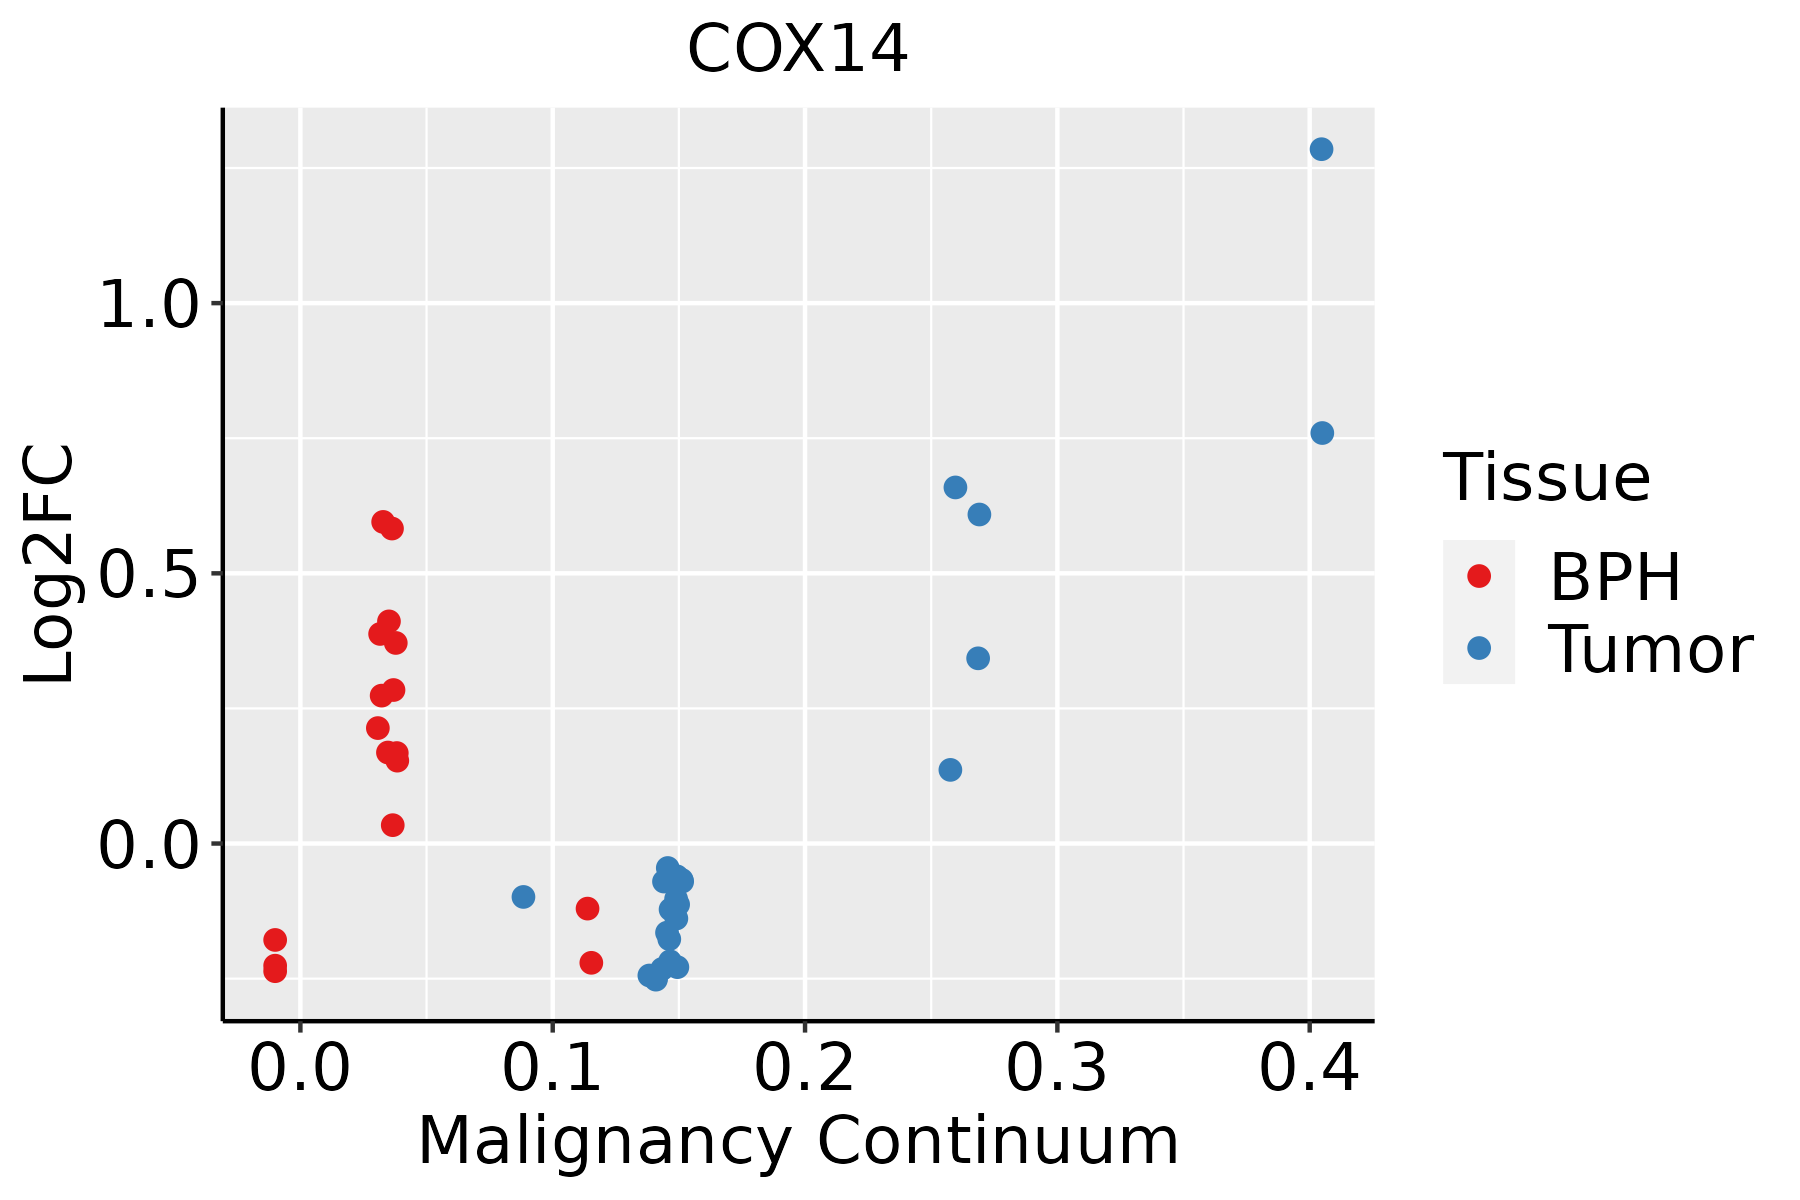 | BPH: Benign Prostatic Hyperplasia |
| Skin |  | AK: Actinic keratosis |
| cSCC: Cutaneous squamous cell carcinoma | ||
| SCCIS:squamous cell carcinoma in situ | ||
| Thyroid | 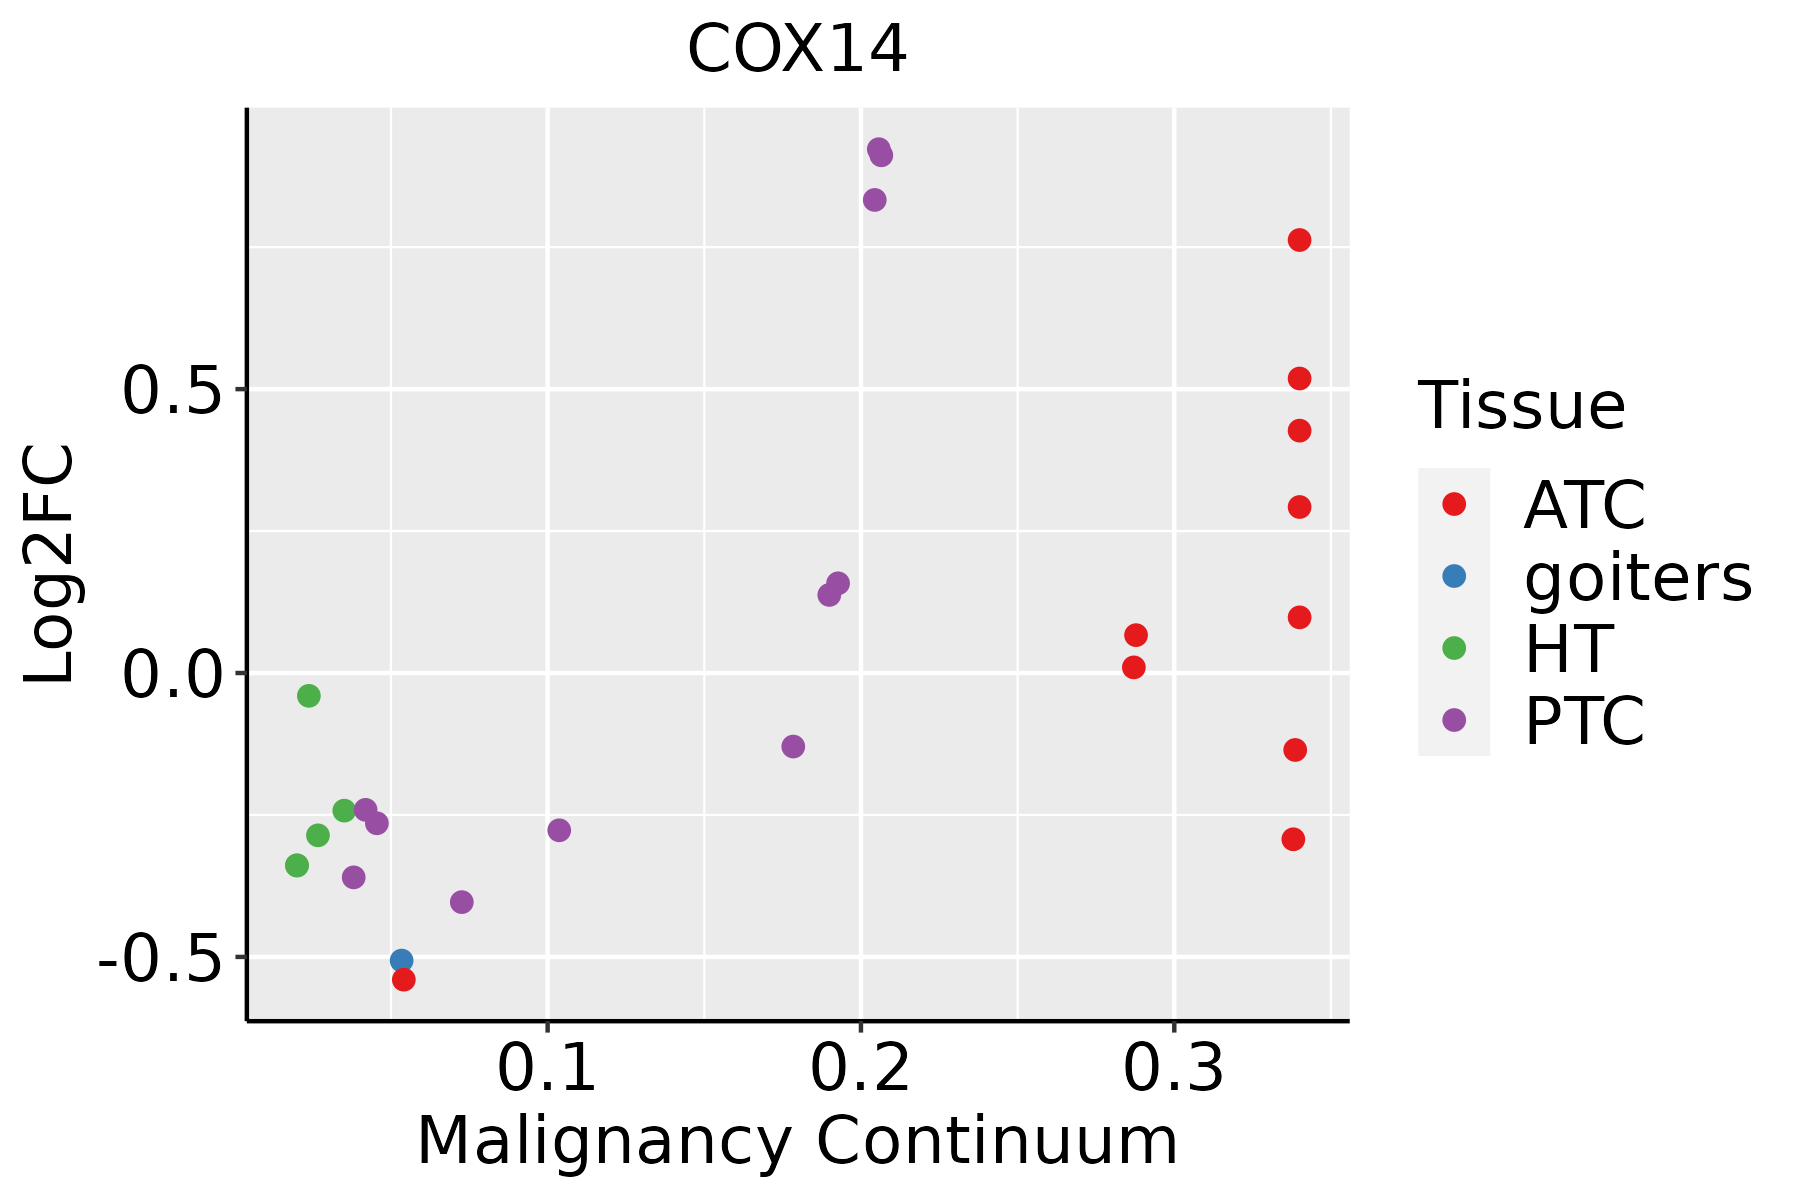 | ATC: Anaplastic thyroid cancer |
| HT: Hashimoto's thyroiditis | ||
| PTC: Papillary thyroid cancer |
| ∗log2FC in expression of this searched gene in stem-like cells from each diseased tissue sample relative to stem-like cells in normal samples in each tissue plotted against the malignancy continuum. Samples are colored based on if they are from different disease stage. |
Top |
Malignant transformation related pathway analysis |
| Find out the enriched GO biological processes and KEGG pathways involved in transition from healthy to precancer to cancer |
| Tissue | Disease Stage | Enriched GO biological Processes |
| Colorectum | AD |  |
| Colorectum | SER |  |
| Colorectum | MSS |  |
| Colorectum | MSI-H |  |
| Colorectum | FAP |  |
| ∗Top 15 enriched GO BP terms are showed in the bar plot of each disease state in each tissue. Each row represents a significant GO biological process which is colored according to the -log10(p.adjust). |
| Page: 1 2 3 4 5 6 7 8 9 |
| GO ID | Tissue | Disease Stage | Description | Gene Ratio | Bg Ratio | pvalue | p.adjust | Count |
| GO:00331089 | Cervix | CC | mitochondrial respiratory chain complex assembly | 26/2311 | 93/18723 | 3.97e-05 | 6.18e-04 | 26 |
| GO:0033108 | Colorectum | AD | mitochondrial respiratory chain complex assembly | 46/3918 | 93/18723 | 8.95e-10 | 6.91e-08 | 46 |
| GO:00331081 | Colorectum | SER | mitochondrial respiratory chain complex assembly | 39/2897 | 93/18723 | 8.13e-10 | 8.74e-08 | 39 |
| GO:00331082 | Colorectum | MSS | mitochondrial respiratory chain complex assembly | 44/3467 | 93/18723 | 2.17e-10 | 2.09e-08 | 44 |
| GO:00331083 | Colorectum | MSI-H | mitochondrial respiratory chain complex assembly | 30/1319 | 93/18723 | 5.71e-13 | 1.27e-10 | 30 |
| GO:003310810 | Endometrium | AEH | mitochondrial respiratory chain complex assembly | 30/2100 | 93/18723 | 4.63e-08 | 2.50e-06 | 30 |
| GO:003310815 | Endometrium | EEC | mitochondrial respiratory chain complex assembly | 31/2168 | 93/18723 | 2.46e-08 | 1.45e-06 | 31 |
| GO:003310820 | Esophagus | HGIN | mitochondrial respiratory chain complex assembly | 47/2587 | 93/18723 | 3.15e-17 | 8.60e-15 | 47 |
| GO:00170044 | Esophagus | HGIN | cytochrome complex assembly | 18/2587 | 36/18723 | 2.39e-07 | 1.14e-05 | 18 |
| GO:00336173 | Esophagus | HGIN | mitochondrial cytochrome c oxidase assembly | 13/2587 | 22/18723 | 9.51e-07 | 3.80e-05 | 13 |
| GO:00085353 | Esophagus | HGIN | respiratory chain complex IV assembly | 14/2587 | 26/18723 | 1.68e-06 | 6.29e-05 | 14 |
| GO:0033108110 | Esophagus | ESCC | mitochondrial respiratory chain complex assembly | 83/8552 | 93/18723 | 9.56e-19 | 1.05e-16 | 83 |
| GO:001700413 | Esophagus | ESCC | cytochrome complex assembly | 34/8552 | 36/18723 | 5.08e-10 | 1.31e-08 | 34 |
| GO:000853512 | Esophagus | ESCC | respiratory chain complex IV assembly | 24/8552 | 26/18723 | 6.87e-07 | 8.99e-06 | 24 |
| GO:003361712 | Esophagus | ESCC | mitochondrial cytochrome c oxidase assembly | 21/8552 | 22/18723 | 8.75e-07 | 1.13e-05 | 21 |
| GO:00331087 | Liver | Cirrhotic | mitochondrial respiratory chain complex assembly | 64/4634 | 93/18723 | 3.85e-19 | 7.79e-17 | 64 |
| GO:0017004 | Liver | Cirrhotic | cytochrome complex assembly | 22/4634 | 36/18723 | 3.92e-06 | 6.70e-05 | 22 |
| GO:0033617 | Liver | Cirrhotic | mitochondrial cytochrome c oxidase assembly | 14/4634 | 22/18723 | 1.27e-04 | 1.25e-03 | 14 |
| GO:0008535 | Liver | Cirrhotic | respiratory chain complex IV assembly | 15/4634 | 26/18723 | 3.43e-04 | 2.93e-03 | 15 |
| GO:003310812 | Liver | HCC | mitochondrial respiratory chain complex assembly | 80/7958 | 93/18723 | 3.47e-18 | 4.15e-16 | 80 |
| Page: 1 2 3 |
| Pathway ID | Tissue | Disease Stage | Description | Gene Ratio | Bg Ratio | pvalue | p.adjust | qvalue | Count |
| hsa0471422 | Liver | HCC | Thermogenesis | 170/4020 | 232/8465 | 5.36e-16 | 2.25e-14 | 1.25e-14 | 170 |
| hsa0471432 | Liver | HCC | Thermogenesis | 170/4020 | 232/8465 | 5.36e-16 | 2.25e-14 | 1.25e-14 | 170 |
| hsa0471430 | Oral cavity | OSCC | Thermogenesis | 138/3704 | 232/8465 | 7.67e-07 | 4.35e-06 | 2.22e-06 | 138 |
| hsa04714113 | Oral cavity | OSCC | Thermogenesis | 138/3704 | 232/8465 | 7.67e-07 | 4.35e-06 | 2.22e-06 | 138 |
| hsa04714210 | Oral cavity | LP | Thermogenesis | 105/2418 | 232/8465 | 3.14e-08 | 4.98e-07 | 3.21e-07 | 105 |
| hsa0471438 | Oral cavity | LP | Thermogenesis | 105/2418 | 232/8465 | 3.14e-08 | 4.98e-07 | 3.21e-07 | 105 |
| hsa0471462 | Oral cavity | NEOLP | Thermogenesis | 56/1112 | 232/8465 | 2.86e-06 | 2.75e-05 | 1.73e-05 | 56 |
| hsa0471472 | Oral cavity | NEOLP | Thermogenesis | 56/1112 | 232/8465 | 2.86e-06 | 2.75e-05 | 1.73e-05 | 56 |
| hsa0471428 | Prostate | BPH | Thermogenesis | 110/1718 | 232/8465 | 5.16e-21 | 1.42e-19 | 8.78e-20 | 110 |
| hsa04714112 | Prostate | BPH | Thermogenesis | 110/1718 | 232/8465 | 5.16e-21 | 1.42e-19 | 8.78e-20 | 110 |
| hsa0471429 | Prostate | Tumor | Thermogenesis | 110/1791 | 232/8465 | 1.56e-19 | 3.96e-18 | 2.46e-18 | 110 |
| hsa0471437 | Prostate | Tumor | Thermogenesis | 110/1791 | 232/8465 | 1.56e-19 | 3.96e-18 | 2.46e-18 | 110 |
| Page: 1 2 |
Top |
Cell-cell communication analysis |
| Identification of potential cell-cell interactions between two cell types and their ligand-receptor pairs for different disease states |
| Ligand | Receptor | LRpair | Pathway | Tissue | Disease Stage |
| Page: 1 |
Top |
Single-cell gene regulatory network inference analysis |
| Find out the significant the regulons (TFs) and the target genes of each regulon across cell types for different disease states |
| TF | Cell Type | Tissue | Disease Stage | Target Gene | RSS | Regulon Activity |
| ∗The dot plots of a searched regulon are shown for all cell subpopulations in each disease state of each tissue based on the regulon specific score inferred using pySCENIC and by calculating the average expression. |
| Page: 1 |
Top |
Somatic mutation of malignant transformation related genes |
| Annotation of somatic variants for genes involved in malignant transformation |
| Hugo Symbol | Variant Class | Variant Classification | dbSNP RS | HGVSc | HGVSp | HGVSp Short | SWISSPROT | BIOTYPE | SIFT | PolyPhen | Tumor Sample Barcode | Tissue | Histology | Sex | Age | Stage | Therapy Types | Drugs | Outcome |
| COX14 | SNV | Missense_Mutation | rs368516862 | c.98N>A | p.Arg33Gln | p.R33Q | Q96I36 | protein_coding | tolerated(0.07) | possibly_damaging(0.572) | TCGA-T2-A6X2-01 | Oral cavity | head & neck squamous cell carcinoma | Male | >=65 | III/IV | Unknown | Unknown | SD |
| Page: 1 |
Top |
Related drugs of malignant transformation related genes |
| Identification of chemicals and drugs interact with genes involved in malignant transfromation |
| (DGIdb 4.0) |
| Entrez ID | Symbol | Category | Interaction Types | Drug Claim Name | Drug Name | PMIDs |
| Page: 1 |

Copyright 2023-Present -The University of Texas Health Science Center at Houston |