
|
|||||
|
 | |
| |
| |
| |
| |
| |
|
Gene: NFKB1 |
Gene summary for NFKB1 |
| Gene information | Species | Human | Gene symbol | NFKB1 | Gene ID | 4790 |
| Gene name | nuclear factor kappa B subunit 1 | |
| Gene Alias | CVID12 | |
| Cytomap | 4q24 | |
| Gene Type | protein-coding | GO ID | GO:0000122 | UniProtAcc | A0A024RDJ4 |
Top |
Malignant transformation analysis |
| Identification of the aberrant gene expression in precancerous and cancerous lesions by comparing the gene expression of stem-like cells in diseased tissues with normal stem cells |
| Entrez ID | Symbol | Replicates | Species | Organ | Tissue | Adj P-value | Log2FC | Malignancy |
| 4790 | NFKB1 | HTA11_347_2000001011 | Human | Colorectum | AD | 1.56e-05 | 3.93e-01 | -0.1954 |
| 4790 | NFKB1 | HTA11_99999974143_84620 | Human | Colorectum | MSS | 1.05e-03 | -2.30e-01 | 0.3005 |
| 4790 | NFKB1 | A002-C-010 | Human | Colorectum | FAP | 1.80e-03 | -1.58e-01 | 0.242 |
| 4790 | NFKB1 | A015-C-203 | Human | Colorectum | FAP | 3.63e-28 | -4.81e-01 | -0.1294 |
| 4790 | NFKB1 | A015-C-204 | Human | Colorectum | FAP | 4.98e-04 | -3.20e-01 | -0.0228 |
| 4790 | NFKB1 | A002-C-201 | Human | Colorectum | FAP | 2.60e-10 | -4.05e-01 | 0.0324 |
| 4790 | NFKB1 | A002-C-203 | Human | Colorectum | FAP | 1.46e-05 | -2.57e-01 | 0.2786 |
| 4790 | NFKB1 | A001-C-119 | Human | Colorectum | FAP | 6.04e-10 | -5.20e-01 | -0.1557 |
| 4790 | NFKB1 | A001-C-108 | Human | Colorectum | FAP | 3.76e-19 | -3.60e-01 | -0.0272 |
| 4790 | NFKB1 | A002-C-205 | Human | Colorectum | FAP | 4.11e-18 | -5.38e-01 | -0.1236 |
| 4790 | NFKB1 | A001-C-104 | Human | Colorectum | FAP | 2.68e-06 | -3.20e-01 | 0.0184 |
| 4790 | NFKB1 | A015-C-005 | Human | Colorectum | FAP | 6.18e-03 | -3.03e-01 | -0.0336 |
| 4790 | NFKB1 | A015-C-006 | Human | Colorectum | FAP | 4.79e-14 | -5.61e-01 | -0.0994 |
| 4790 | NFKB1 | A015-C-106 | Human | Colorectum | FAP | 5.44e-10 | -3.39e-01 | -0.0511 |
| 4790 | NFKB1 | A002-C-114 | Human | Colorectum | FAP | 2.35e-15 | -5.09e-01 | -0.1561 |
| 4790 | NFKB1 | A015-C-104 | Human | Colorectum | FAP | 9.64e-31 | -5.06e-01 | -0.1899 |
| 4790 | NFKB1 | A001-C-014 | Human | Colorectum | FAP | 6.13e-18 | -3.68e-01 | 0.0135 |
| 4790 | NFKB1 | A002-C-016 | Human | Colorectum | FAP | 1.34e-24 | -4.35e-01 | 0.0521 |
| 4790 | NFKB1 | A015-C-002 | Human | Colorectum | FAP | 9.49e-11 | -5.36e-01 | -0.0763 |
| 4790 | NFKB1 | A001-C-007 | Human | Colorectum | CRC | 2.34e-06 | -5.98e-01 | 0.1899 |
| Page: 1 2 3 4 5 6 7 8 9 10 |
| Tissue | Expression Dynamics | Abbreviation |
| Colorectum (GSE201348) |  | FAP: Familial adenomatous polyposis |
| CRC: Colorectal cancer | ||
| Colorectum (HTA11) |  | AD: Adenomas |
| SER: Sessile serrated lesions | ||
| MSI-H: Microsatellite-high colorectal cancer | ||
| MSS: Microsatellite stable colorectal cancer | ||
| Endometrium | 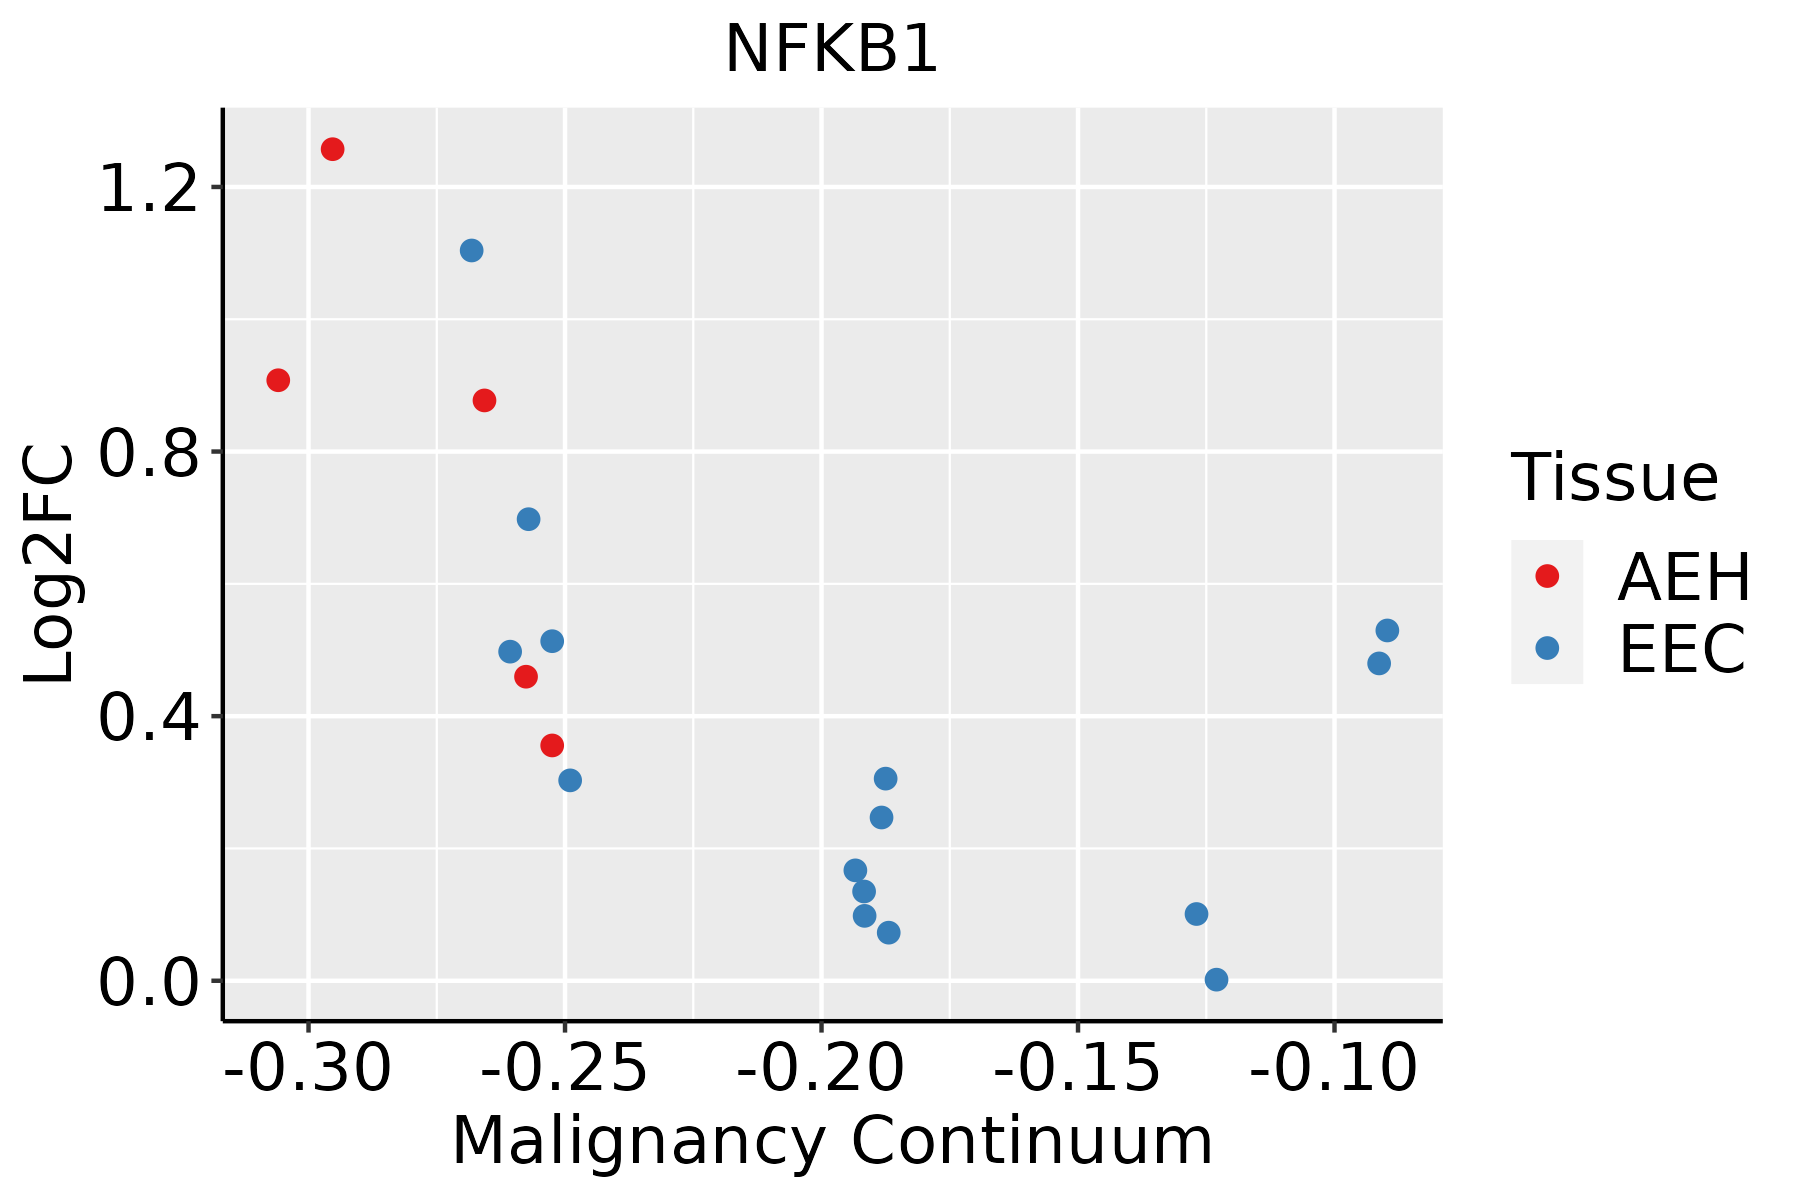 | AEH: Atypical endometrial hyperplasia |
| EEC: Endometrioid Cancer | ||
| Esophagus | 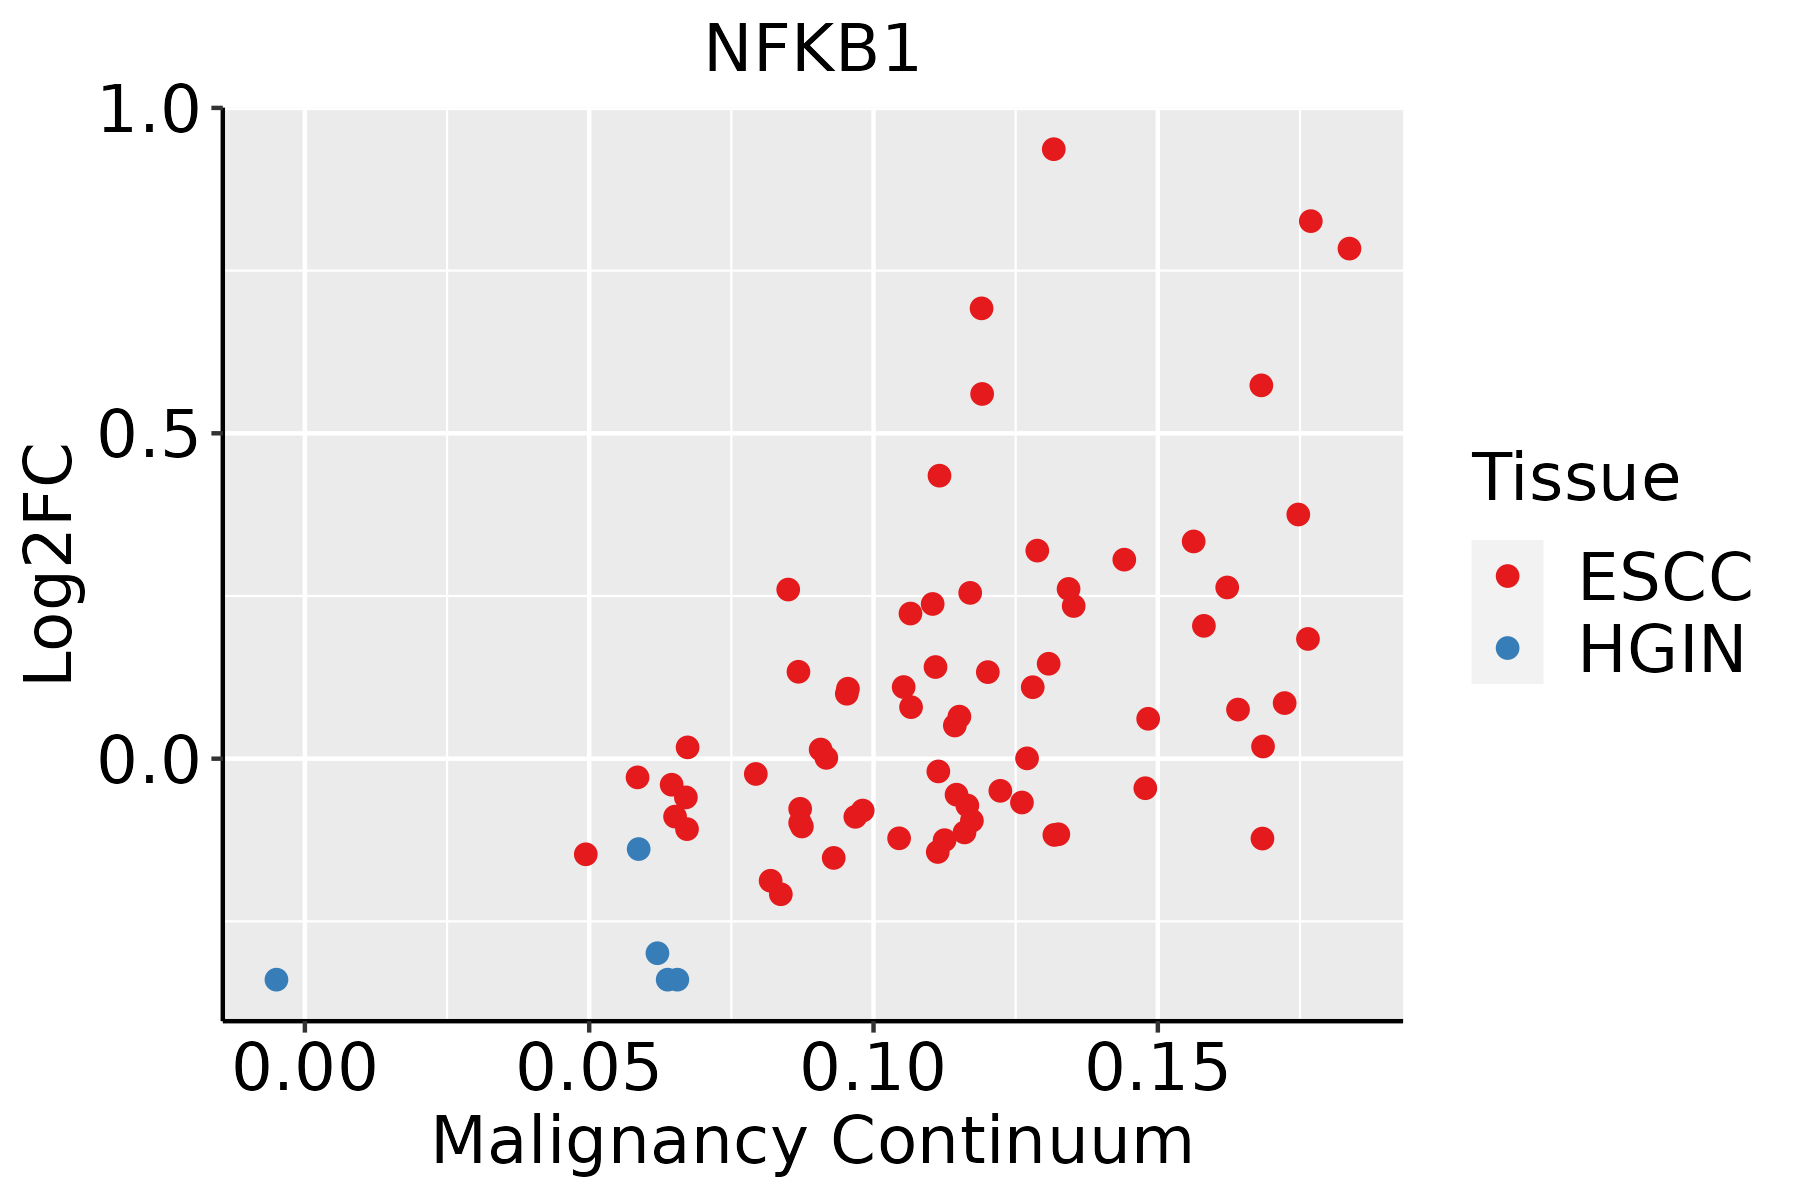 | ESCC: Esophageal squamous cell carcinoma |
| HGIN: High-grade intraepithelial neoplasias | ||
| LGIN: Low-grade intraepithelial neoplasias | ||
| Liver | 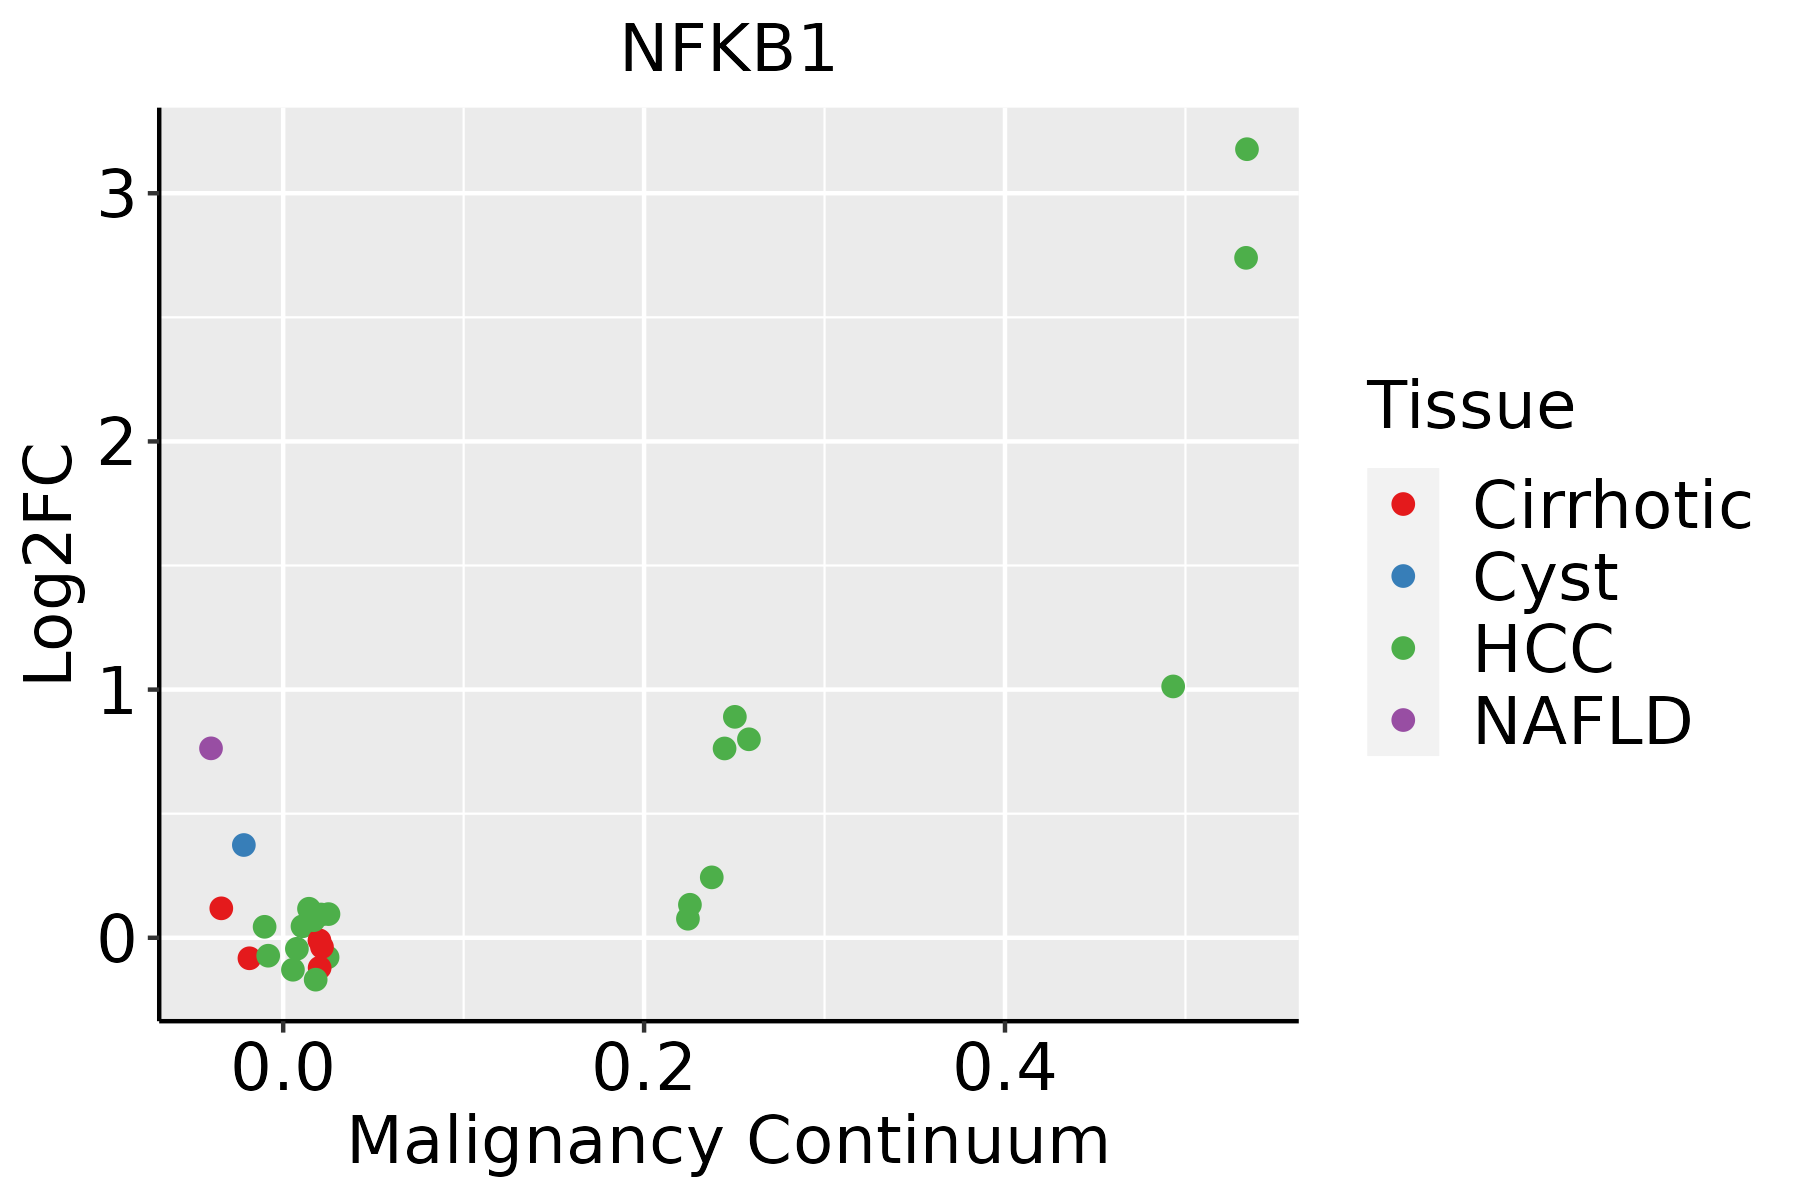 | HCC: Hepatocellular carcinoma |
| NAFLD: Non-alcoholic fatty liver disease | ||
| Lung |  | AAH: Atypical adenomatous hyperplasia |
| AIS: Adenocarcinoma in situ | ||
| IAC: Invasive lung adenocarcinoma | ||
| MIA: Minimally invasive adenocarcinoma | ||
| Oral Cavity | 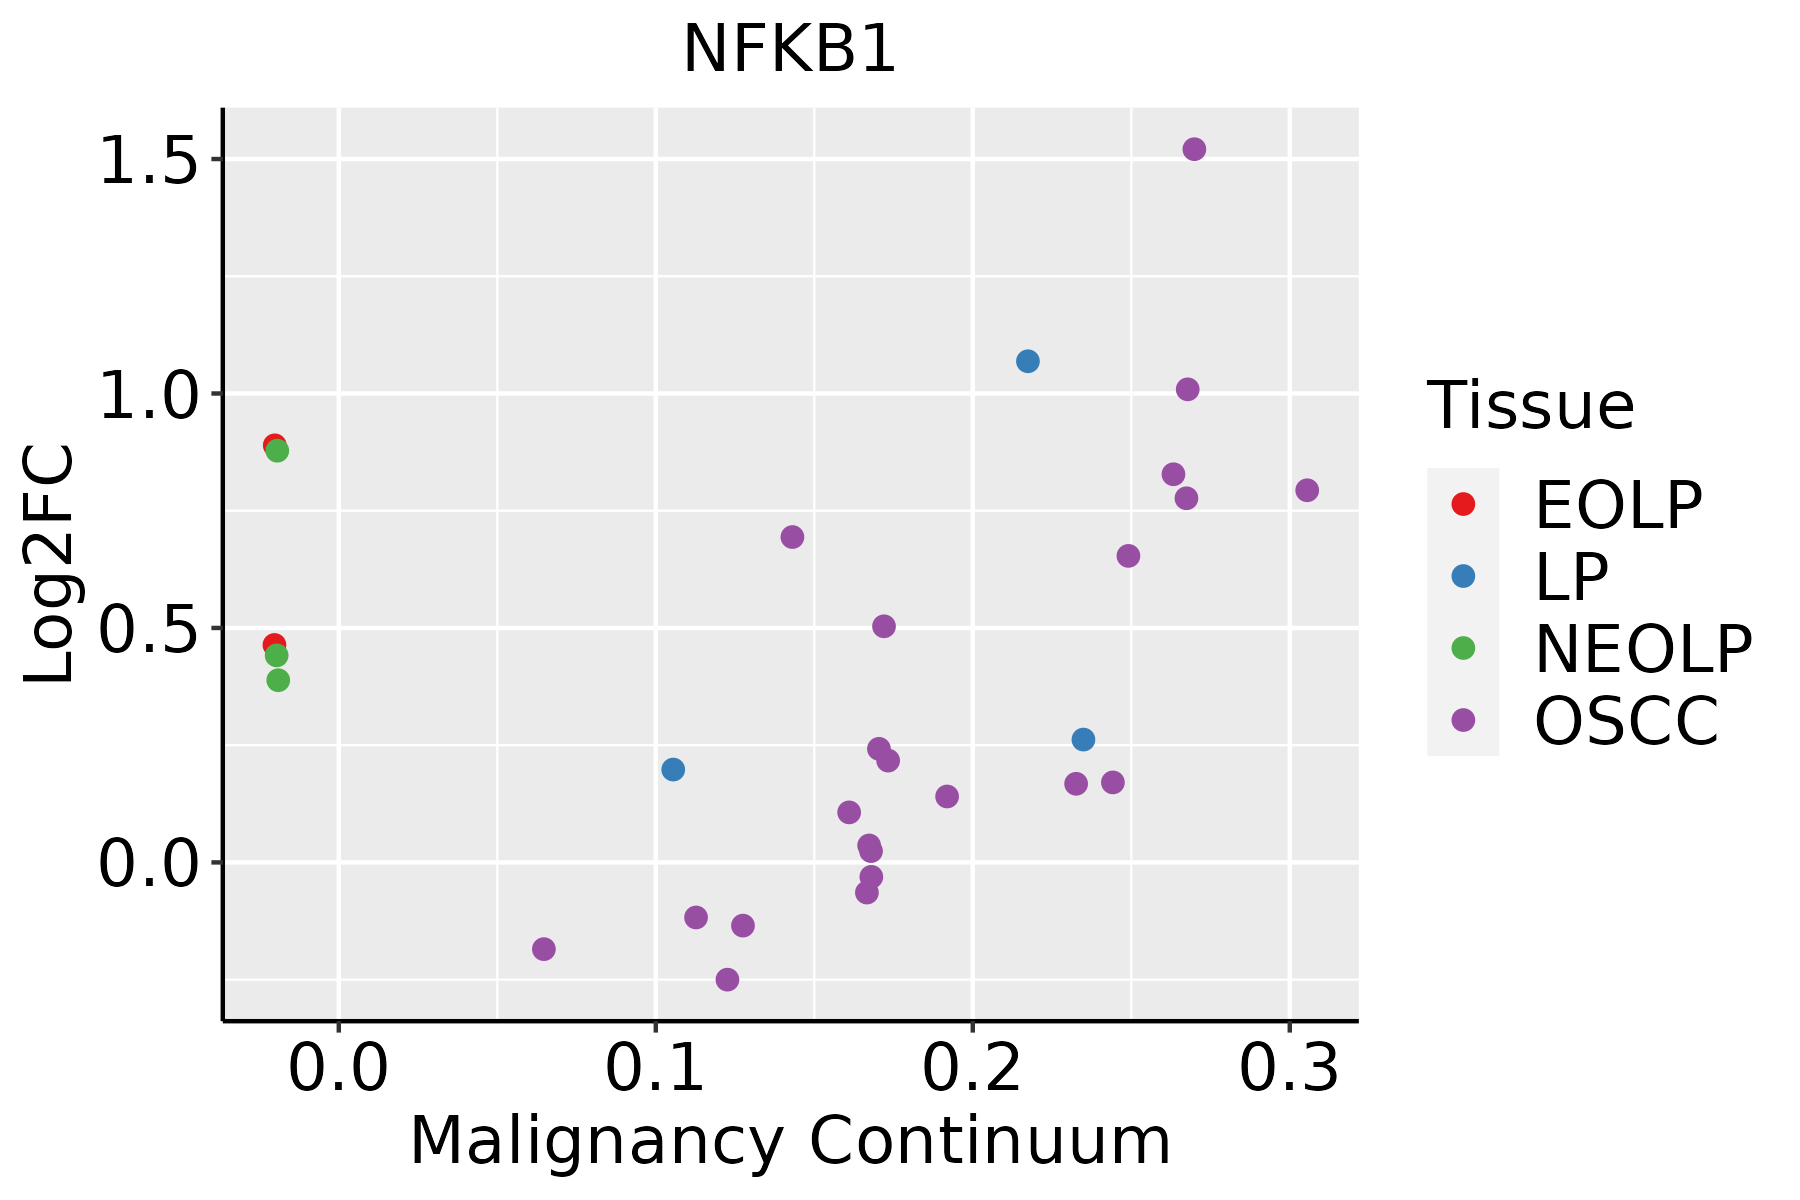 | EOLP: Erosive Oral lichen planus |
| LP: leukoplakia | ||
| NEOLP: Non-erosive oral lichen planus | ||
| OSCC: Oral squamous cell carcinoma | ||
| Prostate | 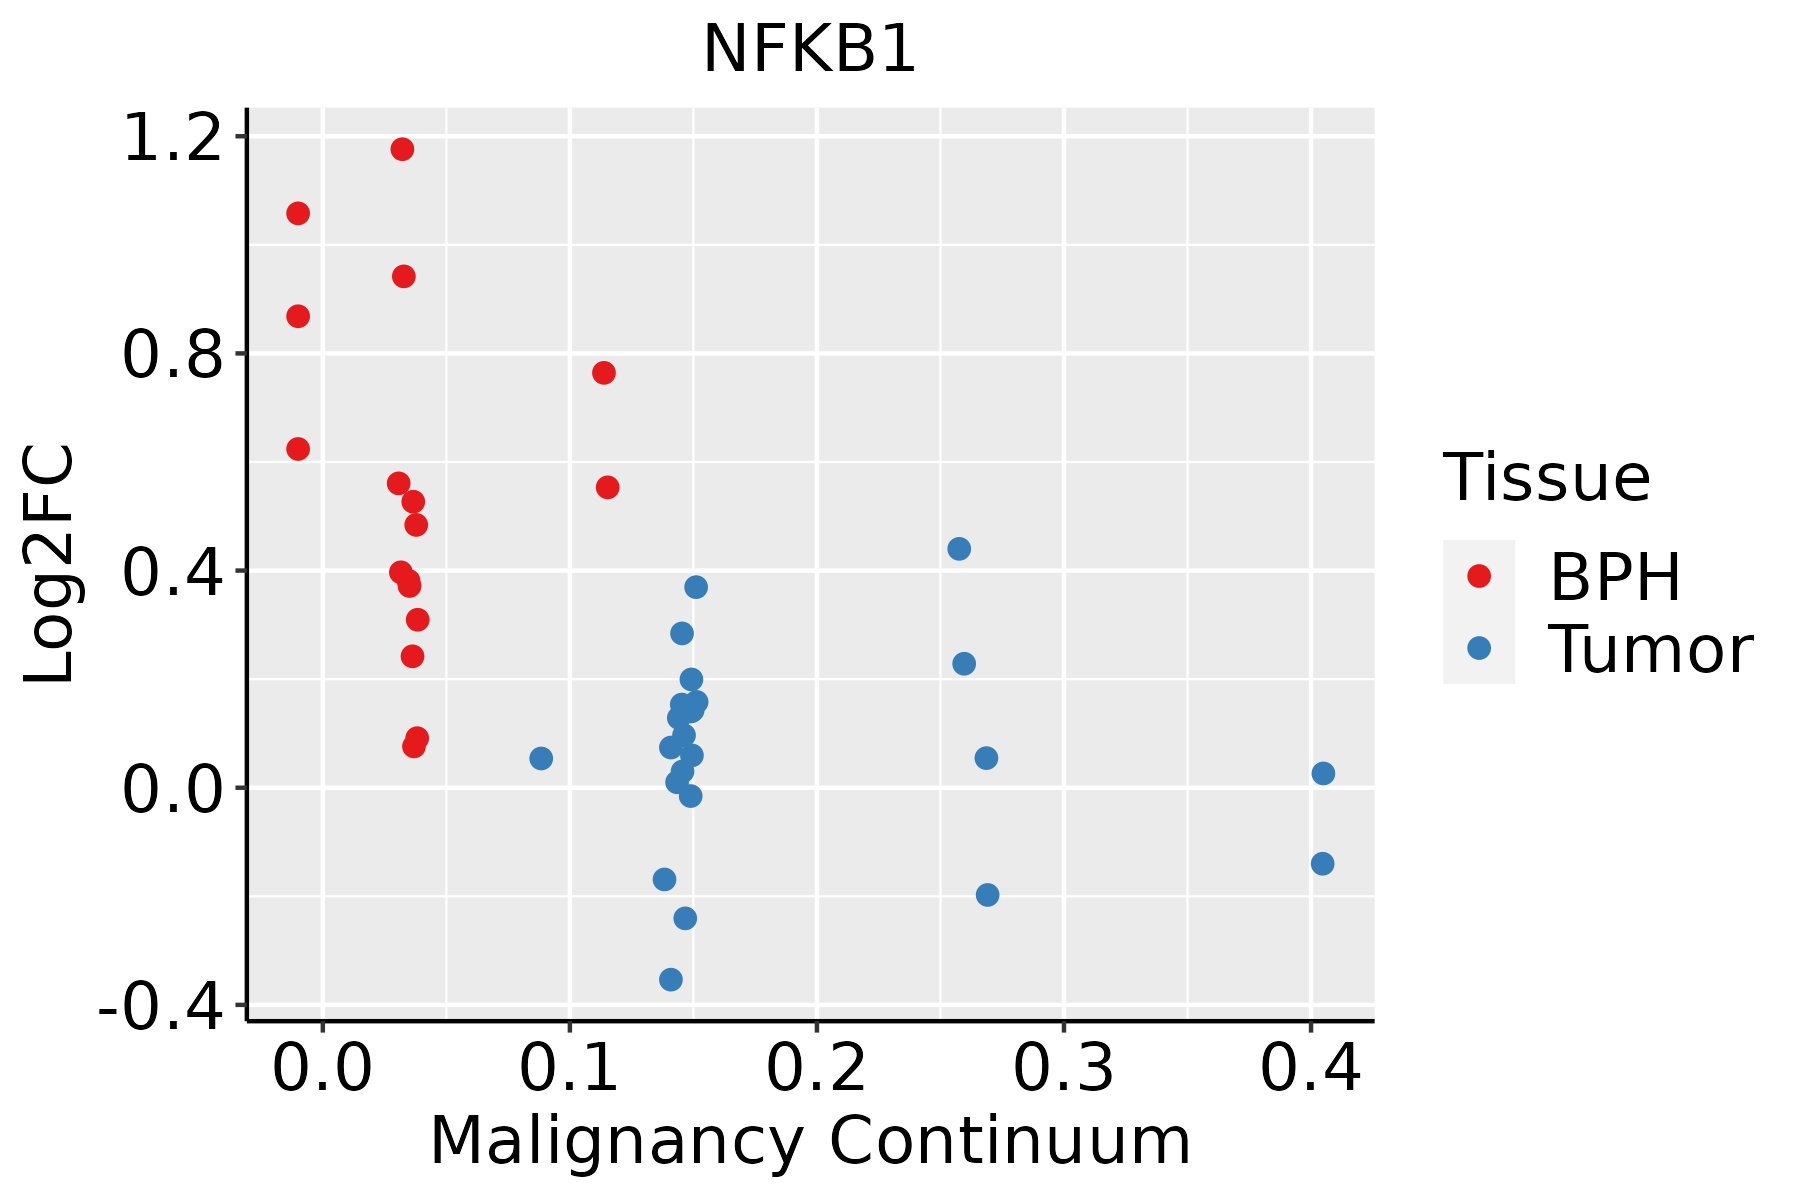 | BPH: Benign Prostatic Hyperplasia |
| Skin | 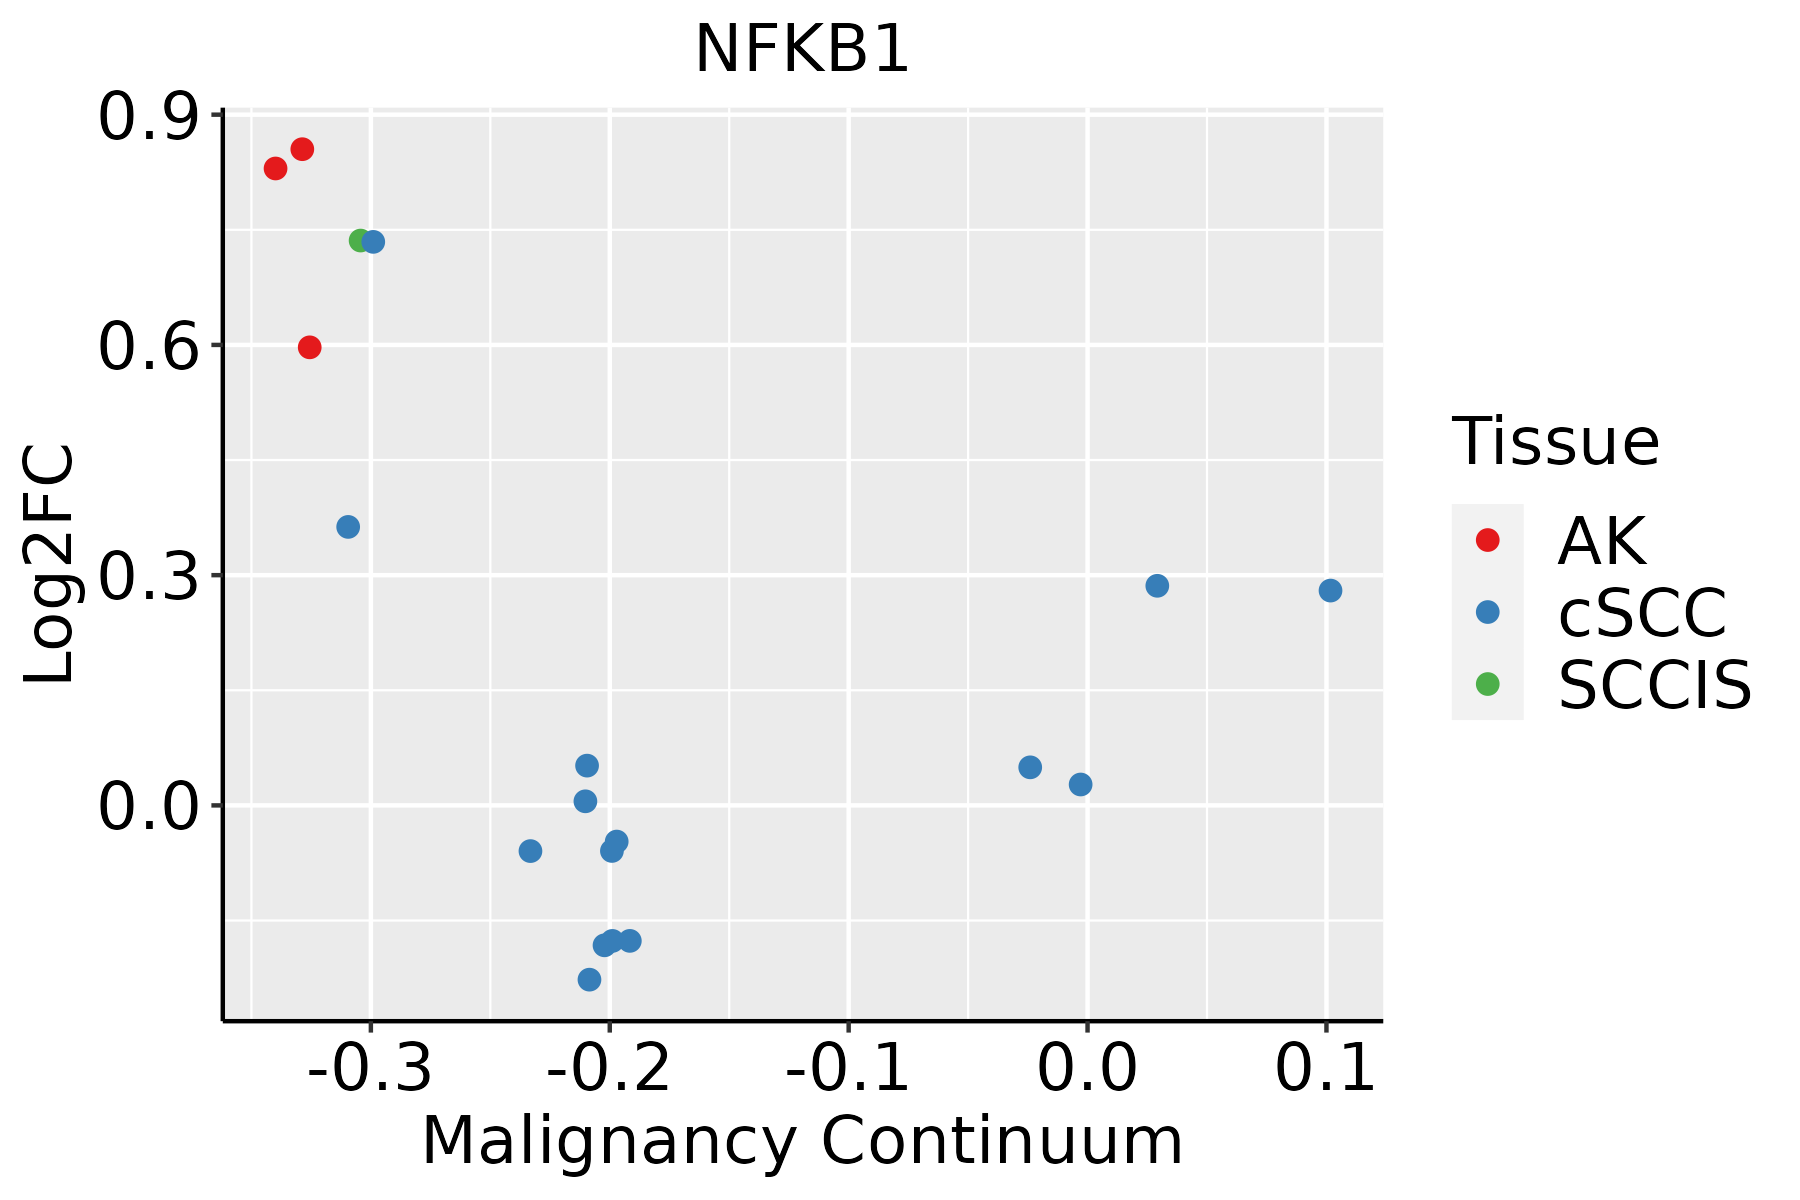 | AK: Actinic keratosis |
| cSCC: Cutaneous squamous cell carcinoma | ||
| SCCIS:squamous cell carcinoma in situ | ||
| Thyroid |  | ATC: Anaplastic thyroid cancer |
| HT: Hashimoto's thyroiditis | ||
| PTC: Papillary thyroid cancer |
| ∗log2FC in expression of this searched gene in stem-like cells from each diseased tissue sample relative to stem-like cells in normal samples in each tissue plotted against the malignancy continuum. Samples are colored based on if they are from different disease stage. |
Top |
Malignant transformation related pathway analysis |
| Find out the enriched GO biological processes and KEGG pathways involved in transition from healthy to precancer to cancer |
| Tissue | Disease Stage | Enriched GO biological Processes |
| Colorectum | AD |  |
| Colorectum | SER |  |
| Colorectum | MSS |  |
| Colorectum | MSI-H |  |
| Colorectum | FAP |  |
| ∗Top 15 enriched GO BP terms are showed in the bar plot of each disease state in each tissue. Each row represents a significant GO biological process which is colored according to the -log10(p.adjust). |
| Page: 1 2 3 4 5 6 7 8 9 |
| GO ID | Tissue | Disease Stage | Description | Gene Ratio | Bg Ratio | pvalue | p.adjust | Count |
| GO:1901653 | Colorectum | AD | cellular response to peptide | 114/3918 | 359/18723 | 8.32e-07 | 2.88e-05 | 114 |
| GO:0071375 | Colorectum | AD | cellular response to peptide hormone stimulus | 95/3918 | 290/18723 | 1.50e-06 | 4.66e-05 | 95 |
| GO:0043434 | Colorectum | AD | response to peptide hormone | 126/3918 | 414/18723 | 2.70e-06 | 7.86e-05 | 126 |
| GO:0030111 | Colorectum | AD | regulation of Wnt signaling pathway | 102/3918 | 328/18723 | 8.51e-06 | 2.03e-04 | 102 |
| GO:0016055 | Colorectum | AD | Wnt signaling pathway | 130/3918 | 444/18723 | 1.60e-05 | 3.37e-04 | 130 |
| GO:0198738 | Colorectum | AD | cell-cell signaling by wnt | 130/3918 | 446/18723 | 2.02e-05 | 4.10e-04 | 130 |
| GO:0006066 | Colorectum | AD | alcohol metabolic process | 106/3918 | 353/18723 | 3.02e-05 | 5.57e-04 | 106 |
| GO:0060070 | Colorectum | AD | canonical Wnt signaling pathway | 90/3918 | 303/18723 | 1.76e-04 | 2.38e-03 | 90 |
| GO:0071496 | Colorectum | AD | cellular response to external stimulus | 94/3918 | 320/18723 | 1.98e-04 | 2.64e-03 | 94 |
| GO:0060828 | Colorectum | AD | regulation of canonical Wnt signaling pathway | 77/3918 | 253/18723 | 2.19e-04 | 2.87e-03 | 77 |
| GO:0051403 | Colorectum | AD | stress-activated MAPK cascade | 72/3918 | 239/18723 | 4.77e-04 | 5.25e-03 | 72 |
| GO:0031098 | Colorectum | AD | stress-activated protein kinase signaling cascade | 74/3918 | 247/18723 | 4.80e-04 | 5.27e-03 | 74 |
| GO:0006109 | Colorectum | AD | regulation of carbohydrate metabolic process | 55/3918 | 178/18723 | 1.10e-03 | 1.01e-02 | 55 |
| GO:0030177 | Colorectum | AD | positive regulation of Wnt signaling pathway | 45/3918 | 140/18723 | 1.23e-03 | 1.09e-02 | 45 |
| GO:0062012 | Colorectum | AD | regulation of small molecule metabolic process | 93/3918 | 334/18723 | 1.46e-03 | 1.24e-02 | 93 |
| GO:0010876 | Colorectum | AD | lipid localization | 120/3918 | 448/18723 | 1.59e-03 | 1.33e-02 | 120 |
| GO:0006869 | Colorectum | AD | lipid transport | 108/3918 | 398/18723 | 1.67e-03 | 1.39e-02 | 108 |
| GO:0008202 | Colorectum | AD | steroid metabolic process | 85/3918 | 319/18723 | 8.07e-03 | 4.75e-02 | 85 |
| GO:00301112 | Colorectum | MSS | regulation of Wnt signaling pathway | 98/3467 | 328/18723 | 3.37e-07 | 1.36e-05 | 98 |
| GO:00160552 | Colorectum | MSS | Wnt signaling pathway | 124/3467 | 444/18723 | 6.06e-07 | 2.26e-05 | 124 |
| Page: 1 2 3 4 5 6 7 8 9 10 11 12 13 14 15 16 17 18 19 20 21 22 23 24 25 26 27 28 29 30 31 32 33 34 35 36 37 38 39 |
| Pathway ID | Tissue | Disease Stage | Description | Gene Ratio | Bg Ratio | pvalue | p.adjust | qvalue | Count |
| hsa05171310 | Esophagus | ESCC | Coronavirus disease - COVID-19 | 156/4205 | 232/8465 | 3.18e-08 | 2.68e-07 | 1.37e-07 | 156 |
| hsa05220110 | Esophagus | ESCC | Chronic myeloid leukemia | 61/4205 | 76/8465 | 3.20e-08 | 2.68e-07 | 1.37e-07 | 61 |
| hsa0520335 | Esophagus | ESCC | Viral carcinogenesis | 137/4205 | 204/8465 | 2.47e-07 | 1.88e-06 | 9.62e-07 | 137 |
| hsa05417310 | Esophagus | ESCC | Lipid and atherosclerosis | 143/4205 | 215/8465 | 3.30e-07 | 2.45e-06 | 1.26e-06 | 143 |
| hsa0522216 | Esophagus | ESCC | Small cell lung cancer | 69/4205 | 92/8465 | 5.40e-07 | 3.85e-06 | 1.97e-06 | 69 |
| hsa0516338 | Esophagus | ESCC | Human cytomegalovirus infection | 148/4205 | 225/8465 | 5.73e-07 | 4.00e-06 | 2.05e-06 | 148 |
| hsa0521517 | Esophagus | ESCC | Prostate cancer | 72/4205 | 97/8465 | 6.12e-07 | 4.10e-06 | 2.10e-06 | 72 |
| hsa0516016 | Esophagus | ESCC | Hepatitis C | 107/4205 | 157/8465 | 1.75e-06 | 1.08e-05 | 5.55e-06 | 107 |
| hsa0407117 | Esophagus | ESCC | Sphingolipid signaling pathway | 85/4205 | 121/8465 | 3.04e-06 | 1.73e-05 | 8.84e-06 | 85 |
| hsa0493317 | Esophagus | ESCC | AGE-RAGE signaling pathway in diabetic complications | 72/4205 | 100/8465 | 4.15e-06 | 2.28e-05 | 1.17e-05 | 72 |
| hsa0516114 | Esophagus | ESCC | Hepatitis B | 108/4205 | 162/8465 | 7.68e-06 | 4.15e-05 | 2.12e-05 | 108 |
| hsa0462513 | Esophagus | ESCC | C-type lectin receptor signaling pathway | 73/4205 | 104/8465 | 1.57e-05 | 7.98e-05 | 4.09e-05 | 73 |
| hsa0512019 | Esophagus | ESCC | Epithelial cell signaling in Helicobacter pylori infection | 52/4205 | 70/8465 | 2.17e-05 | 1.07e-04 | 5.47e-05 | 52 |
| hsa04066113 | Esophagus | ESCC | HIF-1 signaling pathway | 75/4205 | 109/8465 | 3.66e-05 | 1.68e-04 | 8.60e-05 | 75 |
| hsa0465734 | Esophagus | ESCC | IL-17 signaling pathway | 66/4205 | 94/8465 | 3.93e-05 | 1.75e-04 | 8.99e-05 | 66 |
| hsa05145111 | Esophagus | ESCC | Toxoplasmosis | 76/4205 | 112/8465 | 6.83e-05 | 2.90e-04 | 1.48e-04 | 76 |
| hsa04722111 | Esophagus | ESCC | Neurotrophin signaling pathway | 80/4205 | 119/8465 | 7.33e-05 | 3.07e-04 | 1.57e-04 | 80 |
| hsa0522113 | Esophagus | ESCC | Acute myeloid leukemia | 49/4205 | 67/8465 | 7.43e-05 | 3.07e-04 | 1.57e-04 | 49 |
| hsa0513436 | Esophagus | ESCC | Legionellosis | 42/4205 | 57/8465 | 1.83e-04 | 6.90e-04 | 3.53e-04 | 42 |
| hsa0516213 | Esophagus | ESCC | Measles | 90/4205 | 139/8465 | 2.16e-04 | 7.87e-04 | 4.03e-04 | 90 |
| Page: 1 2 3 4 5 6 7 8 9 10 11 12 13 14 15 16 17 18 19 20 21 22 23 24 25 26 27 28 29 30 31 32 33 34 35 36 37 38 39 40 41 42 43 44 45 46 47 48 49 50 51 52 53 54 55 56 57 58 59 60 61 62 63 64 65 66 67 |
Top |
Cell-cell communication analysis |
| Identification of potential cell-cell interactions between two cell types and their ligand-receptor pairs for different disease states |
| Ligand | Receptor | LRpair | Pathway | Tissue | Disease Stage |
| Page: 1 |
Top |
Single-cell gene regulatory network inference analysis |
| Find out the significant the regulons (TFs) and the target genes of each regulon across cell types for different disease states |
| TF | Cell Type | Tissue | Disease Stage | Target Gene | RSS | Regulon Activity |
| NFKB1 | SMC | Cervix | Healthy | SOD2,CXCL2,NFKB2, etc. | 8.36e-01 |  |
| NFKB1 | IMENT | Colorectum | MSS | TNFRSF6B,IRF1,C8orf4, etc. | 4.29e-02 |  |
| NFKB1 | AT2 | Lung | IAC | DENND4A,BACH1,KYNU, etc. | 1.83e-01 |  |
| NFKB1 | LC | Lung | IAC | SIPA1L1,AL078604.4,KYNU, etc. | 2.62e-01 | |
| NFKB1 | M2MAC | Skin | Healthy | REL,ATP5F1E,SIPA1L1, etc. | 4.68e-01 |  |
| NFKB1 | M2MAC | Skin | SCCIS | REL,ATP5F1E,SIPA1L1, etc. | 2.92e-01 |  |
| ∗The dot plots of a searched regulon are shown for all cell subpopulations in each disease state of each tissue based on the regulon specific score inferred using pySCENIC and by calculating the average expression. |
| Page: 1 |
Top |
Somatic mutation of malignant transformation related genes |
| Annotation of somatic variants for genes involved in malignant transformation |
| Hugo Symbol | Variant Class | Variant Classification | dbSNP RS | HGVSc | HGVSp | HGVSp Short | SWISSPROT | BIOTYPE | SIFT | PolyPhen | Tumor Sample Barcode | Tissue | Histology | Sex | Age | Stage | Therapy Types | Drugs | Outcome |
| NFKB1 | SNV | Missense_Mutation | c.1715C>T | p.Ser572Phe | p.S572F | P19838 | protein_coding | tolerated(0.64) | benign(0.201) | TCGA-A2-A0YH-01 | Breast | breast invasive carcinoma | Female | <65 | III/IV | Chemotherapy | adriamycin | SD | |
| NFKB1 | SNV | Missense_Mutation | novel | c.2191N>A | p.Gly731Arg | p.G731R | P19838 | protein_coding | deleterious(0) | probably_damaging(0.984) | TCGA-AR-A0TY-01 | Breast | breast invasive carcinoma | Female | <65 | I/II | Unspecific | Paclitaxel | PD |
| NFKB1 | SNV | Missense_Mutation | novel | c.119C>G | p.Ala40Gly | p.A40G | P19838 | protein_coding | tolerated(0.07) | possibly_damaging(0.854) | TCGA-AR-A0U0-01 | Breast | breast invasive carcinoma | Female | >=65 | I/II | Unknown | Unknown | SD |
| NFKB1 | SNV | Missense_Mutation | novel | c.733N>A | p.Ala245Thr | p.A245T | P19838 | protein_coding | deleterious(0) | probably_damaging(0.942) | TCGA-AR-A24L-01 | Breast | breast invasive carcinoma | Female | <65 | I/II | Hormone Therapy | tamoxiphen | PD |
| NFKB1 | SNV | Missense_Mutation | rs865962183 | c.574N>T | p.Arg192Trp | p.R192W | P19838 | protein_coding | deleterious(0.01) | probably_damaging(0.972) | TCGA-AR-A256-01 | Breast | breast invasive carcinoma | Female | <65 | I/II | Chemotherapy | doxorubicin | PD |
| NFKB1 | SNV | Missense_Mutation | c.221C>G | p.Ser74Cys | p.S74C | P19838 | protein_coding | deleterious(0) | probably_damaging(0.935) | TCGA-E2-A1LH-01 | Breast | breast invasive carcinoma | Female | <65 | I/II | Chemotherapy | adriamycin | SD | |
| NFKB1 | SNV | Missense_Mutation | rs769204159 | c.1562N>T | p.Ala521Val | p.A521V | P19838 | protein_coding | tolerated(0.06) | probably_damaging(0.988) | TCGA-E2-A573-01 | Breast | breast invasive carcinoma | Female | <65 | I/II | Chemotherapy | taxotere | CR |
| NFKB1 | SNV | Missense_Mutation | novel | c.1308N>T | p.Met436Ile | p.M436I | P19838 | protein_coding | tolerated(0.25) | benign(0) | TCGA-HN-A2OB-01 | Breast | breast invasive carcinoma | Female | <65 | I/II | Chemotherapy | fluorouracil | PD |
| NFKB1 | insertion | Nonsense_Mutation | novel | c.2107_2108insTTCTAAATATCTACTAGGTATTTGATAAACGTGTGTTATTT | p.Gly703ValfsTer6 | p.G703Vfs*6 | P19838 | protein_coding | TCGA-A2-A04Q-01 | Breast | breast invasive carcinoma | Female | <65 | I/II | Chemotherapy | adriamycin | SD | ||
| NFKB1 | insertion | Frame_Shift_Ins | novel | c.1403_1404insGTTTTTTCCT | p.Asp469PhefsTer16 | p.D469Ffs*16 | P19838 | protein_coding | TCGA-AO-A03O-01 | Breast | breast invasive carcinoma | Female | >=65 | I/II | Chemotherapy | doxorubicin | SD |
| Page: 1 2 3 4 5 6 7 8 9 10 |
Top |
Related drugs of malignant transformation related genes |
| Identification of chemicals and drugs interact with genes involved in malignant transfromation |
| (DGIdb 4.0) |
| Entrez ID | Symbol | Category | Interaction Types | Drug Claim Name | Drug Name | PMIDs |
| 4790 | NFKB1 | KINASE, TRANSCRIPTION FACTOR, DRUGGABLE GENOME | SJ000113257 | CHEMBL528694 | ||
| 4790 | NFKB1 | KINASE, TRANSCRIPTION FACTOR, DRUGGABLE GENOME | SANGUINARIUM | SANGUINARIUM | ||
| 4790 | NFKB1 | KINASE, TRANSCRIPTION FACTOR, DRUGGABLE GENOME | DYRENE | DYRENE | ||
| 4790 | NFKB1 | KINASE, TRANSCRIPTION FACTOR, DRUGGABLE GENOME | ISORHAMNETIN | ISORHAMNETIN | 25190466 | |
| 4790 | NFKB1 | KINASE, TRANSCRIPTION FACTOR, DRUGGABLE GENOME | MITOXANTRONE | MITOXANTRONE | ||
| 4790 | NFKB1 | KINASE, TRANSCRIPTION FACTOR, DRUGGABLE GENOME | PARTHENOLIDE | PARTHENOLIDE | 25190466 | |
| 4790 | NFKB1 | KINASE, TRANSCRIPTION FACTOR, DRUGGABLE GENOME | THALIDOMIDE | THALIDOMIDE | ||
| 4790 | NFKB1 | KINASE, TRANSCRIPTION FACTOR, DRUGGABLE GENOME | (S)-NOMIFENSINE | CHEMBL51697 | ||
| 4790 | NFKB1 | KINASE, TRANSCRIPTION FACTOR, DRUGGABLE GENOME | 6-CHLOROMELATONIN | CHEMBL34730 | ||
| 4790 | NFKB1 | KINASE, TRANSCRIPTION FACTOR, DRUGGABLE GENOME | TOSYL-L-LYSINE CHLOROMETHYL KETONE | CHEMBL466465 |
| Page: 1 2 3 4 5 6 7 8 9 10 |

Copyright 2023-Present -The University of Texas Health Science Center at Houston |