
|
|||||
|
 | |
| |
| |
| |
| |
| |
|
Gene: ACTG1 |
Gene summary for ACTG1 |
| Gene information | Species | Human | Gene symbol | ACTG1 | Gene ID | 71 |
| Gene name | actin gamma 1 | |
| Gene Alias | ACT | |
| Cytomap | 17q25.3 | |
| Gene Type | protein-coding | GO ID | GO:0001525 | UniProtAcc | P63261 |
Top |
Malignant transformation analysis |
| Identification of the aberrant gene expression in precancerous and cancerous lesions by comparing the gene expression of stem-like cells in diseased tissues with normal stem cells |
| Entrez ID | Symbol | Replicates | Species | Organ | Tissue | Adj P-value | Log2FC | Malignancy |
| 71 | ACTG1 | GSM4909287 | Human | Breast | IDC | 1.11e-04 | 1.15e-01 | 0.2057 |
| 71 | ACTG1 | GSM4909288 | Human | Breast | IDC | 1.63e-11 | 3.43e-01 | 0.0988 |
| 71 | ACTG1 | GSM4909293 | Human | Breast | IDC | 5.90e-42 | 3.34e-01 | 0.1581 |
| 71 | ACTG1 | GSM4909294 | Human | Breast | IDC | 7.93e-03 | -8.81e-02 | 0.2022 |
| 71 | ACTG1 | GSM4909295 | Human | Breast | IDC | 4.03e-05 | 2.33e-01 | 0.0898 |
| 71 | ACTG1 | GSM4909296 | Human | Breast | IDC | 1.20e-42 | -8.02e-01 | 0.1524 |
| 71 | ACTG1 | GSM4909297 | Human | Breast | IDC | 5.18e-07 | -4.20e-02 | 0.1517 |
| 71 | ACTG1 | GSM4909298 | Human | Breast | IDC | 6.41e-09 | 1.56e-01 | 0.1551 |
| 71 | ACTG1 | GSM4909301 | Human | Breast | IDC | 1.76e-06 | -2.82e-01 | 0.1577 |
| 71 | ACTG1 | GSM4909311 | Human | Breast | IDC | 1.68e-32 | -6.23e-01 | 0.1534 |
| 71 | ACTG1 | GSM4909317 | Human | Breast | IDC | 3.10e-23 | 3.13e-01 | 0.1355 |
| 71 | ACTG1 | GSM4909318 | Human | Breast | IDC | 3.01e-05 | 3.09e-01 | 0.2031 |
| 71 | ACTG1 | GSM4909319 | Human | Breast | IDC | 4.98e-40 | -3.62e-01 | 0.1563 |
| 71 | ACTG1 | GSM4909320 | Human | Breast | IDC | 2.09e-03 | -2.89e-01 | 0.1575 |
| 71 | ACTG1 | GSM4909321 | Human | Breast | IDC | 9.41e-54 | 3.64e-01 | 0.1559 |
| 71 | ACTG1 | ctrl6 | Human | Breast | Precancer | 1.13e-04 | 2.42e-01 | -0.0061 |
| 71 | ACTG1 | brca1 | Human | Breast | Precancer | 8.89e-38 | 3.59e-01 | -0.0338 |
| 71 | ACTG1 | brca3 | Human | Breast | Precancer | 1.63e-16 | 2.39e-01 | -0.0263 |
| 71 | ACTG1 | brca7 | Human | Breast | Precancer | 5.10e-03 | 2.92e-01 | -0.009 |
| 71 | ACTG1 | brca10 | Human | Breast | Precancer | 2.71e-22 | 2.95e-01 | -0.0029 |
| Page: 1 2 3 4 5 6 7 8 9 10 11 12 13 14 15 16 17 18 19 20 |
| Tissue | Expression Dynamics | Abbreviation |
| Breast |  | IDC: Invasive ductal carcinoma |
| DCIS: Ductal carcinoma in situ | ||
| Precancer(BRCA1-mut): Precancerous lesion from BRCA1 mutation carriers | ||
| Cervix | 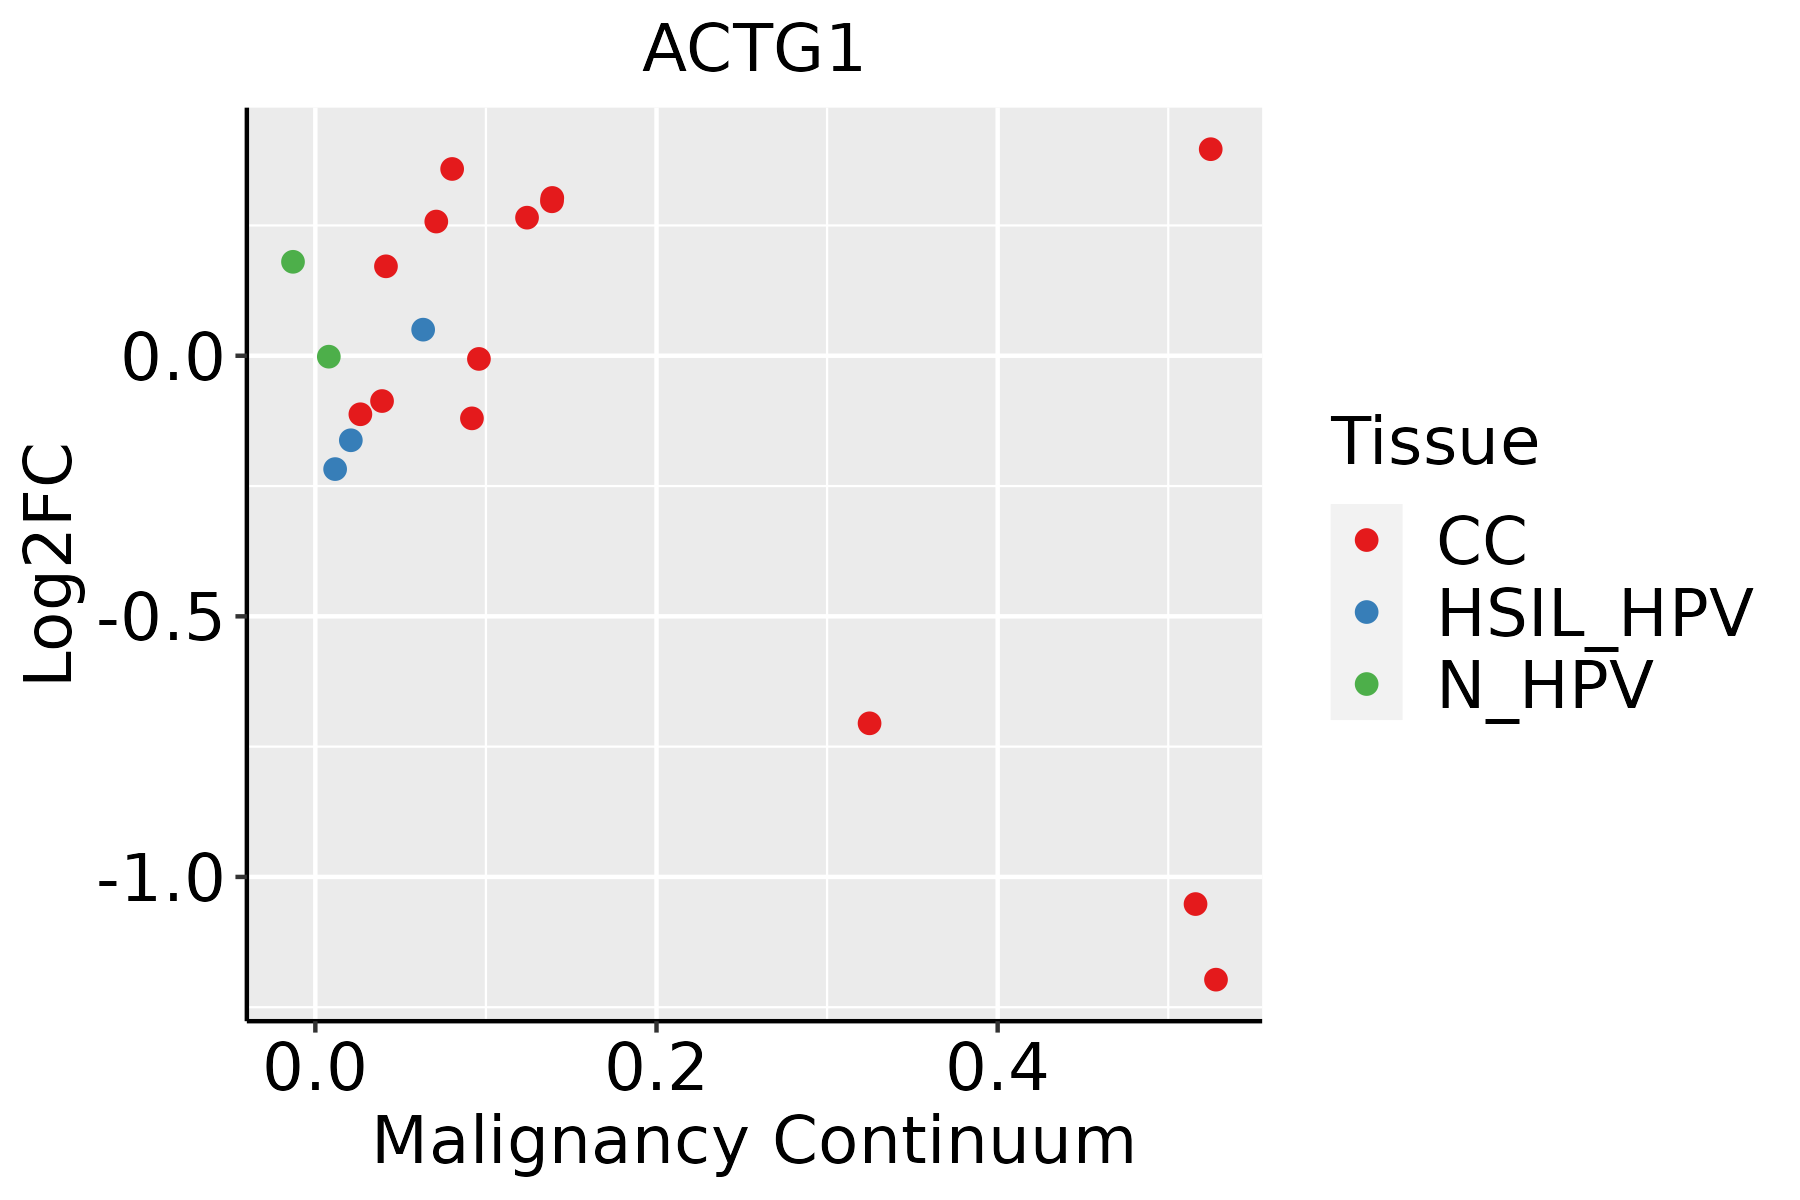 | CC: Cervix cancer |
| HSIL_HPV: HPV-infected high-grade squamous intraepithelial lesions | ||
| N_HPV: HPV-infected normal cervix | ||
| Colorectum (GSE201348) |  | FAP: Familial adenomatous polyposis |
| CRC: Colorectal cancer | ||
| Colorectum (HTA11) |  | AD: Adenomas |
| SER: Sessile serrated lesions | ||
| MSI-H: Microsatellite-high colorectal cancer | ||
| MSS: Microsatellite stable colorectal cancer | ||
| Endometrium | 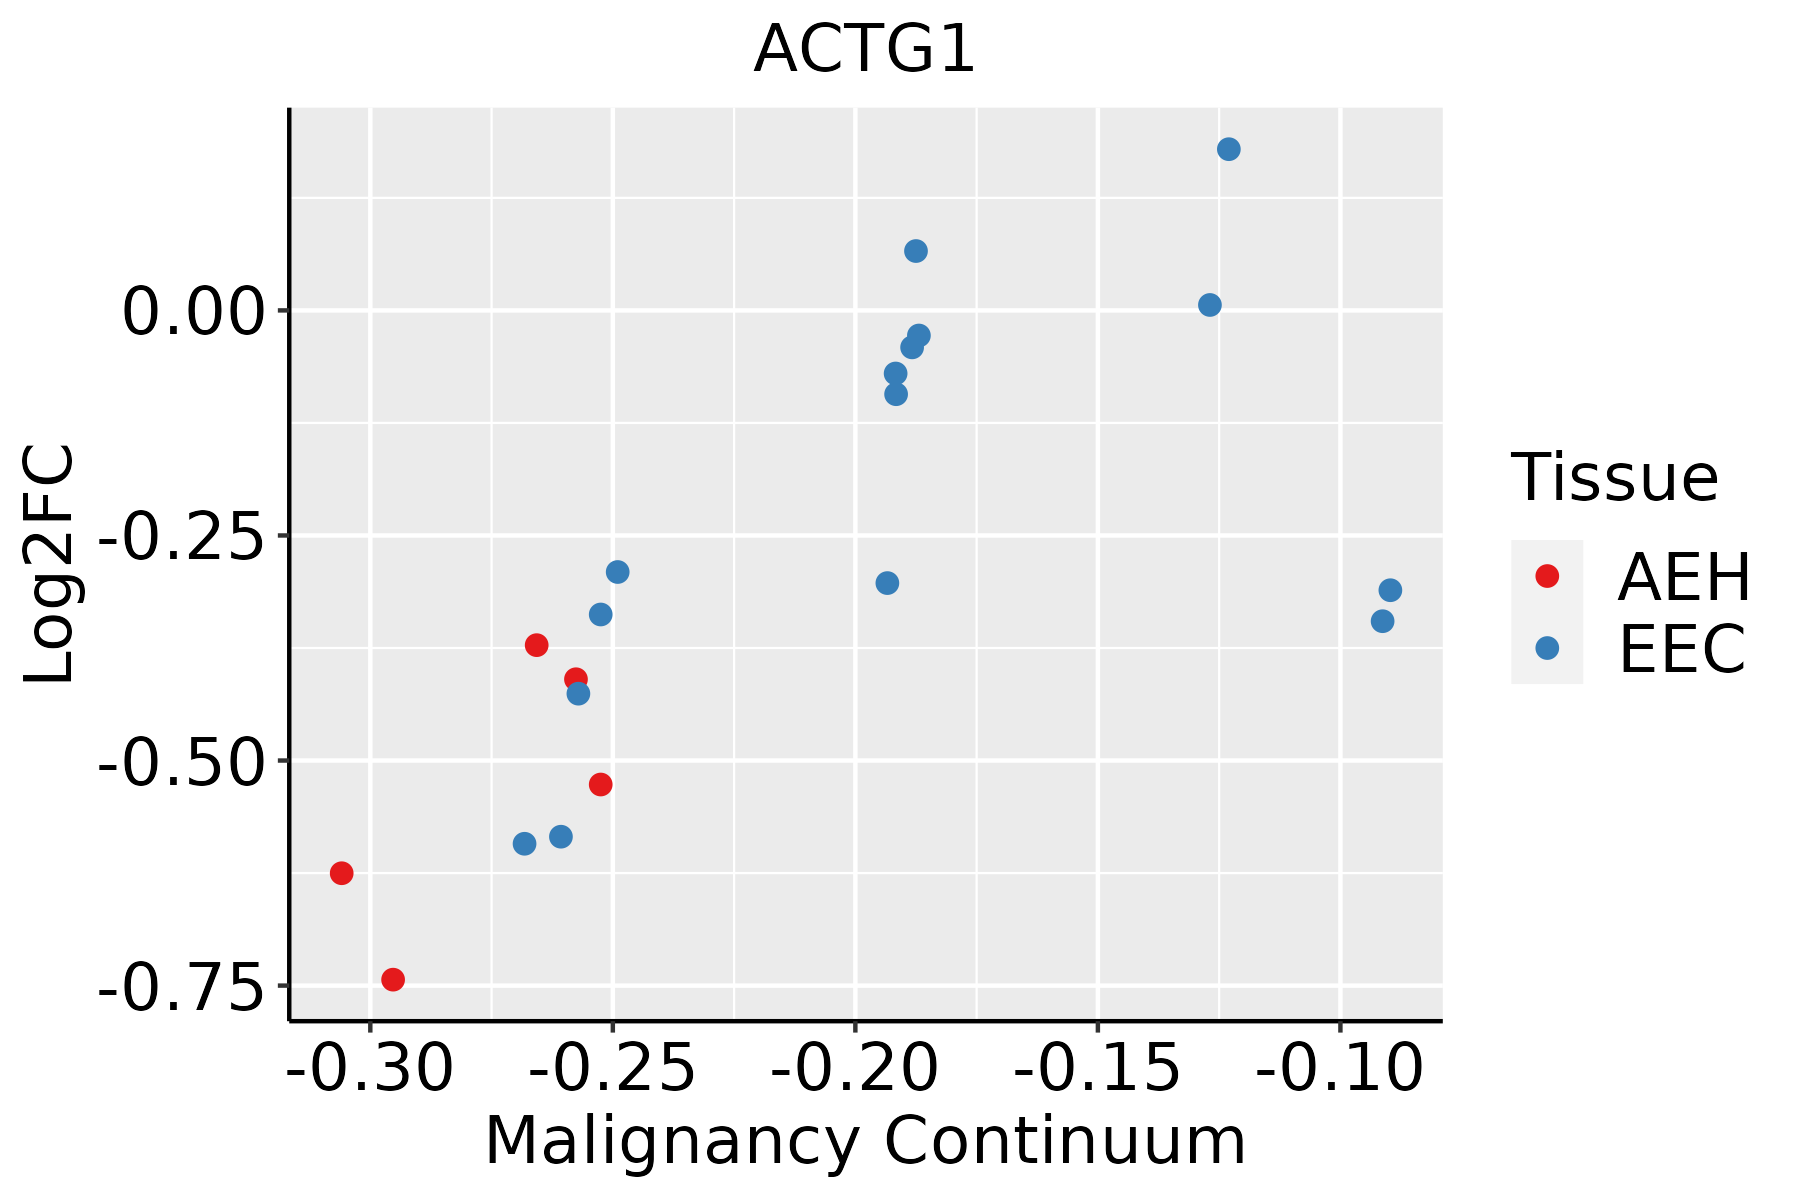 | AEH: Atypical endometrial hyperplasia |
| EEC: Endometrioid Cancer | ||
| Esophagus | 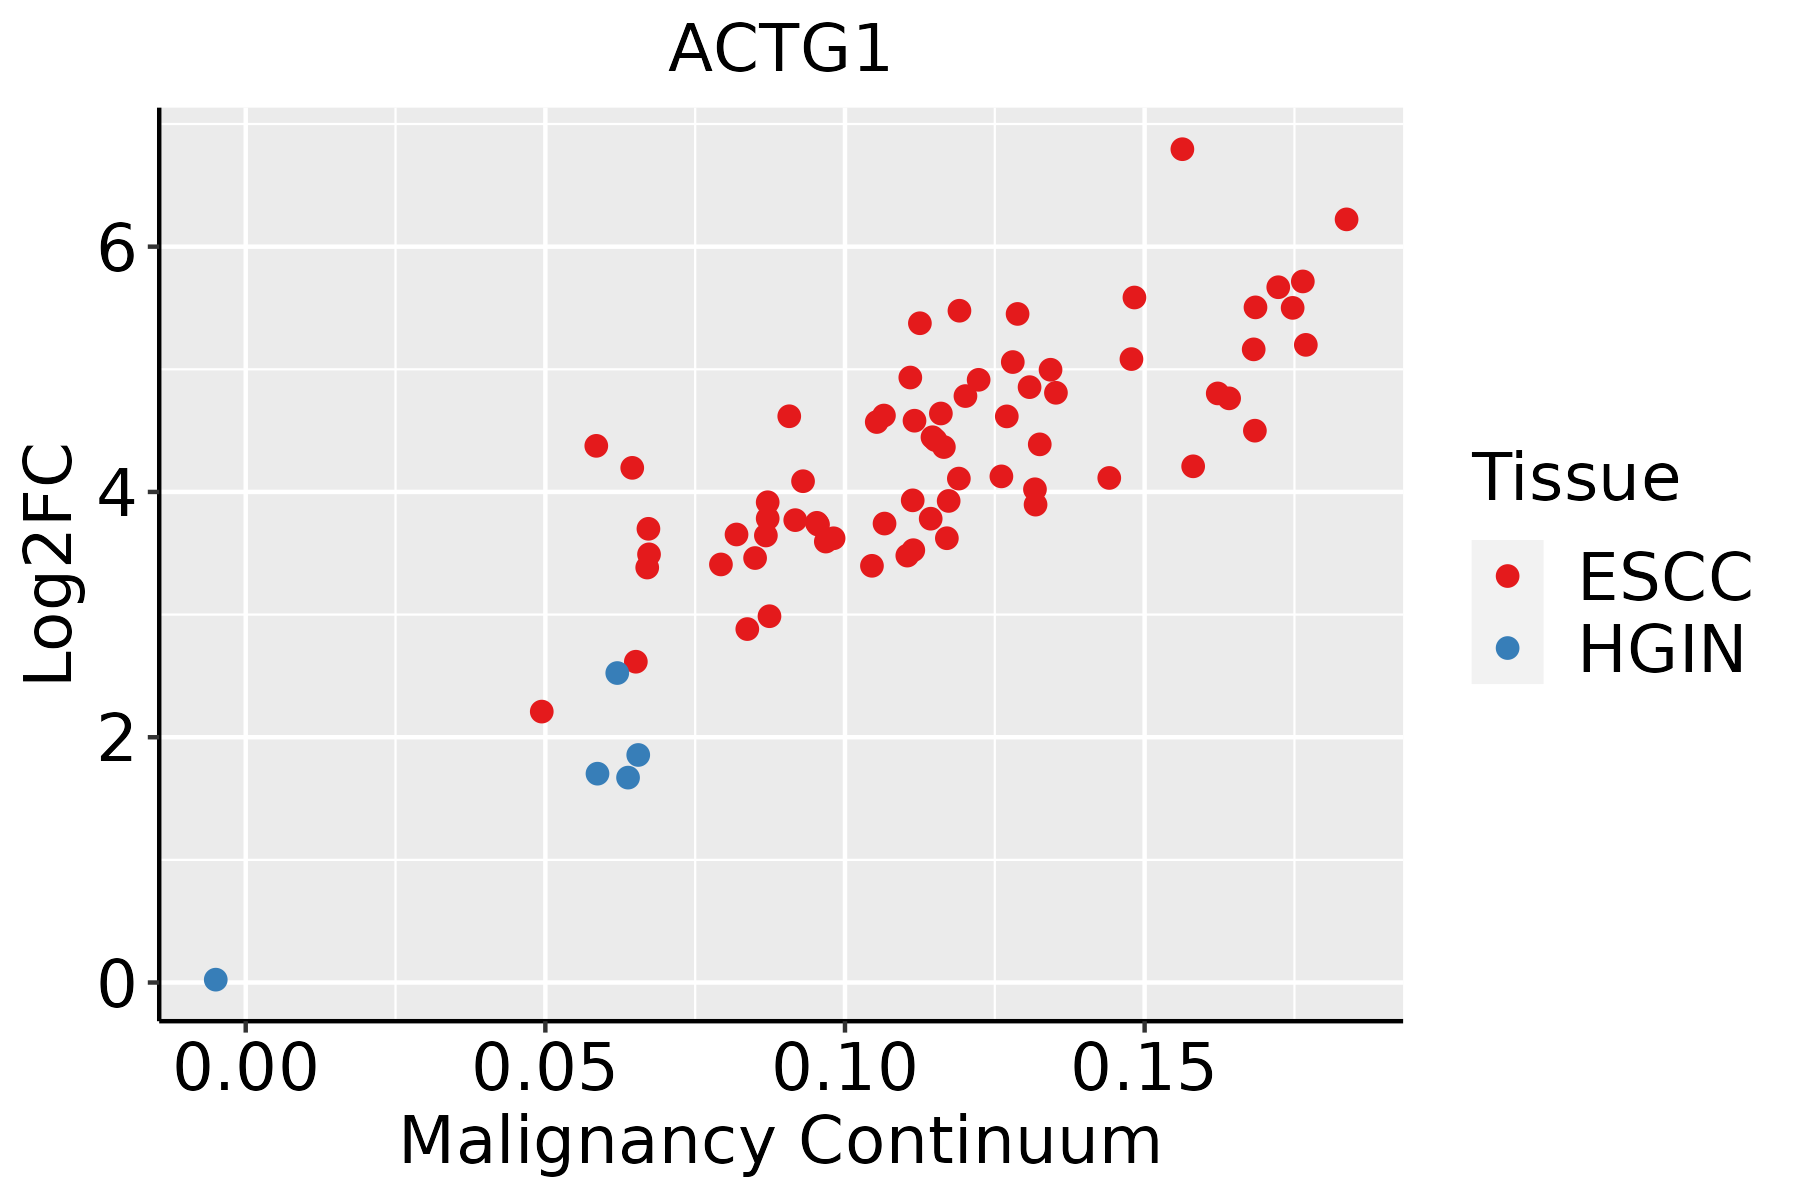 | ESCC: Esophageal squamous cell carcinoma |
| HGIN: High-grade intraepithelial neoplasias | ||
| LGIN: Low-grade intraepithelial neoplasias | ||
| GC | 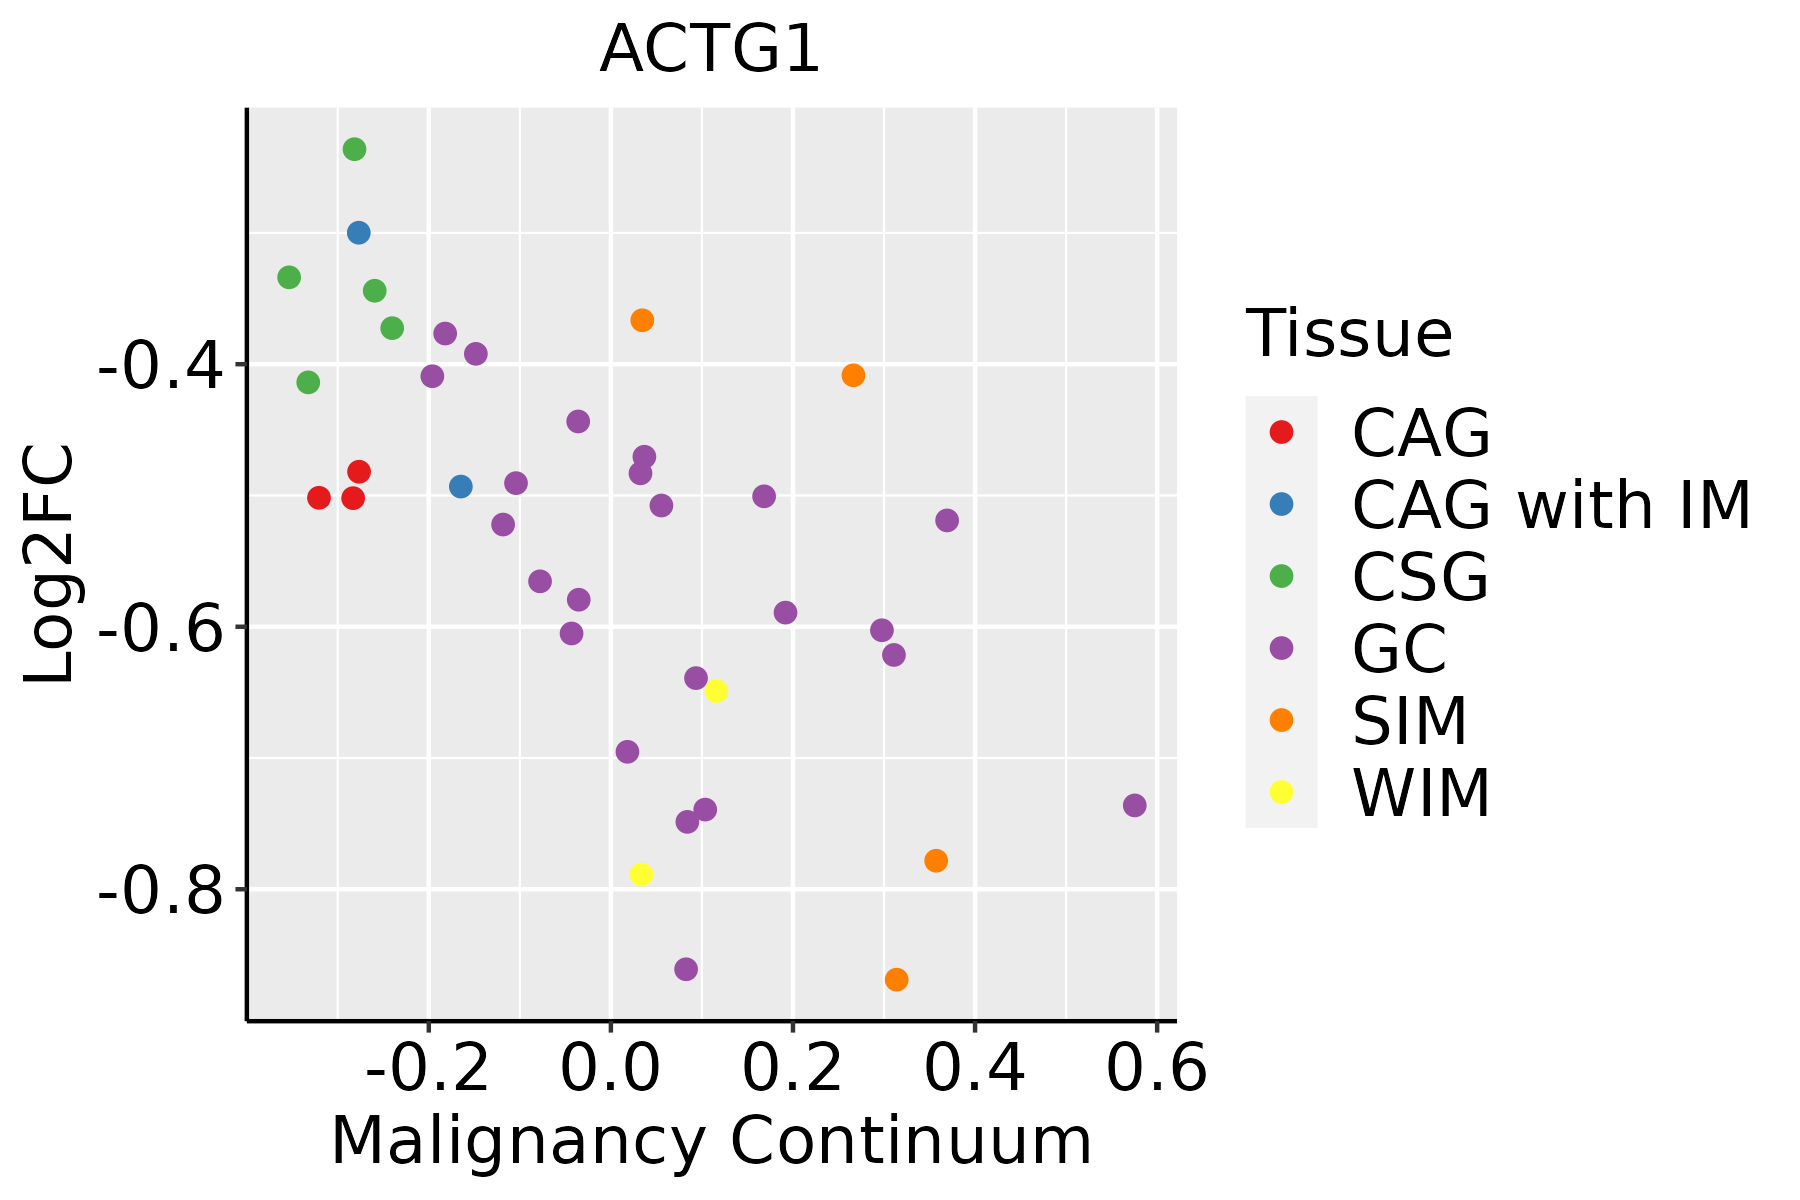 | CAG: Chronic atrophic gastritis |
| CAG with IM: Chronic atrophic gastritis with intestinal metaplasia | ||
| CSG: Chronic superficial gastritis | ||
| GC: Gastric cancer | ||
| SIM: Severe intestinal metaplasia | ||
| WIM: Wild intestinal metaplasia | ||
| Liver | 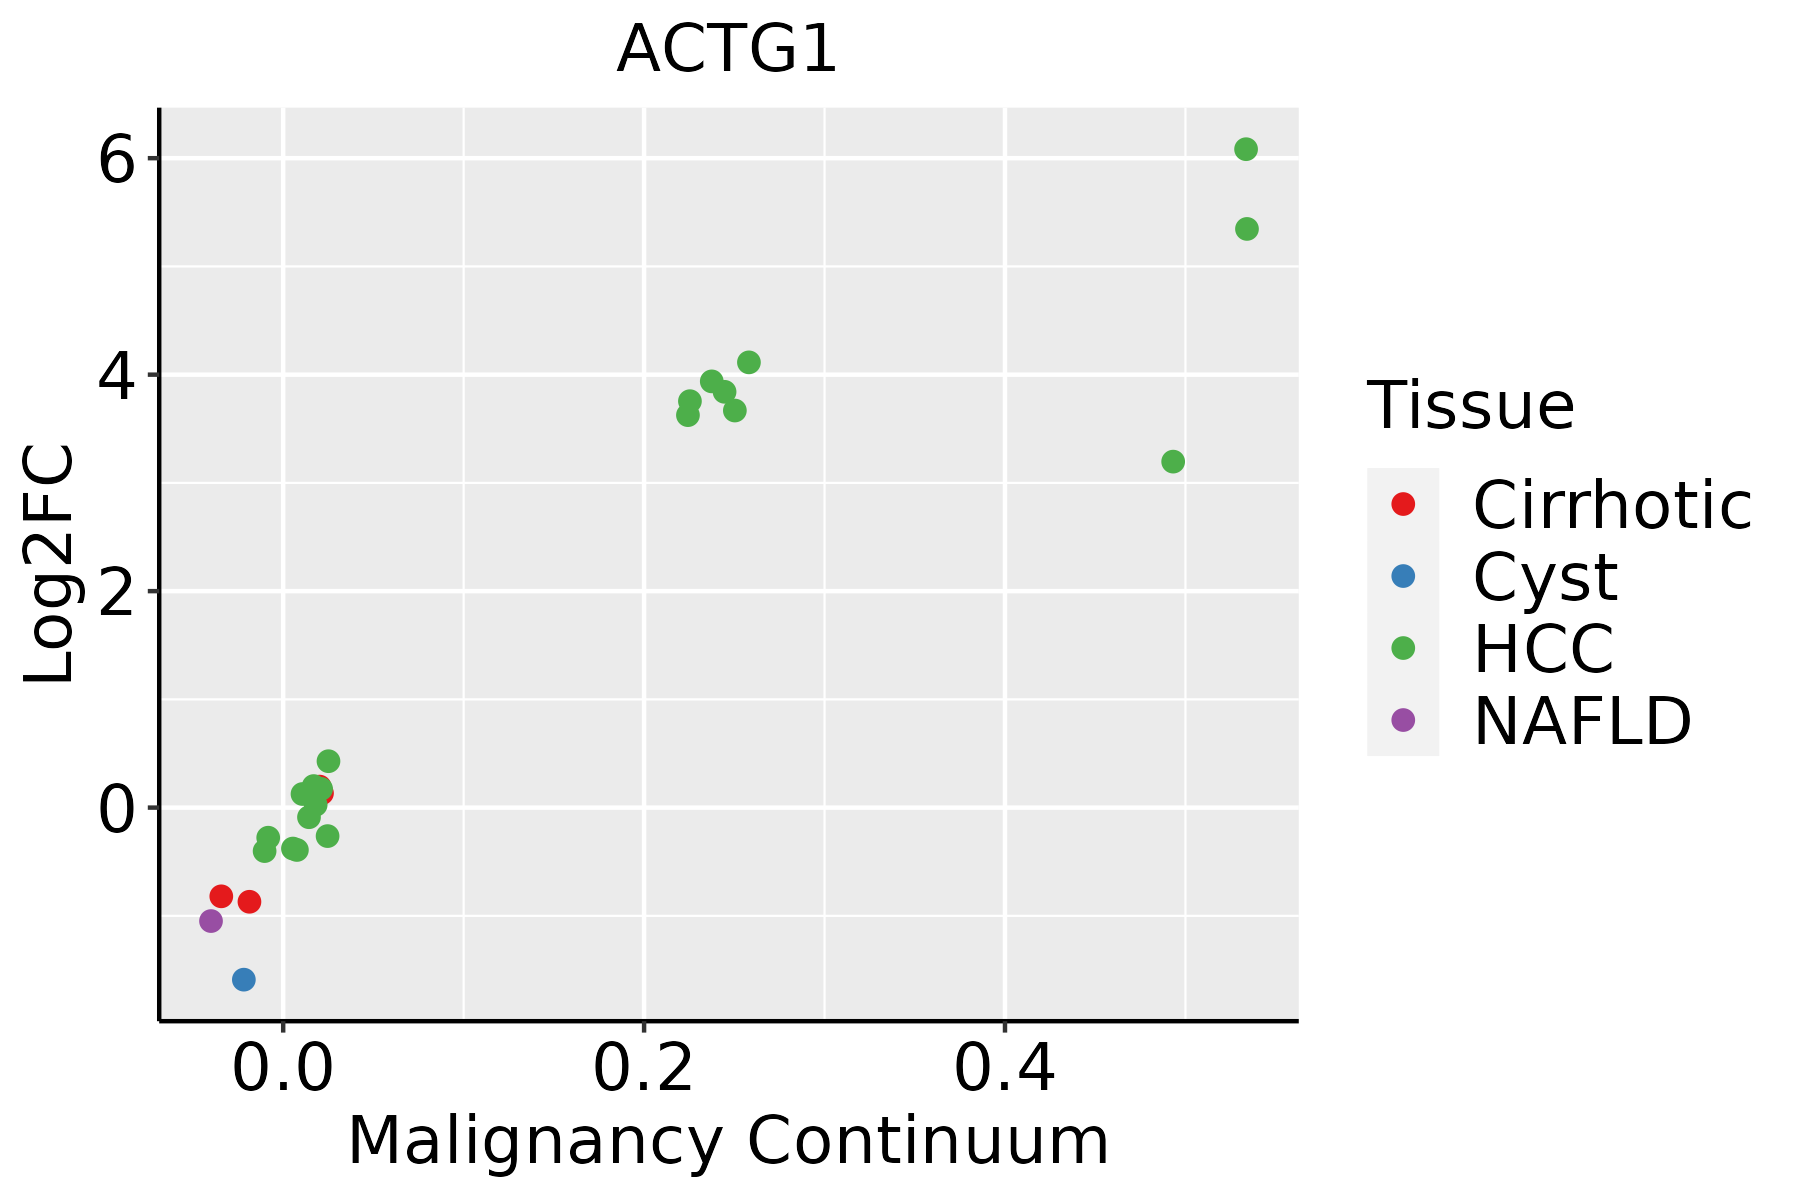 | HCC: Hepatocellular carcinoma |
| NAFLD: Non-alcoholic fatty liver disease | ||
| Lung | 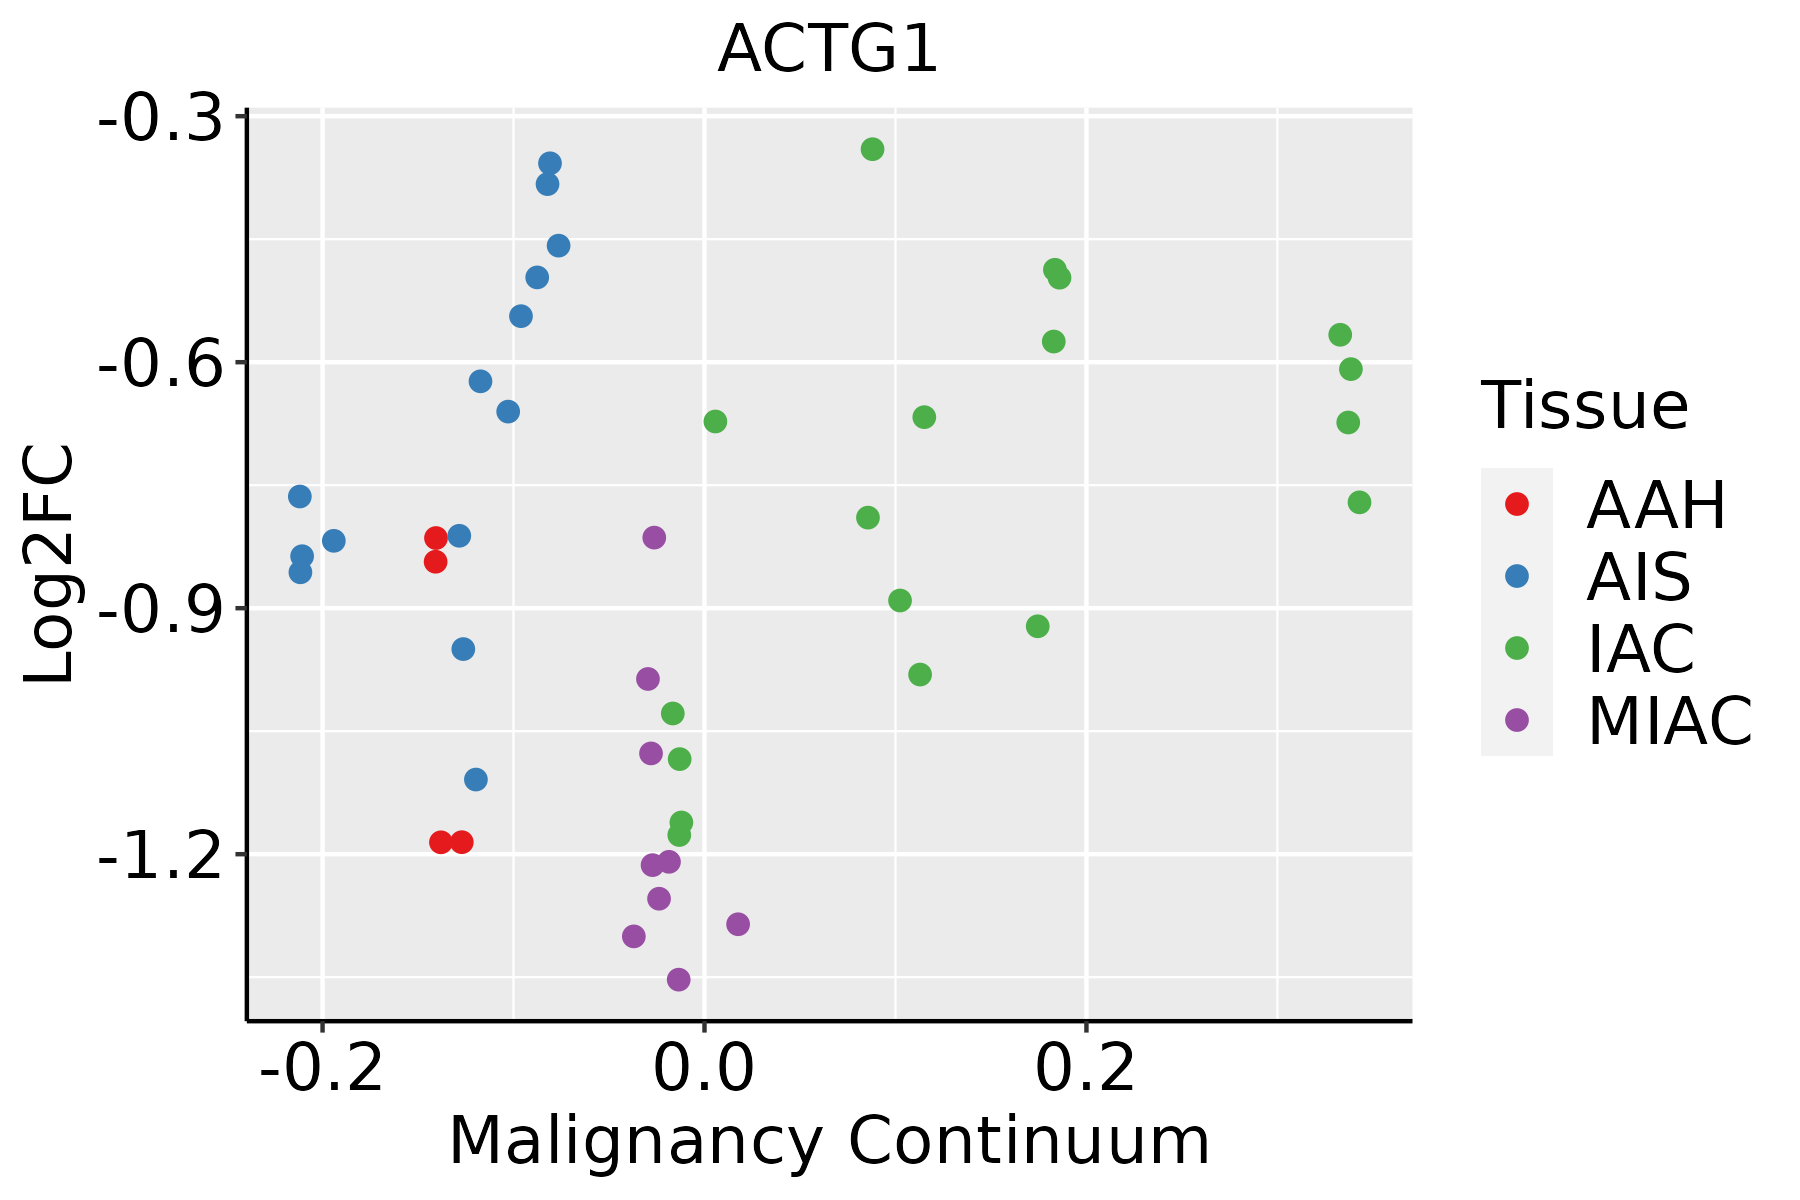 | AAH: Atypical adenomatous hyperplasia |
| AIS: Adenocarcinoma in situ | ||
| IAC: Invasive lung adenocarcinoma | ||
| MIA: Minimally invasive adenocarcinoma | ||
| Oral Cavity | 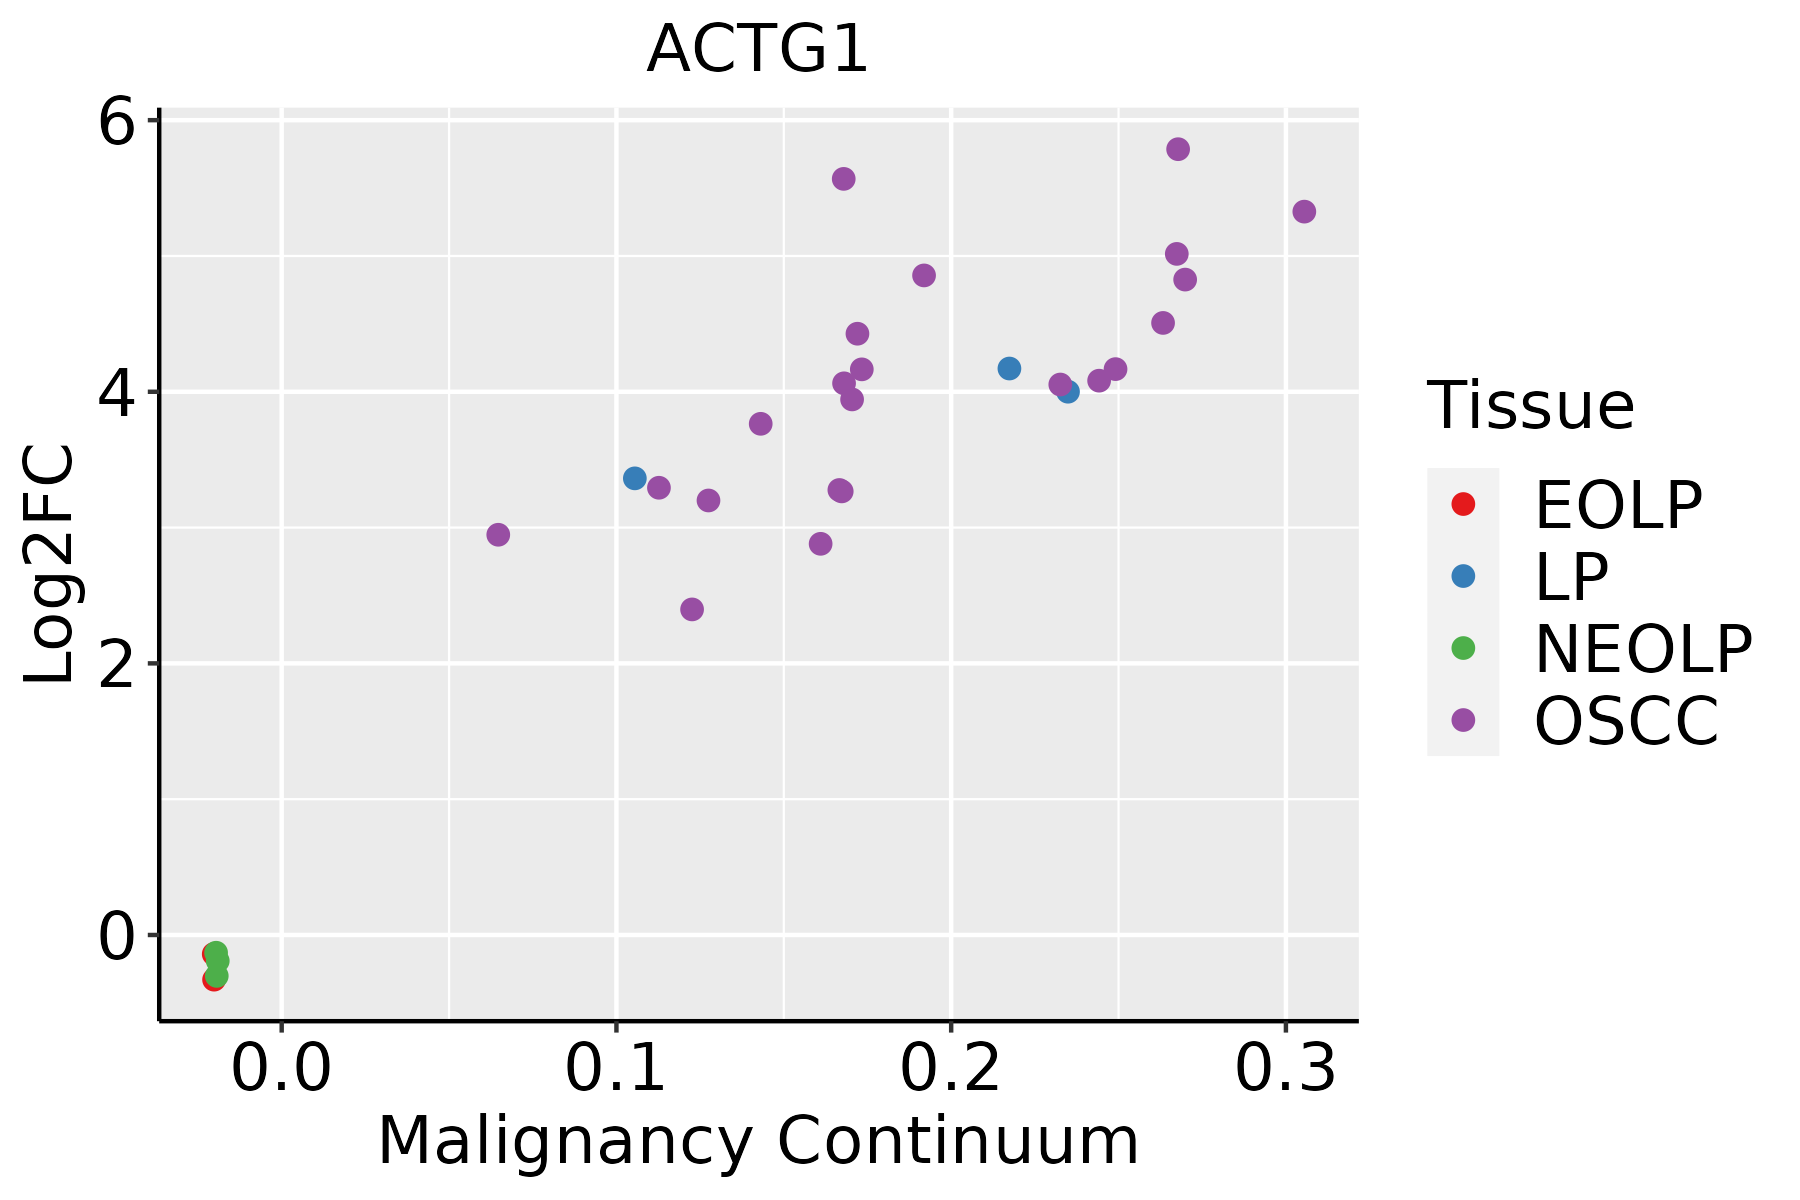 | EOLP: Erosive Oral lichen planus |
| LP: leukoplakia | ||
| NEOLP: Non-erosive oral lichen planus | ||
| OSCC: Oral squamous cell carcinoma | ||
| Prostate | 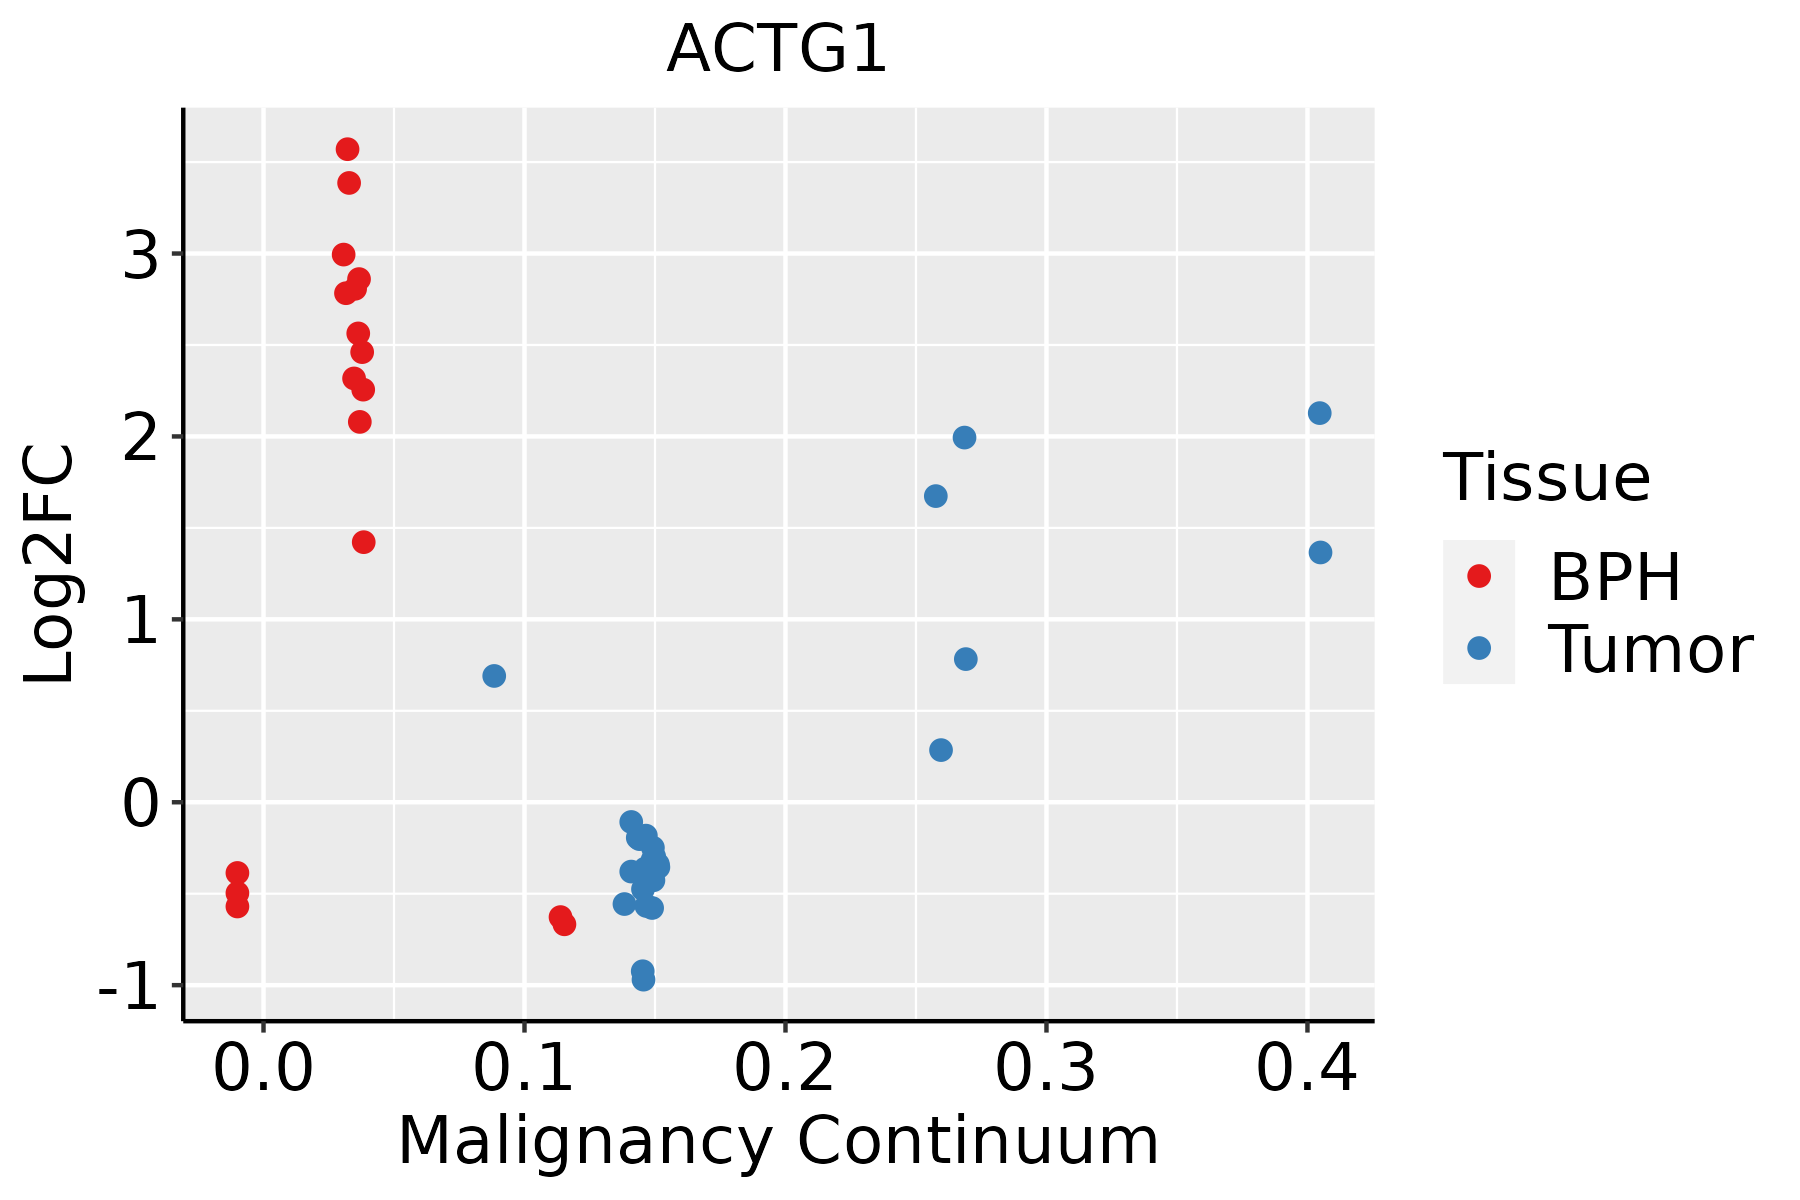 | BPH: Benign Prostatic Hyperplasia |
| Skin | 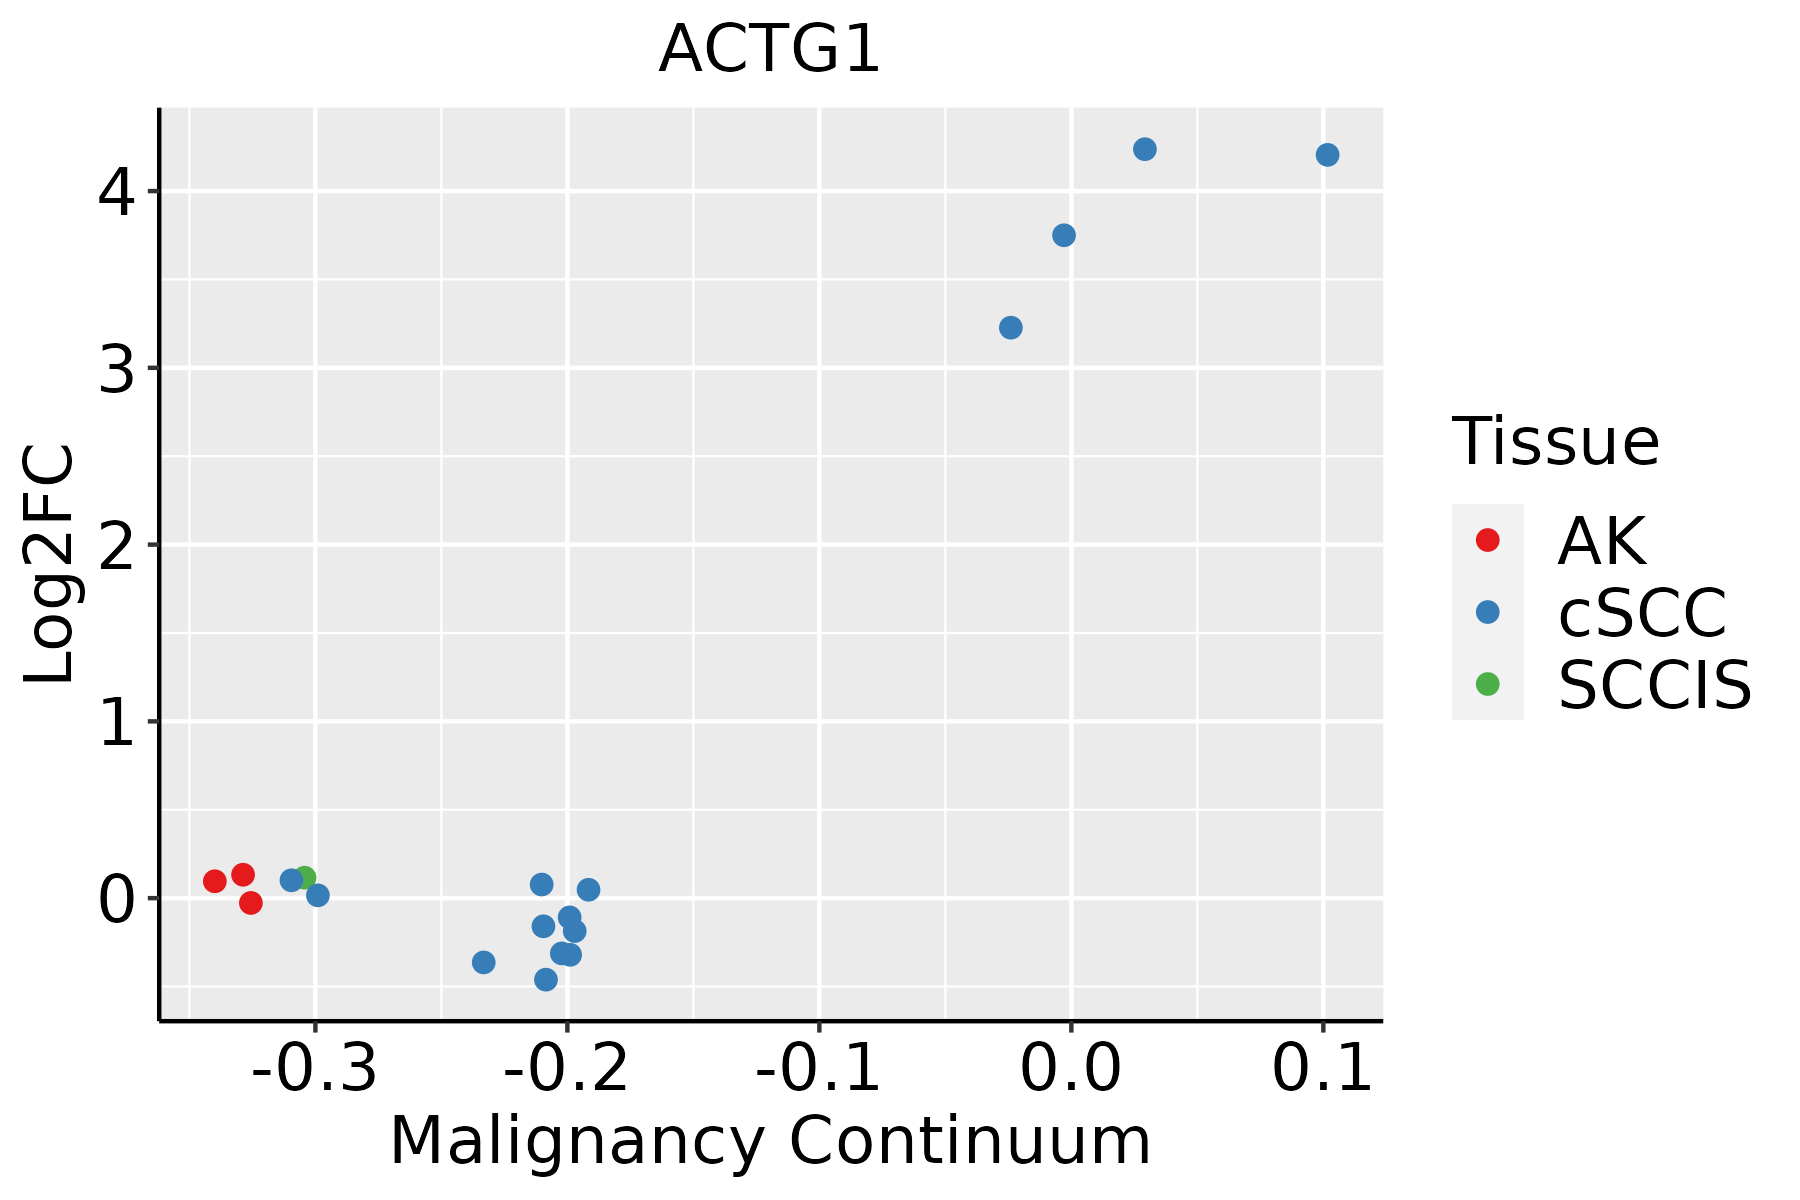 | AK: Actinic keratosis |
| cSCC: Cutaneous squamous cell carcinoma | ||
| SCCIS:squamous cell carcinoma in situ | ||
| Thyroid |  | ATC: Anaplastic thyroid cancer |
| HT: Hashimoto's thyroiditis | ||
| PTC: Papillary thyroid cancer |
| ∗log2FC in expression of this searched gene in stem-like cells from each diseased tissue sample relative to stem-like cells in normal samples in each tissue plotted against the malignancy continuum. Samples are colored based on if they are from different disease stage. |
Top |
Malignant transformation related pathway analysis |
| Find out the enriched GO biological processes and KEGG pathways involved in transition from healthy to precancer to cancer |
| Tissue | Disease Stage | Enriched GO biological Processes |
| Colorectum | AD |  |
| Colorectum | SER |  |
| Colorectum | MSS |  |
| Colorectum | MSI-H |  |
| Colorectum | FAP |  |
| ∗Top 15 enriched GO BP terms are showed in the bar plot of each disease state in each tissue. Each row represents a significant GO biological process which is colored according to the -log10(p.adjust). |
| Page: 1 2 3 4 5 6 7 8 9 |
| GO ID | Tissue | Disease Stage | Description | Gene Ratio | Bg Ratio | pvalue | p.adjust | Count |
| GO:00341099 | Breast | Precancer | homotypic cell-cell adhesion | 18/1080 | 90/18723 | 3.15e-06 | 1.03e-04 | 18 |
| GO:00420609 | Breast | Precancer | wound healing | 48/1080 | 422/18723 | 5.48e-06 | 1.63e-04 | 48 |
| GO:19029039 | Breast | Precancer | regulation of supramolecular fiber organization | 42/1080 | 383/18723 | 4.92e-05 | 1.04e-03 | 42 |
| GO:00329709 | Breast | Precancer | regulation of actin filament-based process | 42/1080 | 397/18723 | 1.11e-04 | 2.01e-03 | 42 |
| GO:00508789 | Breast | Precancer | regulation of body fluid levels | 40/1080 | 379/18723 | 1.68e-04 | 2.77e-03 | 40 |
| GO:00070159 | Breast | Precancer | actin filament organization | 44/1080 | 442/18723 | 3.02e-04 | 4.35e-03 | 44 |
| GO:00705278 | Breast | Precancer | platelet aggregation | 12/1080 | 67/18723 | 4.02e-04 | 5.43e-03 | 12 |
| GO:00356335 | Breast | Precancer | maintenance of blood-brain barrier | 8/1080 | 35/18723 | 6.95e-04 | 8.43e-03 | 8 |
| GO:19030367 | Breast | Precancer | positive regulation of response to wounding | 12/1080 | 72/18723 | 7.90e-04 | 9.30e-03 | 12 |
| GO:00329569 | Breast | Precancer | regulation of actin cytoskeleton organization | 36/1080 | 358/18723 | 8.56e-04 | 9.88e-03 | 36 |
| GO:01100539 | Breast | Precancer | regulation of actin filament organization | 29/1080 | 278/18723 | 1.50e-03 | 1.55e-02 | 29 |
| GO:00018956 | Breast | Precancer | retina homeostasis | 12/1080 | 79/18723 | 1.82e-03 | 1.79e-02 | 12 |
| GO:00903036 | Breast | Precancer | positive regulation of wound healing | 10/1080 | 59/18723 | 1.86e-03 | 1.81e-02 | 10 |
| GO:00514929 | Breast | Precancer | regulation of stress fiber assembly | 13/1080 | 91/18723 | 2.11e-03 | 2.00e-02 | 13 |
| GO:00075995 | Breast | Precancer | hemostasis | 24/1080 | 222/18723 | 2.31e-03 | 2.15e-02 | 24 |
| GO:00300389 | Breast | Precancer | contractile actin filament bundle assembly | 14/1080 | 106/18723 | 3.07e-03 | 2.62e-02 | 14 |
| GO:00431499 | Breast | Precancer | stress fiber assembly | 14/1080 | 106/18723 | 3.07e-03 | 2.62e-02 | 14 |
| GO:00018948 | Breast | Precancer | tissue homeostasis | 27/1080 | 268/18723 | 3.49e-03 | 2.90e-02 | 27 |
| GO:19030348 | Breast | Precancer | regulation of response to wounding | 19/1080 | 167/18723 | 3.60e-03 | 2.98e-02 | 19 |
| GO:00075965 | Breast | Precancer | blood coagulation | 23/1080 | 217/18723 | 3.61e-03 | 2.98e-02 | 23 |
| Page: 1 2 3 4 5 6 7 8 9 10 11 12 13 14 15 16 17 18 19 20 21 22 23 24 25 26 27 28 29 30 31 32 33 34 35 36 37 38 39 40 41 42 43 44 45 46 47 48 49 50 51 52 53 54 55 56 57 58 59 60 61 62 63 64 65 66 67 68 69 70 71 72 |
| Pathway ID | Tissue | Disease Stage | Description | Gene Ratio | Bg Ratio | pvalue | p.adjust | qvalue | Count |
| hsa045209 | Colorectum | FAP | Adherens junction | 45/1404 | 93/8465 | 8.66e-13 | 2.89e-10 | 1.76e-10 | 45 |
| hsa045309 | Colorectum | FAP | Tight junction | 60/1404 | 169/8465 | 1.40e-09 | 9.33e-08 | 5.67e-08 | 60 |
| hsa051319 | Colorectum | FAP | Shigellosis | 76/1404 | 247/8465 | 1.57e-08 | 5.84e-07 | 3.55e-07 | 76 |
| hsa051009 | Colorectum | FAP | Bacterial invasion of epithelial cells | 33/1404 | 77/8465 | 4.33e-08 | 1.11e-06 | 6.77e-07 | 33 |
| hsa051309 | Colorectum | FAP | Pathogenic Escherichia coli infection | 62/1404 | 197/8465 | 1.37e-07 | 3.08e-06 | 1.87e-06 | 62 |
| hsa047149 | Colorectum | FAP | Thermogenesis | 70/1404 | 232/8465 | 1.38e-07 | 3.08e-06 | 1.87e-06 | 70 |
| hsa045103 | Colorectum | FAP | Focal adhesion | 61/1404 | 203/8465 | 1.03e-06 | 2.15e-05 | 1.31e-05 | 61 |
| hsa049199 | Colorectum | FAP | Thyroid hormone signaling pathway | 41/1404 | 121/8465 | 2.28e-06 | 4.28e-05 | 2.60e-05 | 41 |
| hsa054189 | Colorectum | FAP | Fluid shear stress and atherosclerosis | 45/1404 | 139/8465 | 3.05e-06 | 4.63e-05 | 2.81e-05 | 45 |
| hsa048107 | Colorectum | FAP | Regulation of actin cytoskeleton | 65/1404 | 229/8465 | 4.07e-06 | 5.91e-05 | 3.59e-05 | 65 |
| hsa051357 | Colorectum | FAP | Yersinia infection | 43/1404 | 137/8465 | 1.21e-05 | 1.62e-04 | 9.86e-05 | 43 |
| hsa050149 | Colorectum | FAP | Amyotrophic lateral sclerosis | 91/1404 | 364/8465 | 1.84e-05 | 2.36e-04 | 1.44e-04 | 91 |
| hsa051329 | Colorectum | FAP | Salmonella infection | 67/1404 | 249/8465 | 2.04e-05 | 2.52e-04 | 1.53e-04 | 67 |
| hsa046707 | Colorectum | FAP | Leukocyte transendothelial migration | 37/1404 | 114/8465 | 2.12e-05 | 2.53e-04 | 1.54e-04 | 37 |
| hsa052057 | Colorectum | FAP | Proteoglycans in cancer | 57/1404 | 205/8465 | 3.05e-05 | 3.29e-04 | 2.00e-04 | 57 |
| hsa051109 | Colorectum | FAP | Vibrio cholerae infection | 19/1404 | 50/8465 | 2.24e-04 | 1.92e-03 | 1.17e-03 | 19 |
| hsa040157 | Colorectum | FAP | Rap1 signaling pathway | 53/1404 | 210/8465 | 7.93e-04 | 5.14e-03 | 3.13e-03 | 53 |
| hsa049717 | Colorectum | FAP | Gastric acid secretion | 24/1404 | 76/8465 | 8.95e-04 | 5.20e-03 | 3.16e-03 | 24 |
| hsa043903 | Colorectum | FAP | Hippo signaling pathway | 41/1404 | 157/8465 | 1.49e-03 | 7.91e-03 | 4.81e-03 | 41 |
| hsa052255 | Colorectum | FAP | Hepatocellular carcinoma | 43/1404 | 168/8465 | 1.78e-03 | 8.99e-03 | 5.47e-03 | 43 |
| Page: 1 2 3 4 5 6 7 8 9 10 11 12 13 14 15 16 17 18 19 20 21 22 23 24 25 26 27 28 29 30 31 32 33 34 35 36 37 38 39 40 41 42 43 44 45 |
Top |
Cell-cell communication analysis |
| Identification of potential cell-cell interactions between two cell types and their ligand-receptor pairs for different disease states |
| Ligand | Receptor | LRpair | Pathway | Tissue | Disease Stage |
| Page: 1 |
Top |
Single-cell gene regulatory network inference analysis |
| Find out the significant the regulons (TFs) and the target genes of each regulon across cell types for different disease states |
| TF | Cell Type | Tissue | Disease Stage | Target Gene | RSS | Regulon Activity |
| ∗The dot plots of a searched regulon are shown for all cell subpopulations in each disease state of each tissue based on the regulon specific score inferred using pySCENIC and by calculating the average expression. |
| Page: 1 |
Top |
Somatic mutation of malignant transformation related genes |
| Annotation of somatic variants for genes involved in malignant transformation |
| Hugo Symbol | Variant Class | Variant Classification | dbSNP RS | HGVSc | HGVSp | HGVSp Short | SWISSPROT | BIOTYPE | SIFT | PolyPhen | Tumor Sample Barcode | Tissue | Histology | Sex | Age | Stage | Therapy Types | Drugs | Outcome |
| ACTG1 | SNV | Missense_Mutation | novel | c.83G>T | p.Arg28Leu | p.R28L | P63261 | protein_coding | deleterious_low_confidence(0.01) | benign(0) | TCGA-AC-A2BK-01 | Breast | breast invasive carcinoma | Female | >=65 | III/IV | Chemotherapy | cytoxan | CR |
| ACTG1 | SNV | Missense_Mutation | novel | c.356N>C | p.Met119Thr | p.M119T | P63261 | protein_coding | deleterious_low_confidence(0.01) | probably_damaging(0.969) | TCGA-AC-A3QP-01 | Breast | breast invasive carcinoma | Female | >=65 | I/II | Hormone Therapy | femara | SD |
| ACTG1 | SNV | Missense_Mutation | novel | c.242N>G | p.Asp81Gly | p.D81G | P63261 | protein_coding | deleterious_low_confidence(0.01) | probably_damaging(0.998) | TCGA-C8-A3M8-01 | Breast | breast invasive carcinoma | Female | >=65 | I/II | Hormone Therapy | tamoxiphen | CR |
| ACTG1 | SNV | Missense_Mutation | c.727C>G | p.Pro243Ala | p.P243A | P63261 | protein_coding | deleterious_low_confidence(0) | probably_damaging(0.951) | TCGA-D8-A146-01 | Breast | breast invasive carcinoma | Female | <65 | I/II | Unknown | Unknown | SD | |
| ACTG1 | SNV | Missense_Mutation | c.614N>G | p.Glu205Gly | p.E205G | P63261 | protein_coding | deleterious_low_confidence(0.01) | benign(0.201) | TCGA-E2-A1LS-01 | Breast | breast invasive carcinoma | Female | <65 | I/II | Unspecific | Cyclophosphamide | SD | |
| ACTG1 | insertion | Nonsense_Mutation | novel | c.170_171insTGCACACACCTCATGCTAGCCTCACGAAACT | p.Glu57AspfsTer7 | p.E57Dfs*7 | P63261 | protein_coding | TCGA-A8-A08H-01 | Breast | breast invasive carcinoma | Female | >=65 | I/II | Unknown | Unknown | SD | ||
| ACTG1 | insertion | Frame_Shift_Ins | novel | c.379_380insCCCCCACGCCATCCTGCGTCTG | p.Phe127SerfsTer76 | p.F127Sfs*76 | P63261 | protein_coding | TCGA-A8-A093-01 | Breast | breast invasive carcinoma | Female | <65 | I/II | Hormone Therapy | tamoxiphen | SD | ||
| ACTG1 | insertion | Frame_Shift_Ins | novel | c.983_984insCGTGCTTGTGGAAGACAAGTCTGTGGCTT | p.Lys328AsnfsTer11 | p.K328Nfs*11 | P63261 | protein_coding | TCGA-B6-A0IK-01 | Breast | breast invasive carcinoma | Female | <65 | III/IV | Unknown | Unknown | PD | ||
| ACTG1 | SNV | Missense_Mutation | novel | c.965N>T | p.Pro322Leu | p.P322L | P63261 | protein_coding | deleterious_low_confidence(0.02) | possibly_damaging(0.466) | TCGA-2W-A8YY-01 | Cervix | cervical & endocervical cancer | Female | <65 | I/II | Chemotherapy | cisplatin | CR |
| ACTG1 | SNV | Missense_Mutation | c.757N>A | p.Glu253Lys | p.E253K | P63261 | protein_coding | deleterious_low_confidence(0.03) | probably_damaging(0.999) | TCGA-EK-A2PG-01 | Cervix | cervical & endocervical cancer | Female | >=65 | I/II | Unknown | Unknown | SD |
| Page: 1 2 3 4 5 |
Top |
Related drugs of malignant transformation related genes |
| Identification of chemicals and drugs interact with genes involved in malignant transfromation |
| (DGIdb 4.0) |
| Entrez ID | Symbol | Category | Interaction Types | Drug Claim Name | Drug Name | PMIDs |
| 71 | ACTG1 | NA | vincristine | VINCRISTINE | ||
| 71 | ACTG1 | NA | THYMOSIN BETA-4 |
| Page: 1 |

Copyright 2023-Present -The University of Texas Health Science Center at Houston |