| Tissue | Expression Dynamics | Abbreviation |
| Breast | 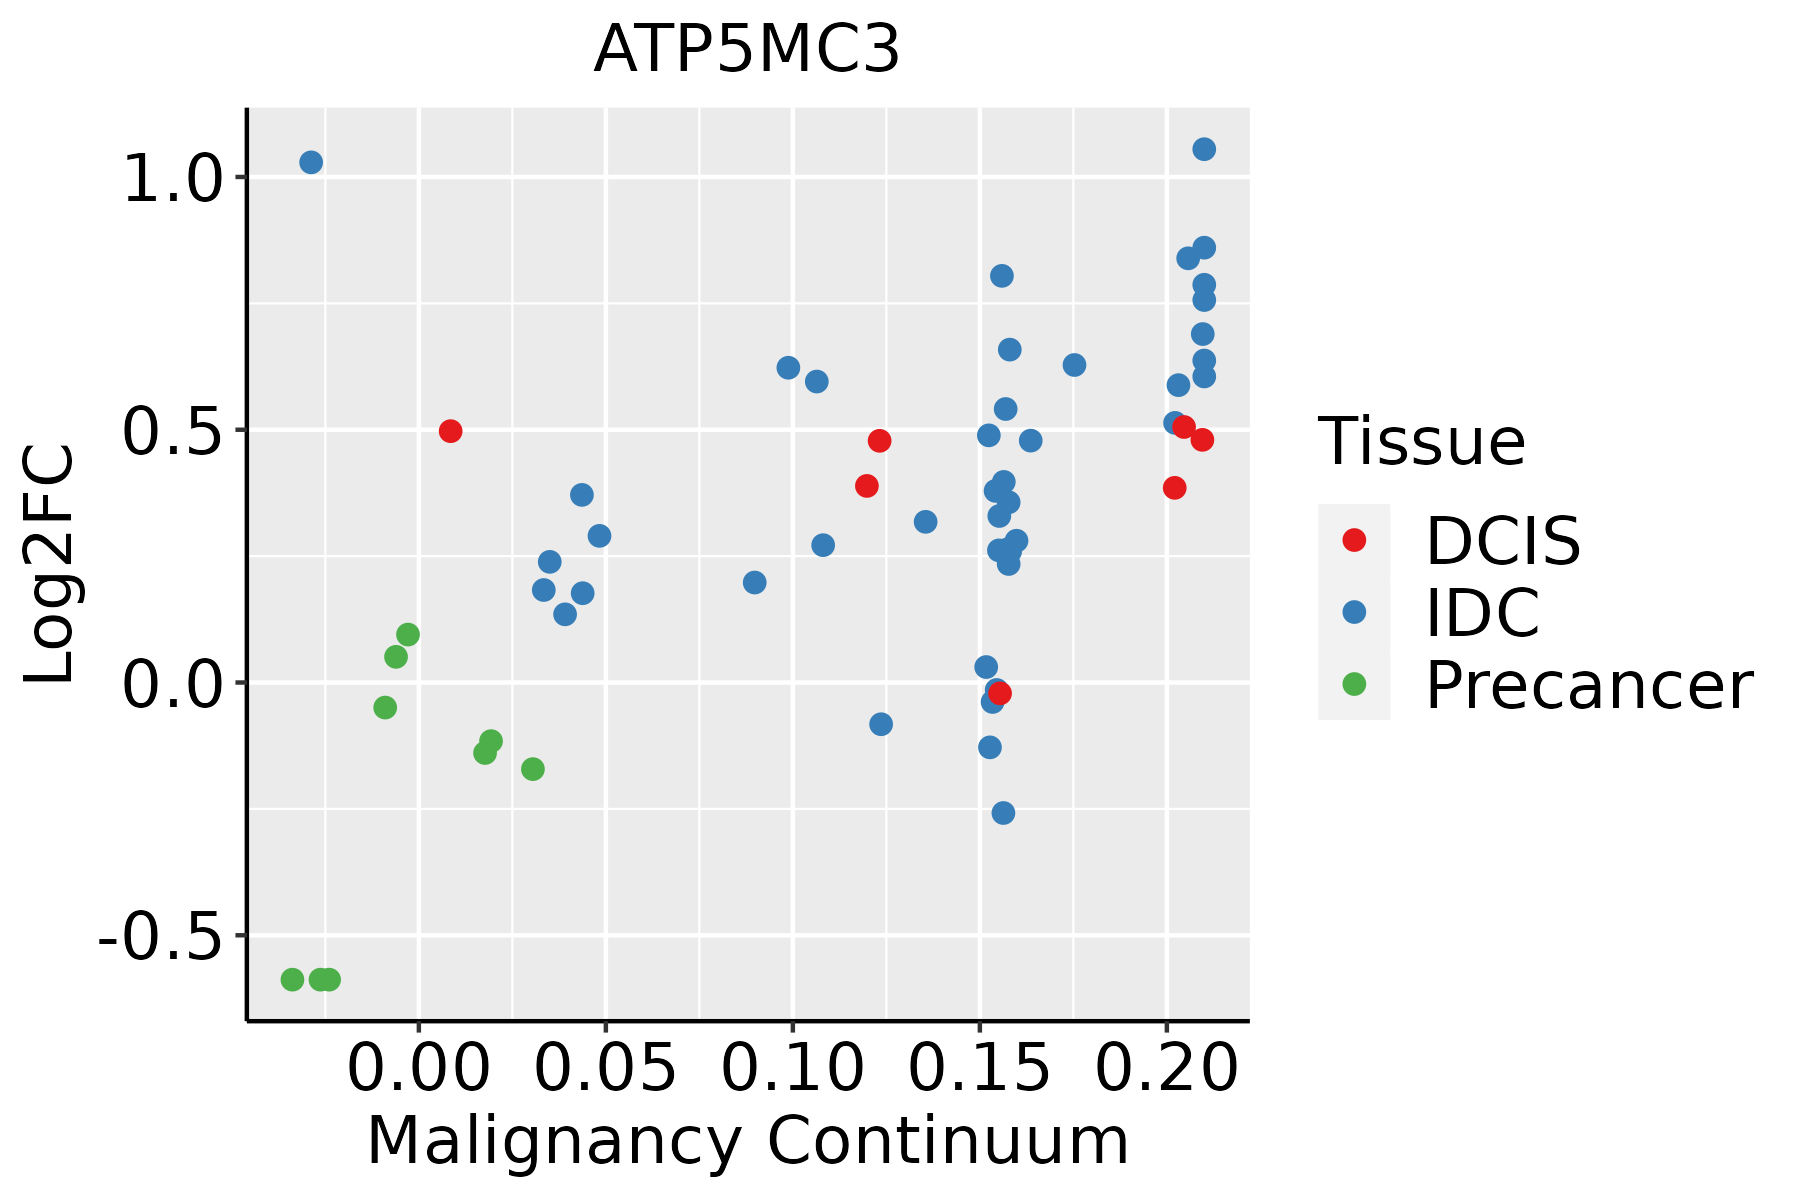 | IDC: Invasive ductal carcinoma |
| DCIS: Ductal carcinoma in situ |
| Precancer(BRCA1-mut): Precancerous lesion from BRCA1 mutation carriers |
| Cervix | 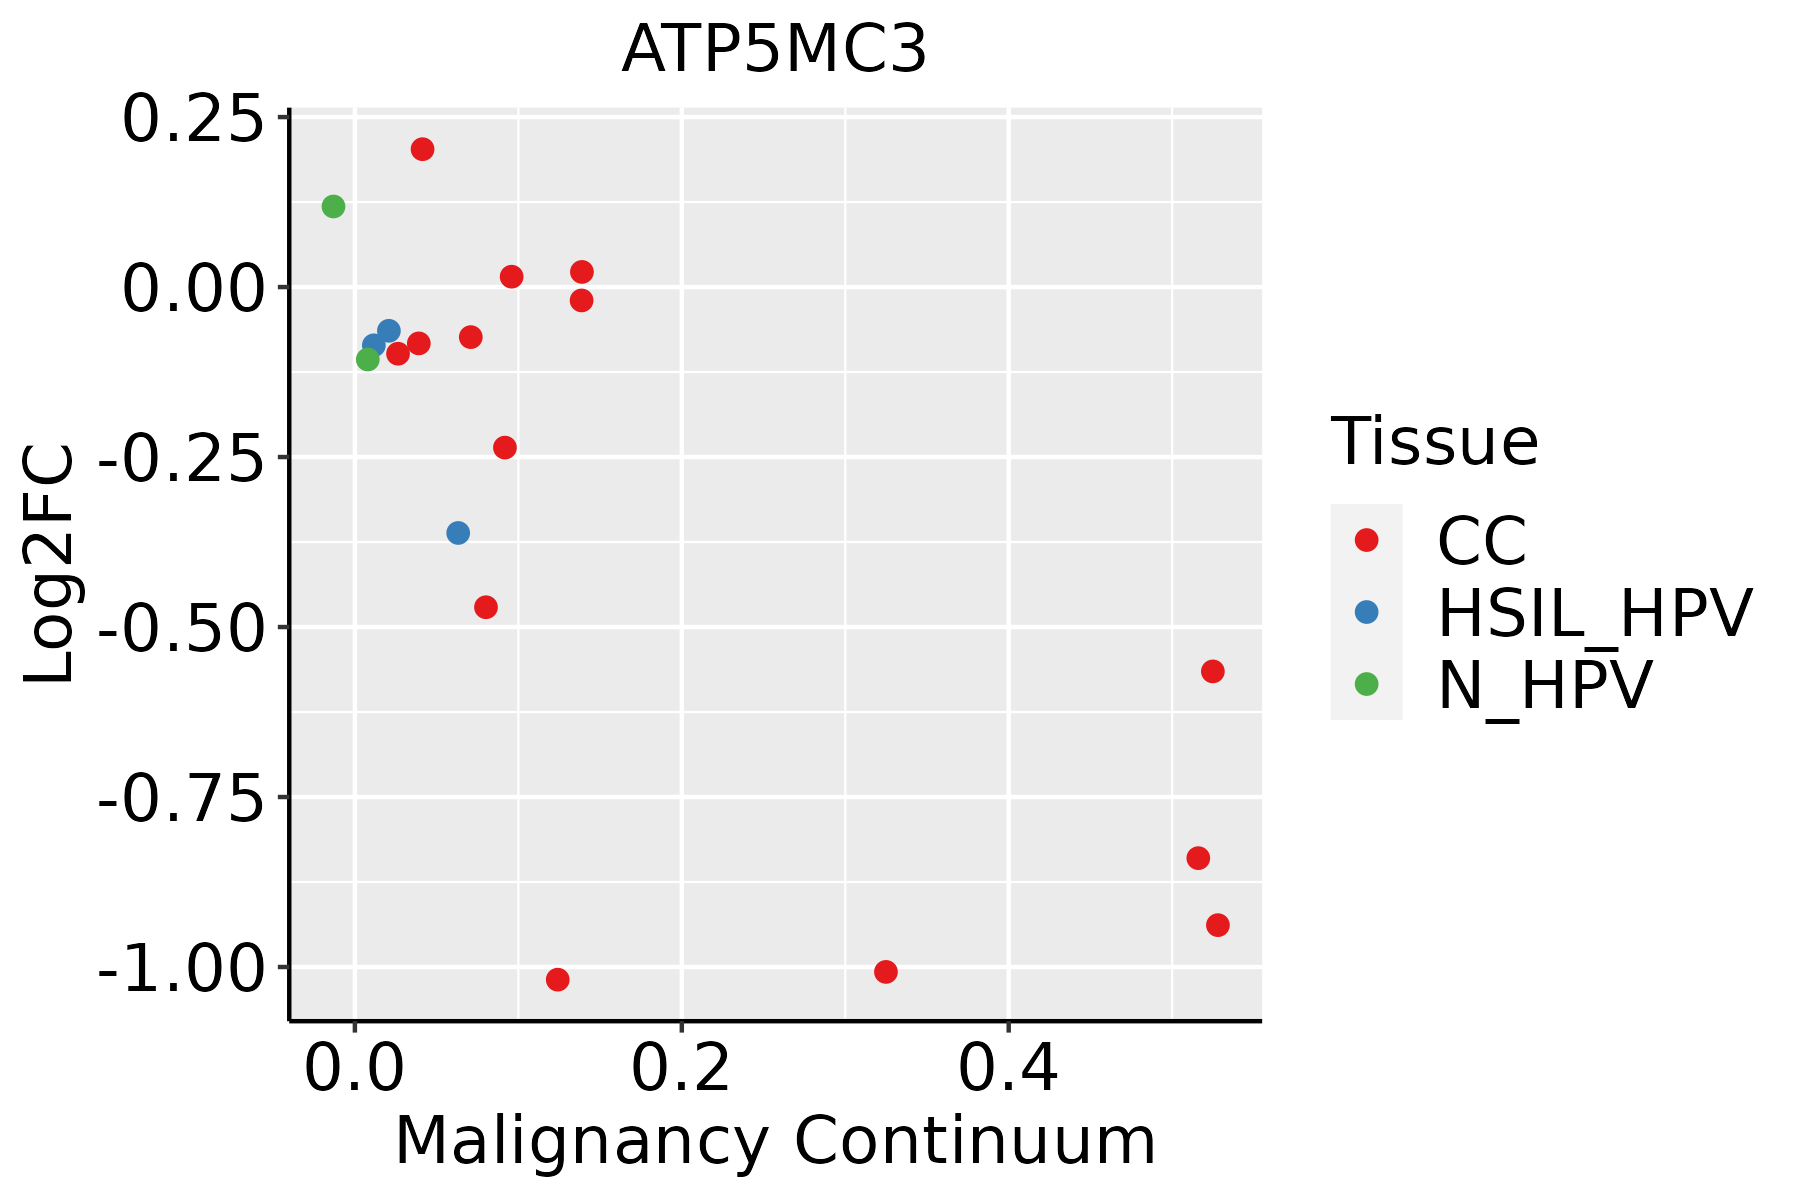 | CC: Cervix cancer |
| HSIL_HPV: HPV-infected high-grade squamous intraepithelial lesions |
| N_HPV: HPV-infected normal cervix |
| Colorectum (GSE201348) |  | FAP: Familial adenomatous polyposis |
| CRC: Colorectal cancer |
| Colorectum (HTA11) |  | AD: Adenomas |
| SER: Sessile serrated lesions |
| MSI-H: Microsatellite-high colorectal cancer |
| MSS: Microsatellite stable colorectal cancer |
| Endometrium |  | AEH: Atypical endometrial hyperplasia |
| EEC: Endometrioid Cancer |
| Esophagus |  | ESCC: Esophageal squamous cell carcinoma |
| HGIN: High-grade intraepithelial neoplasias |
| LGIN: Low-grade intraepithelial neoplasias |
| GC |  | CAG: Chronic atrophic gastritis |
| CAG with IM: Chronic atrophic gastritis with intestinal metaplasia |
| CSG: Chronic superficial gastritis |
| GC: Gastric cancer |
| SIM: Severe intestinal metaplasia |
| WIM: Wild intestinal metaplasia |
| Liver |  | HCC: Hepatocellular carcinoma |
| NAFLD: Non-alcoholic fatty liver disease |
| Prostate | 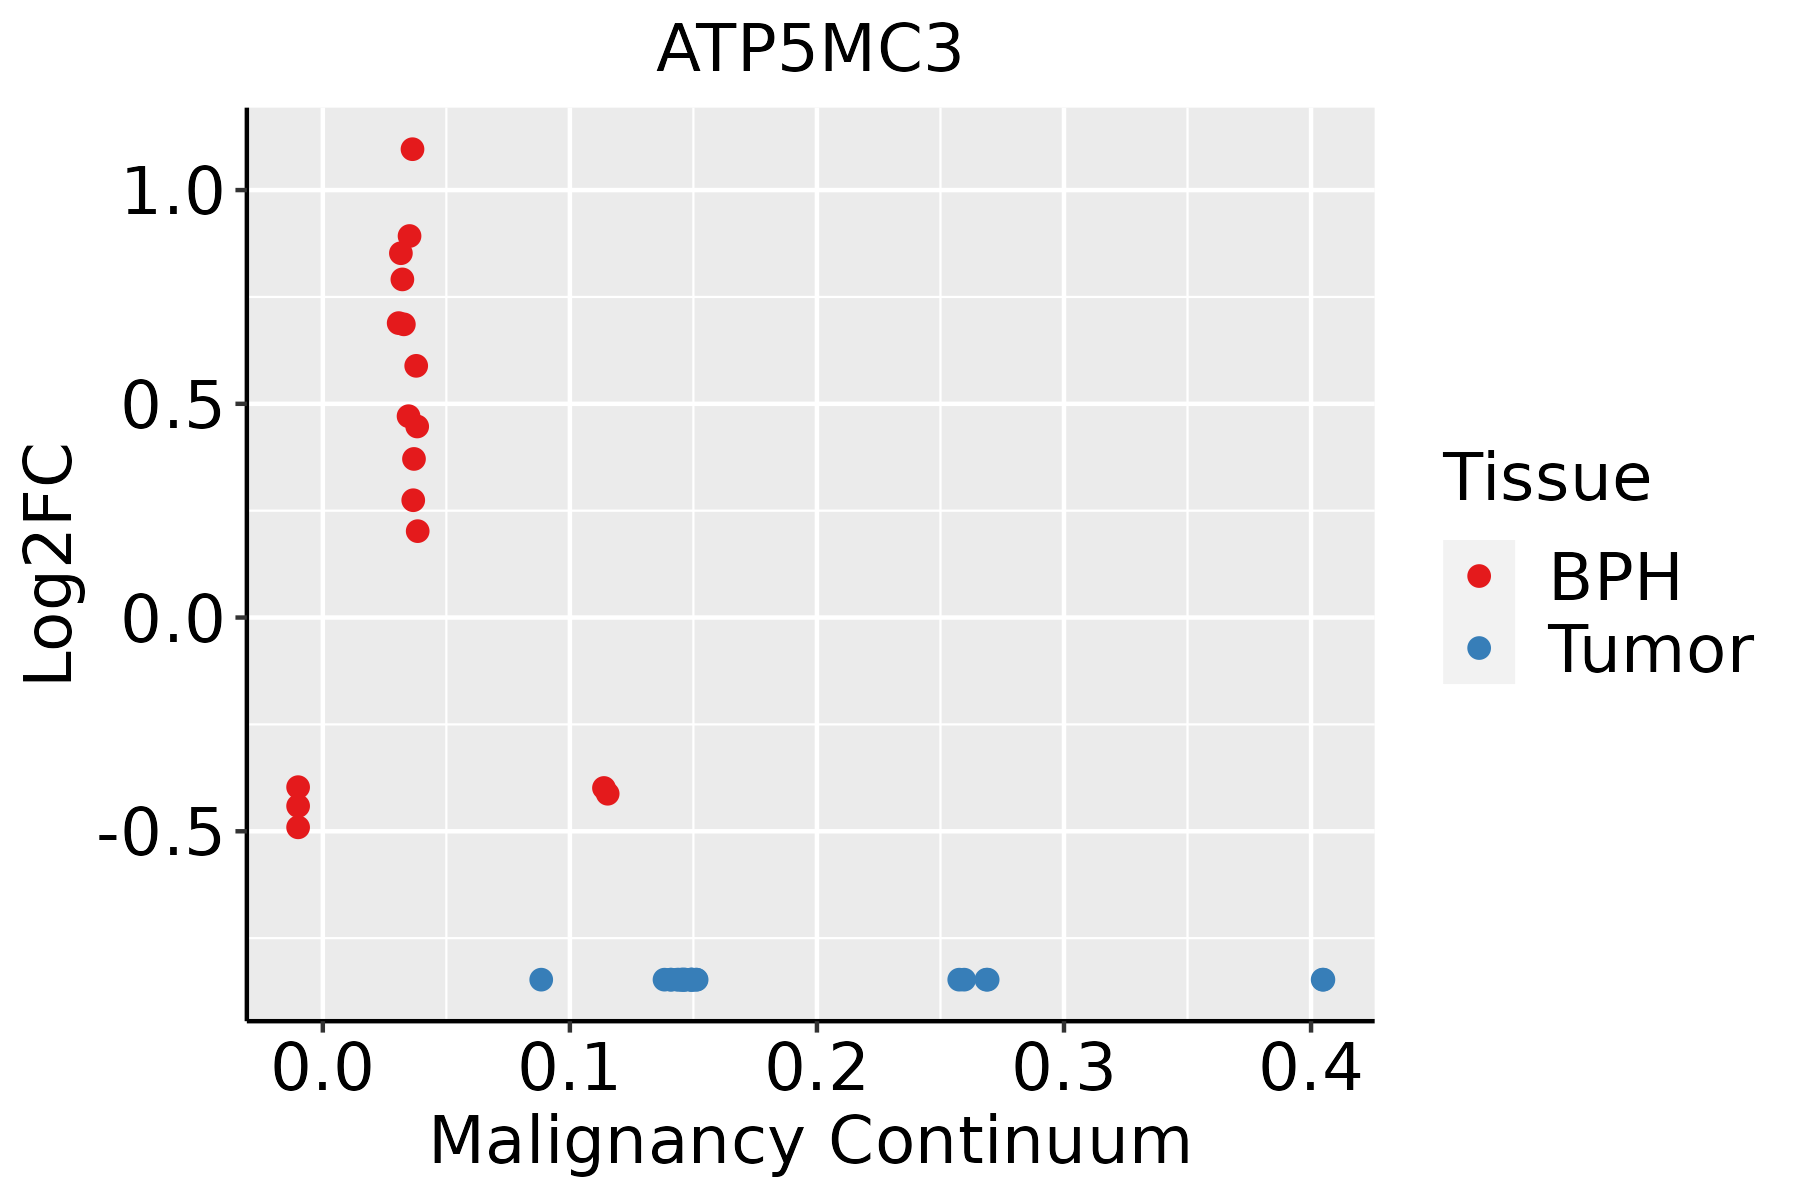 | BPH: Benign Prostatic Hyperplasia |
| Skin | 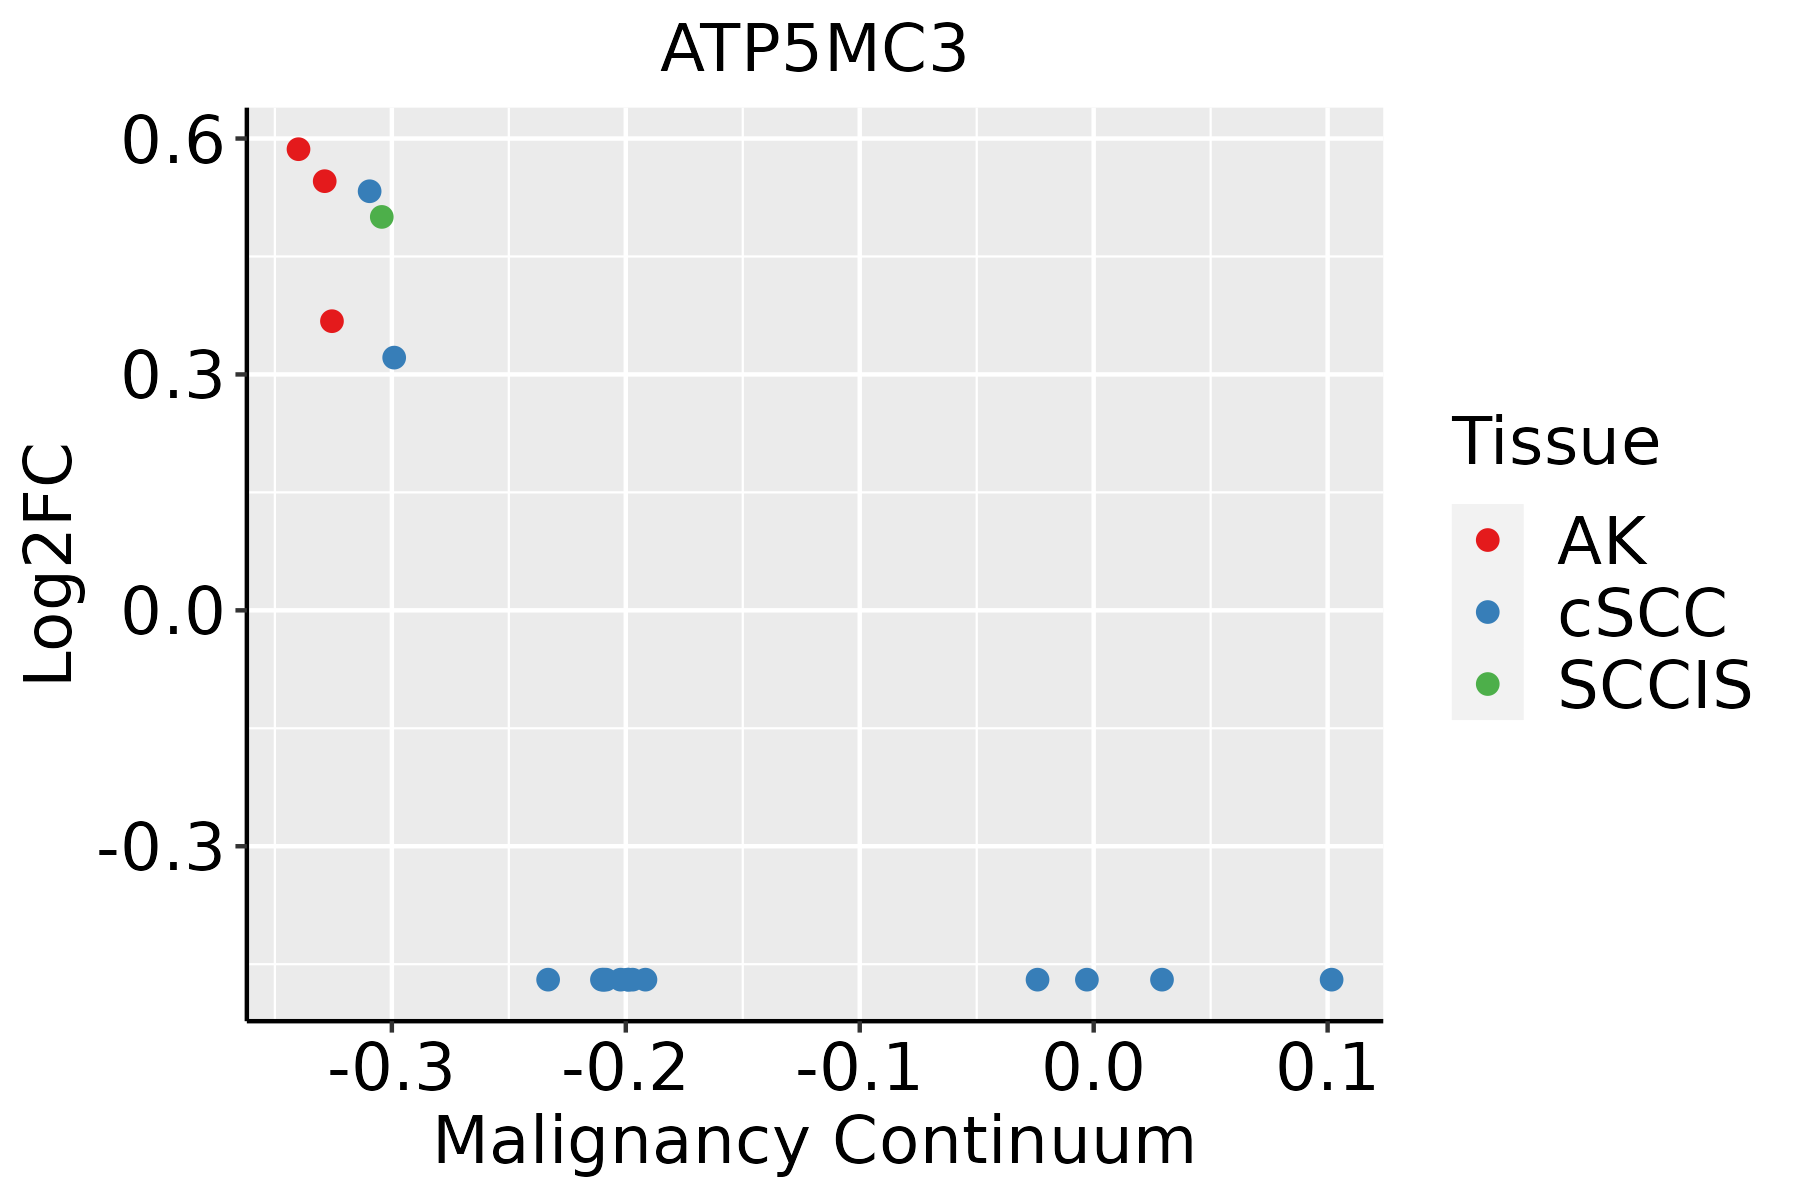 | AK: Actinic keratosis |
| cSCC: Cutaneous squamous cell carcinoma |
| SCCIS:squamous cell carcinoma in situ |
| Thyroid |  | ATC: Anaplastic thyroid cancer |
| HT: Hashimoto's thyroiditis |
| PTC: Papillary thyroid cancer |
| GO ID | Tissue | Disease Stage | Description | Gene Ratio | Bg Ratio | pvalue | p.adjust | Count |
| GO:00460349 | Breast | Precancer | ATP metabolic process | 82/1080 | 277/18723 | 1.94e-36 | 5.19e-33 | 82 |
| GO:19026008 | Breast | Precancer | proton transmembrane transport | 39/1080 | 157/18723 | 4.18e-15 | 1.18e-12 | 39 |
| GO:00159857 | Breast | Precancer | energy coupled proton transport, down electrochemical gradient | 16/1080 | 26/18723 | 4.15e-14 | 9.65e-12 | 16 |
| GO:00159867 | Breast | Precancer | ATP synthesis coupled proton transport | 16/1080 | 26/18723 | 4.15e-14 | 9.65e-12 | 16 |
| GO:00067547 | Breast | Precancer | ATP biosynthetic process | 21/1080 | 57/18723 | 2.31e-12 | 4.26e-10 | 21 |
| GO:00092067 | Breast | Precancer | purine ribonucleoside triphosphate biosynthetic process | 22/1080 | 68/18723 | 1.41e-11 | 1.88e-09 | 22 |
| GO:00091457 | Breast | Precancer | purine nucleoside triphosphate biosynthetic process | 22/1080 | 69/18723 | 1.95e-11 | 2.43e-09 | 22 |
| GO:00092017 | Breast | Precancer | ribonucleoside triphosphate biosynthetic process | 22/1080 | 74/18723 | 9.18e-11 | 1.00e-08 | 22 |
| GO:00091448 | Breast | Precancer | purine nucleoside triphosphate metabolic process | 24/1080 | 88/18723 | 9.66e-11 | 1.03e-08 | 24 |
| GO:00092057 | Breast | Precancer | purine ribonucleoside triphosphate metabolic process | 23/1080 | 82/18723 | 1.27e-10 | 1.34e-08 | 23 |
| GO:00091427 | Breast | Precancer | nucleoside triphosphate biosynthetic process | 23/1080 | 85/18723 | 2.82e-10 | 2.69e-08 | 23 |
| GO:00091997 | Breast | Precancer | ribonucleoside triphosphate metabolic process | 23/1080 | 89/18723 | 7.65e-10 | 6.66e-08 | 23 |
| GO:00091418 | Breast | Precancer | nucleoside triphosphate metabolic process | 26/1080 | 112/18723 | 7.72e-10 | 6.66e-08 | 26 |
| GO:00196938 | Breast | Precancer | ribose phosphate metabolic process | 49/1080 | 396/18723 | 3.81e-07 | 1.78e-05 | 49 |
| GO:00091528 | Breast | Precancer | purine ribonucleotide biosynthetic process | 28/1080 | 169/18723 | 4.17e-07 | 1.89e-05 | 28 |
| GO:00463907 | Breast | Precancer | ribose phosphate biosynthetic process | 30/1080 | 190/18723 | 4.75e-07 | 2.11e-05 | 30 |
| GO:00092607 | Breast | Precancer | ribonucleotide biosynthetic process | 29/1080 | 182/18723 | 6.05e-07 | 2.55e-05 | 29 |
| GO:00091509 | Breast | Precancer | purine ribonucleotide metabolic process | 46/1080 | 368/18723 | 6.47e-07 | 2.71e-05 | 46 |
| GO:00091179 | Breast | Precancer | nucleotide metabolic process | 56/1080 | 489/18723 | 7.40e-07 | 3.00e-05 | 56 |
| GO:00092598 | Breast | Precancer | ribonucleotide metabolic process | 47/1080 | 385/18723 | 9.69e-07 | 3.84e-05 | 47 |
| Pathway ID | Tissue | Disease Stage | Description | Gene Ratio | Bg Ratio | pvalue | p.adjust | qvalue | Count |
| hsa0019032 | Liver | HCC | Oxidative phosphorylation | 103/4020 | 134/8465 | 2.39e-12 | 5.01e-11 | 2.79e-11 | 103 |
| hsa0502232 | Liver | HCC | Pathways of neurodegeneration - multiple diseases | 298/4020 | 476/8465 | 6.59e-12 | 1.30e-10 | 7.22e-11 | 298 |
| hsa0501228 | Prostate | BPH | Parkinson disease | 143/1718 | 266/8465 | 1.19e-34 | 3.94e-32 | 2.44e-32 | 143 |
| hsa0502026 | Prostate | BPH | Prion disease | 141/1718 | 273/8465 | 1.11e-31 | 1.23e-29 | 7.58e-30 | 141 |
| hsa0501626 | Prostate | BPH | Huntington disease | 149/1718 | 306/8465 | 8.82e-30 | 7.27e-28 | 4.50e-28 | 149 |
| hsa0019026 | Prostate | BPH | Oxidative phosphorylation | 83/1718 | 134/8465 | 3.75e-26 | 2.48e-24 | 1.53e-24 | 83 |
| hsa0520828 | Prostate | BPH | Chemical carcinogenesis - reactive oxygen species | 114/1718 | 223/8465 | 3.05e-25 | 1.44e-23 | 8.91e-24 | 114 |
| hsa0501026 | Prostate | BPH | Alzheimer disease | 165/1718 | 384/8465 | 4.03e-25 | 1.66e-23 | 1.03e-23 | 165 |
| hsa0541527 | Prostate | BPH | Diabetic cardiomyopathy | 102/1718 | 203/8465 | 6.06e-22 | 2.00e-20 | 1.24e-20 | 102 |
| hsa0501426 | Prostate | BPH | Amyotrophic lateral sclerosis | 151/1718 | 364/8465 | 3.37e-21 | 1.01e-19 | 6.25e-20 | 151 |
| hsa0471428 | Prostate | BPH | Thermogenesis | 110/1718 | 232/8465 | 5.16e-21 | 1.42e-19 | 8.78e-20 | 110 |
| hsa0502226 | Prostate | BPH | Pathways of neurodegeneration - multiple diseases | 180/1718 | 476/8465 | 7.70e-20 | 1.81e-18 | 1.12e-18 | 180 |
| hsa05012112 | Prostate | BPH | Parkinson disease | 143/1718 | 266/8465 | 1.19e-34 | 3.94e-32 | 2.44e-32 | 143 |
| hsa05020111 | Prostate | BPH | Prion disease | 141/1718 | 273/8465 | 1.11e-31 | 1.23e-29 | 7.58e-30 | 141 |
| hsa05016111 | Prostate | BPH | Huntington disease | 149/1718 | 306/8465 | 8.82e-30 | 7.27e-28 | 4.50e-28 | 149 |
| hsa00190111 | Prostate | BPH | Oxidative phosphorylation | 83/1718 | 134/8465 | 3.75e-26 | 2.48e-24 | 1.53e-24 | 83 |
| hsa05208113 | Prostate | BPH | Chemical carcinogenesis - reactive oxygen species | 114/1718 | 223/8465 | 3.05e-25 | 1.44e-23 | 8.91e-24 | 114 |
| hsa05010111 | Prostate | BPH | Alzheimer disease | 165/1718 | 384/8465 | 4.03e-25 | 1.66e-23 | 1.03e-23 | 165 |
| hsa05415112 | Prostate | BPH | Diabetic cardiomyopathy | 102/1718 | 203/8465 | 6.06e-22 | 2.00e-20 | 1.24e-20 | 102 |
| hsa05014111 | Prostate | BPH | Amyotrophic lateral sclerosis | 151/1718 | 364/8465 | 3.37e-21 | 1.01e-19 | 6.25e-20 | 151 |


