| Tissue | Expression Dynamics | Abbreviation |
| Cervix |  | CC: Cervix cancer |
| HSIL_HPV: HPV-infected high-grade squamous intraepithelial lesions |
| N_HPV: HPV-infected normal cervix |
| Colorectum (GSE201348) | 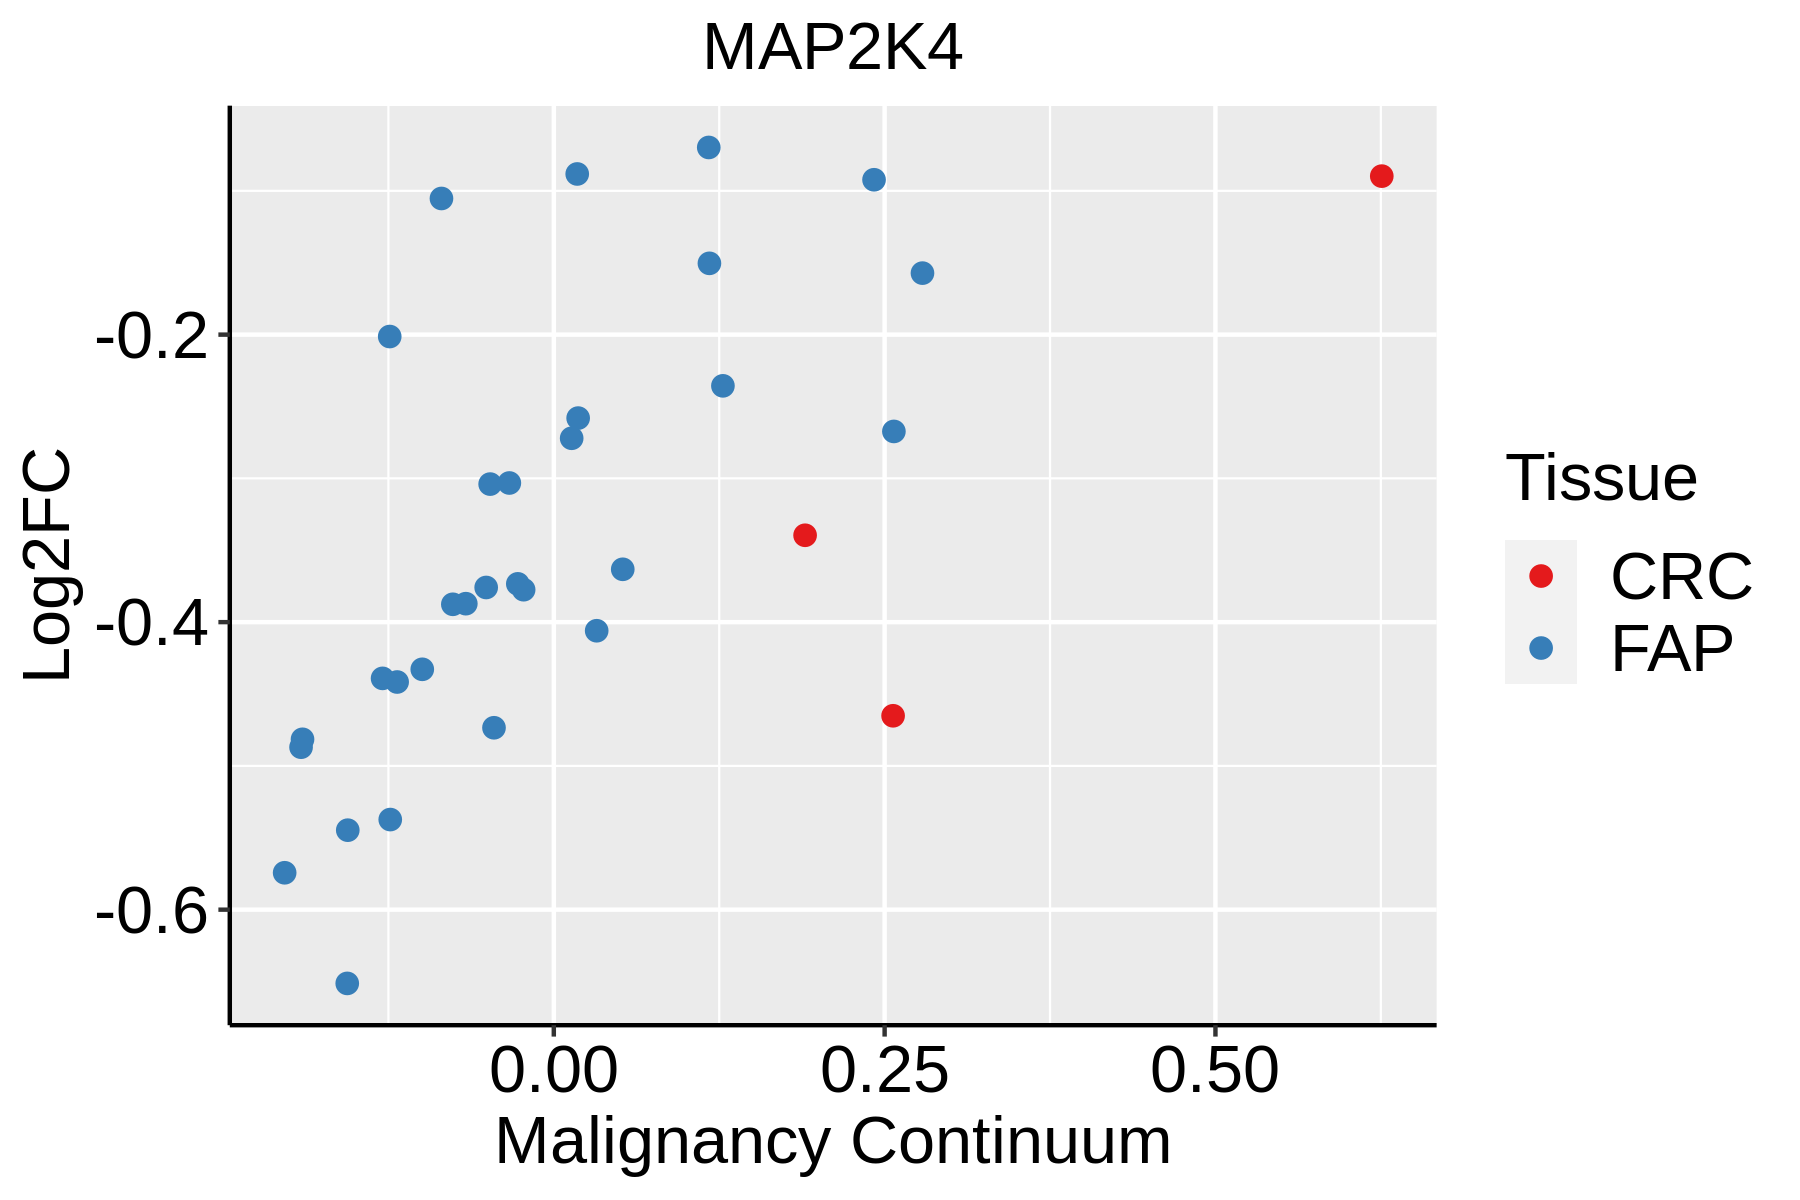 | FAP: Familial adenomatous polyposis |
| CRC: Colorectal cancer |
| Colorectum (HTA11) |  | AD: Adenomas |
| SER: Sessile serrated lesions |
| MSI-H: Microsatellite-high colorectal cancer |
| MSS: Microsatellite stable colorectal cancer |
| Endometrium | 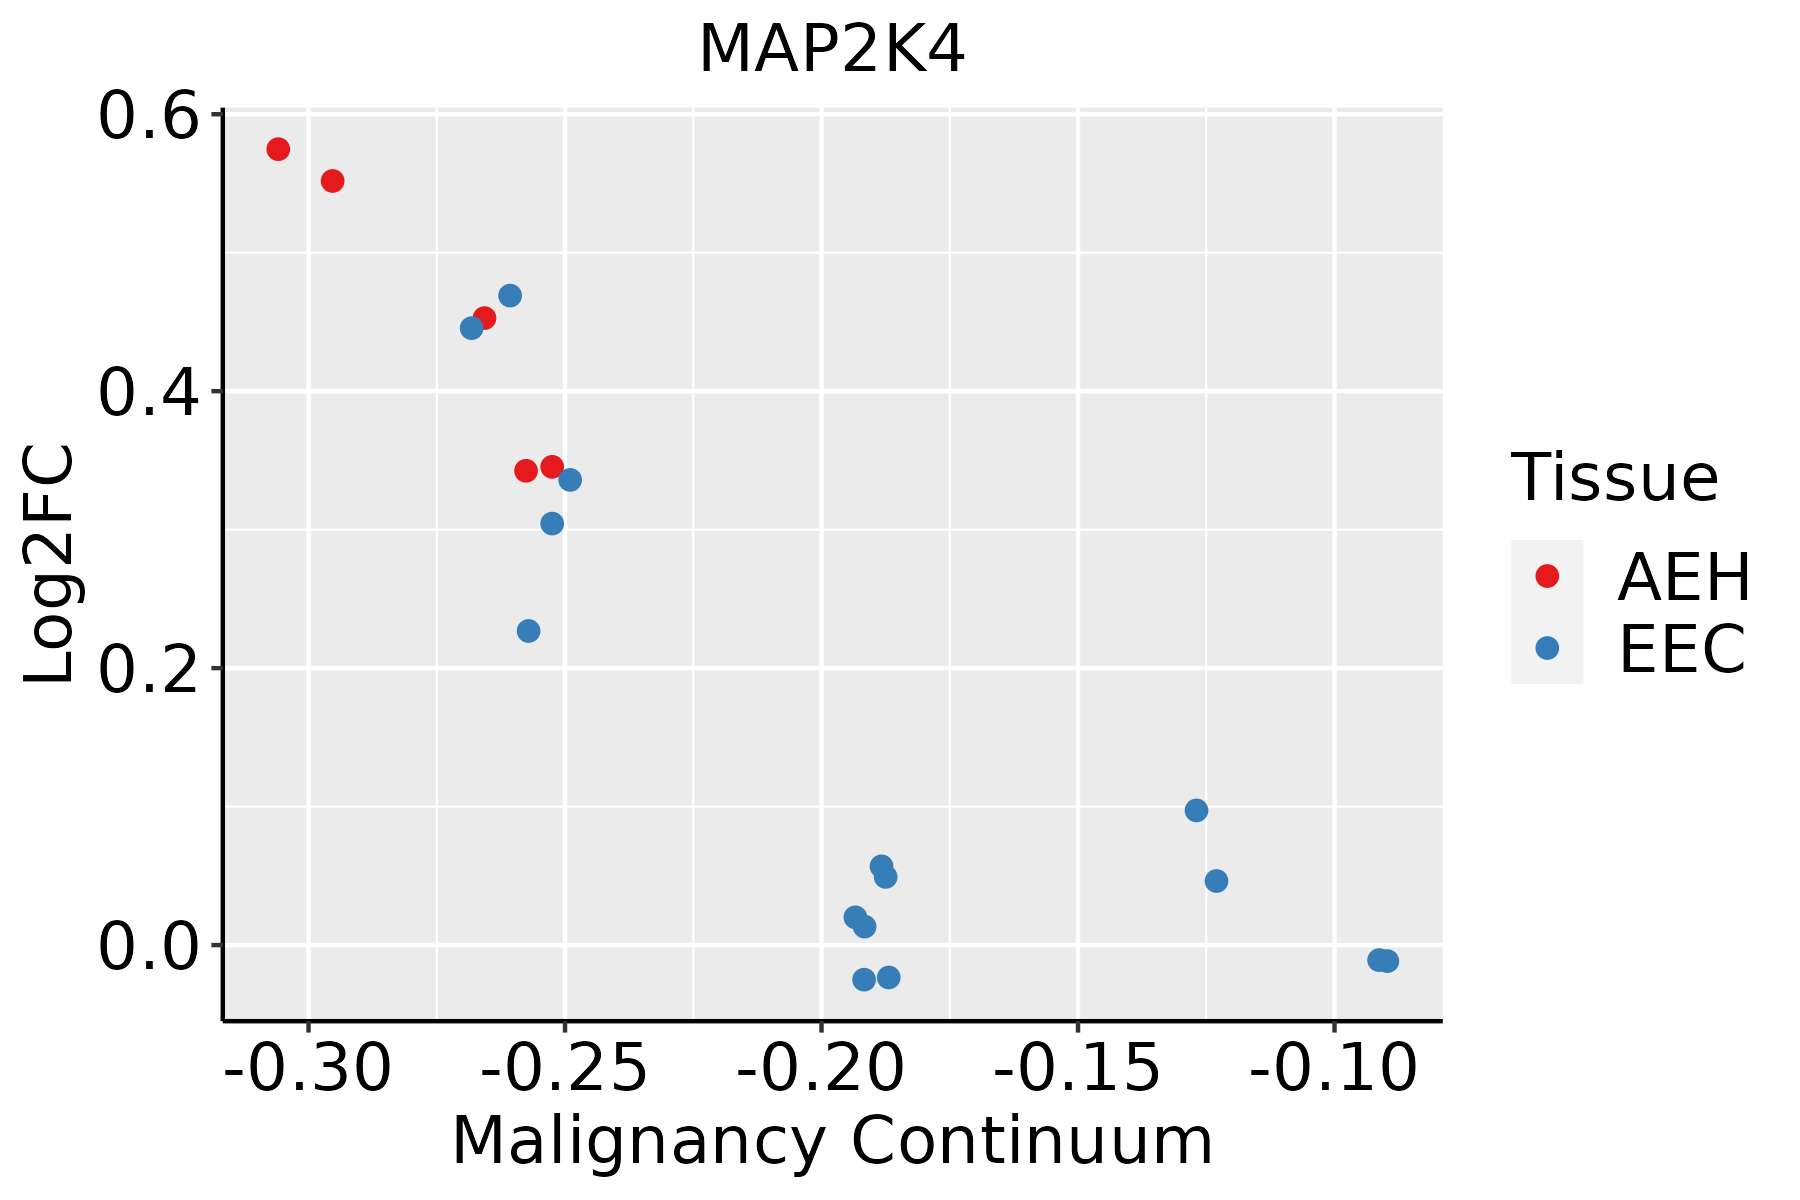 | AEH: Atypical endometrial hyperplasia |
| EEC: Endometrioid Cancer |
| Esophagus |  | ESCC: Esophageal squamous cell carcinoma |
| HGIN: High-grade intraepithelial neoplasias |
| LGIN: Low-grade intraepithelial neoplasias |
| Liver | 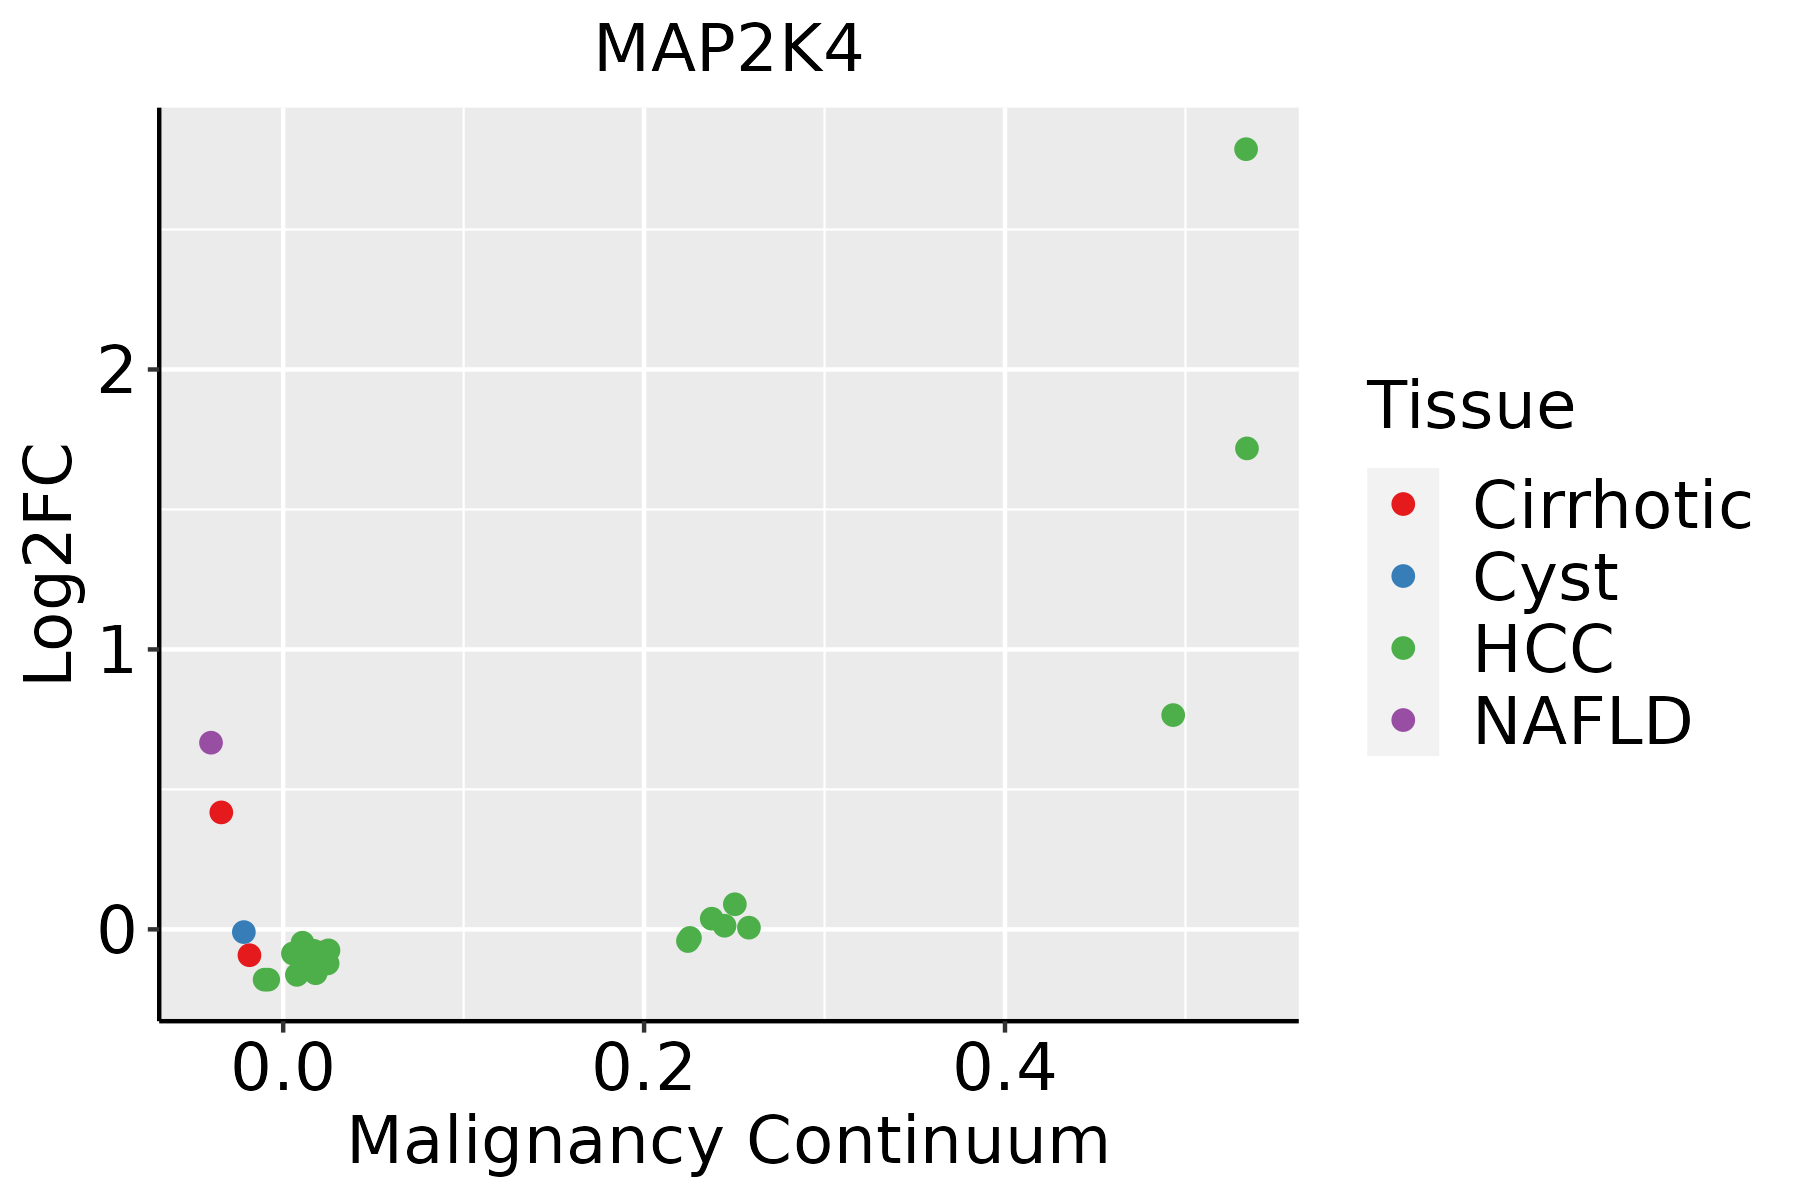 | HCC: Hepatocellular carcinoma |
| NAFLD: Non-alcoholic fatty liver disease |
| Lung | 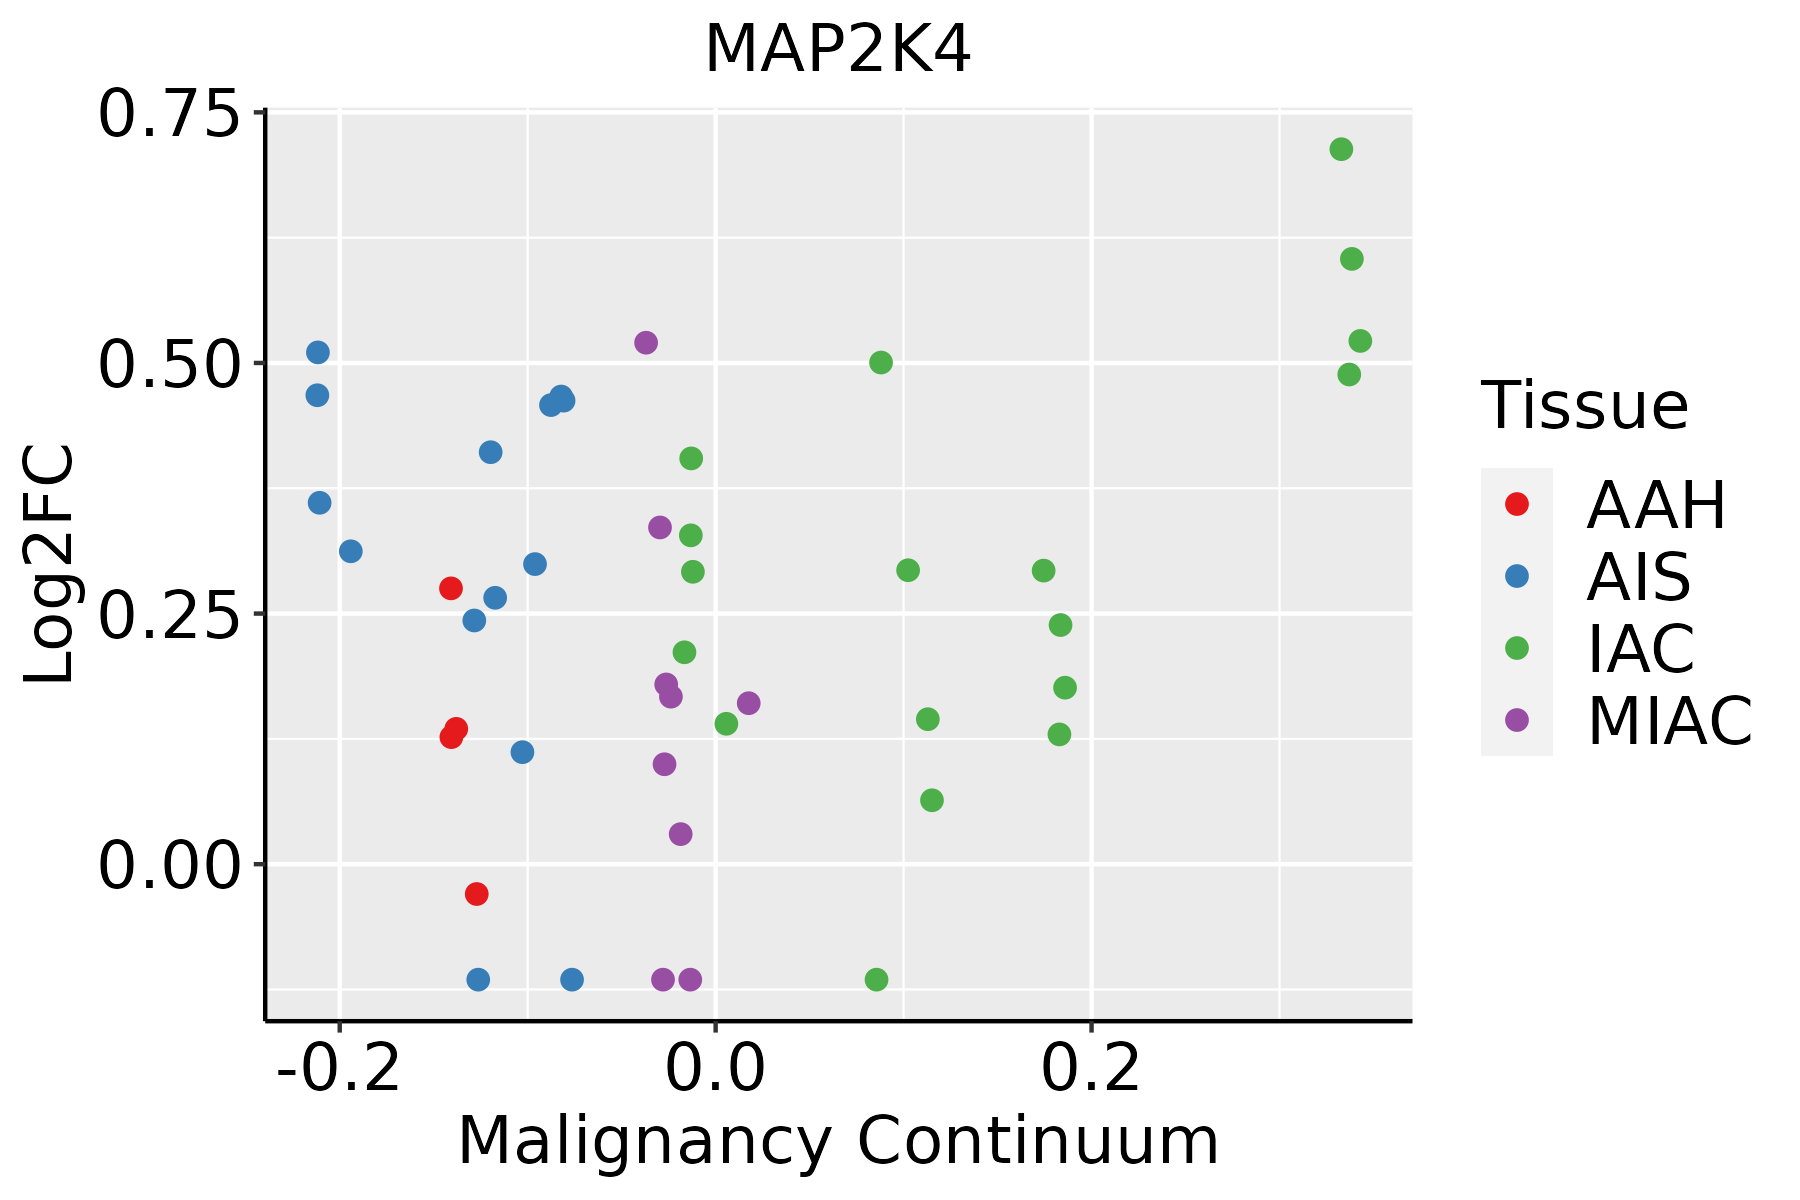 | AAH: Atypical adenomatous hyperplasia |
| AIS: Adenocarcinoma in situ |
| IAC: Invasive lung adenocarcinoma |
| MIA: Minimally invasive adenocarcinoma |
| Prostate | 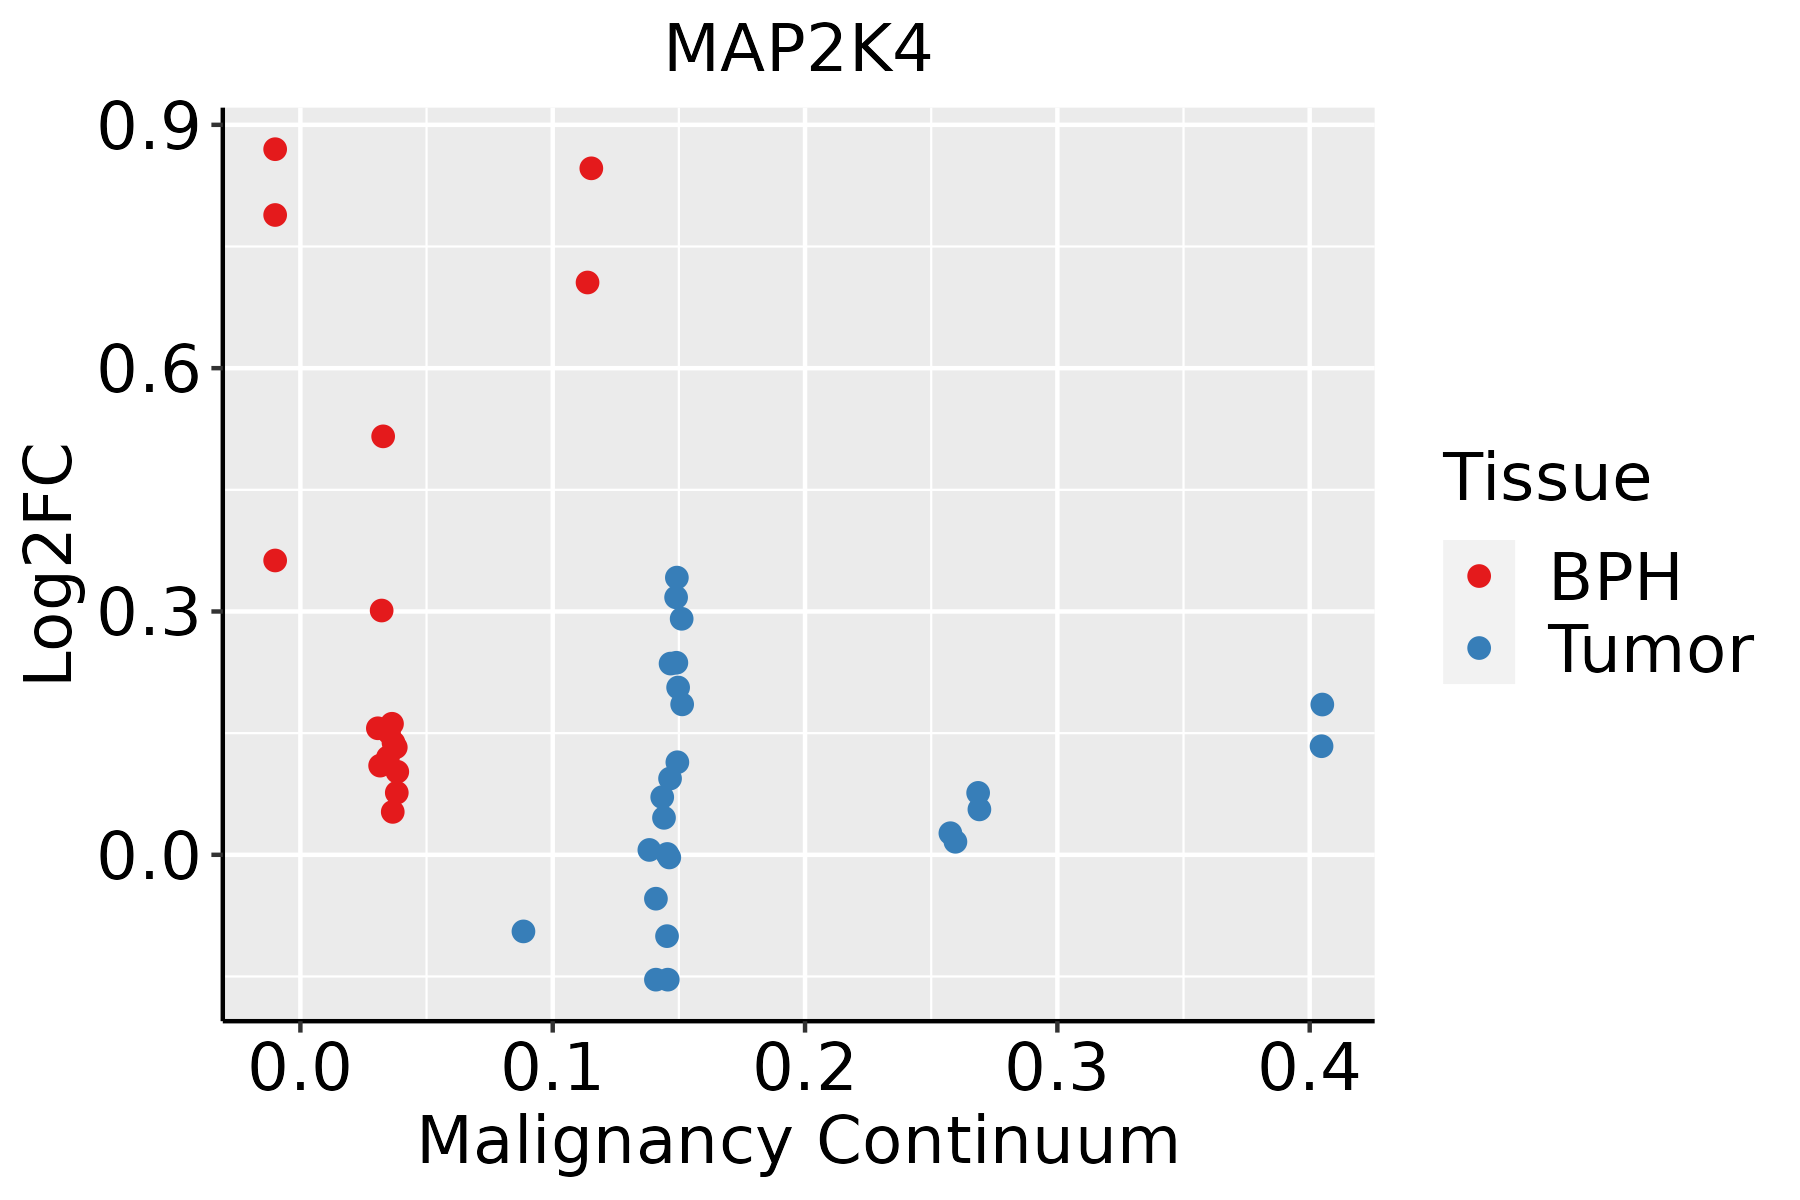 | BPH: Benign Prostatic Hyperplasia |
| Skin | 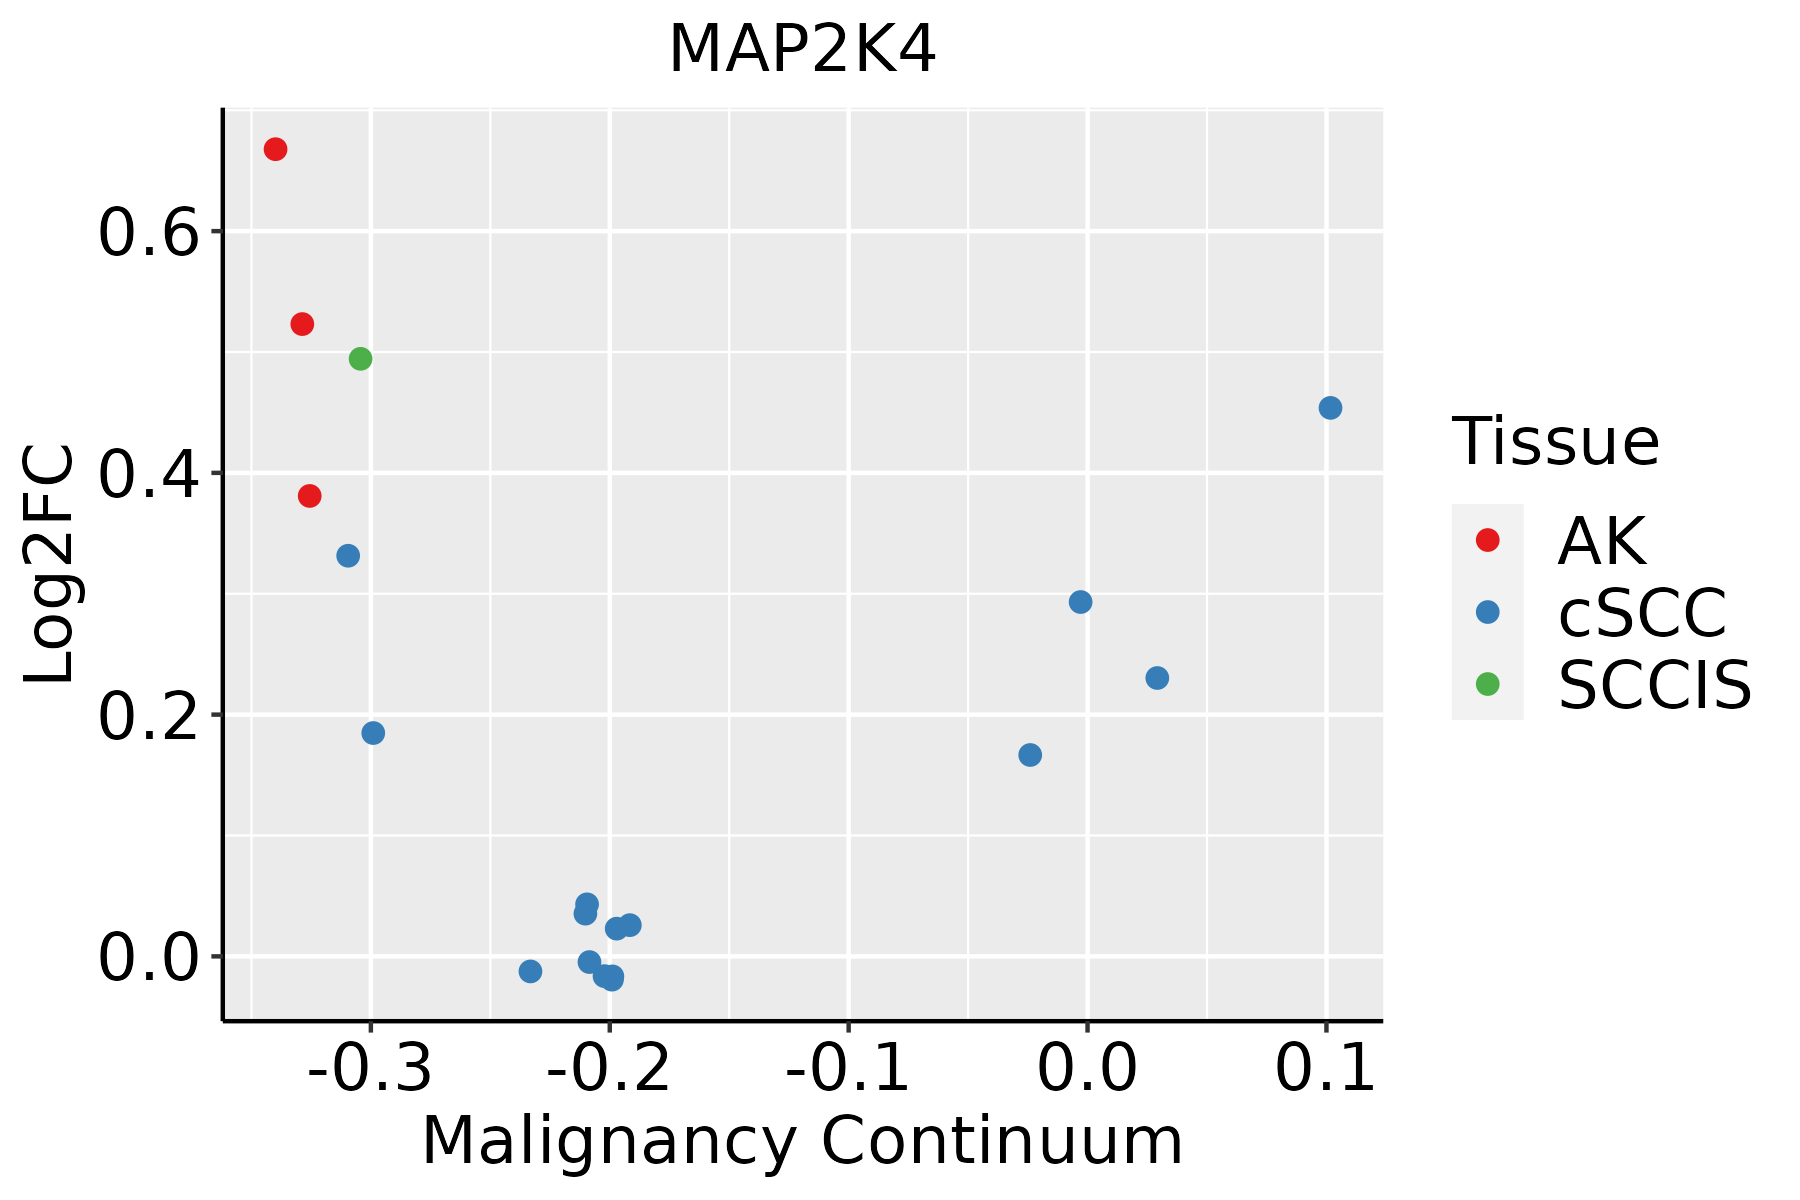 | AK: Actinic keratosis |
| cSCC: Cutaneous squamous cell carcinoma |
| SCCIS:squamous cell carcinoma in situ |
| Thyroid | 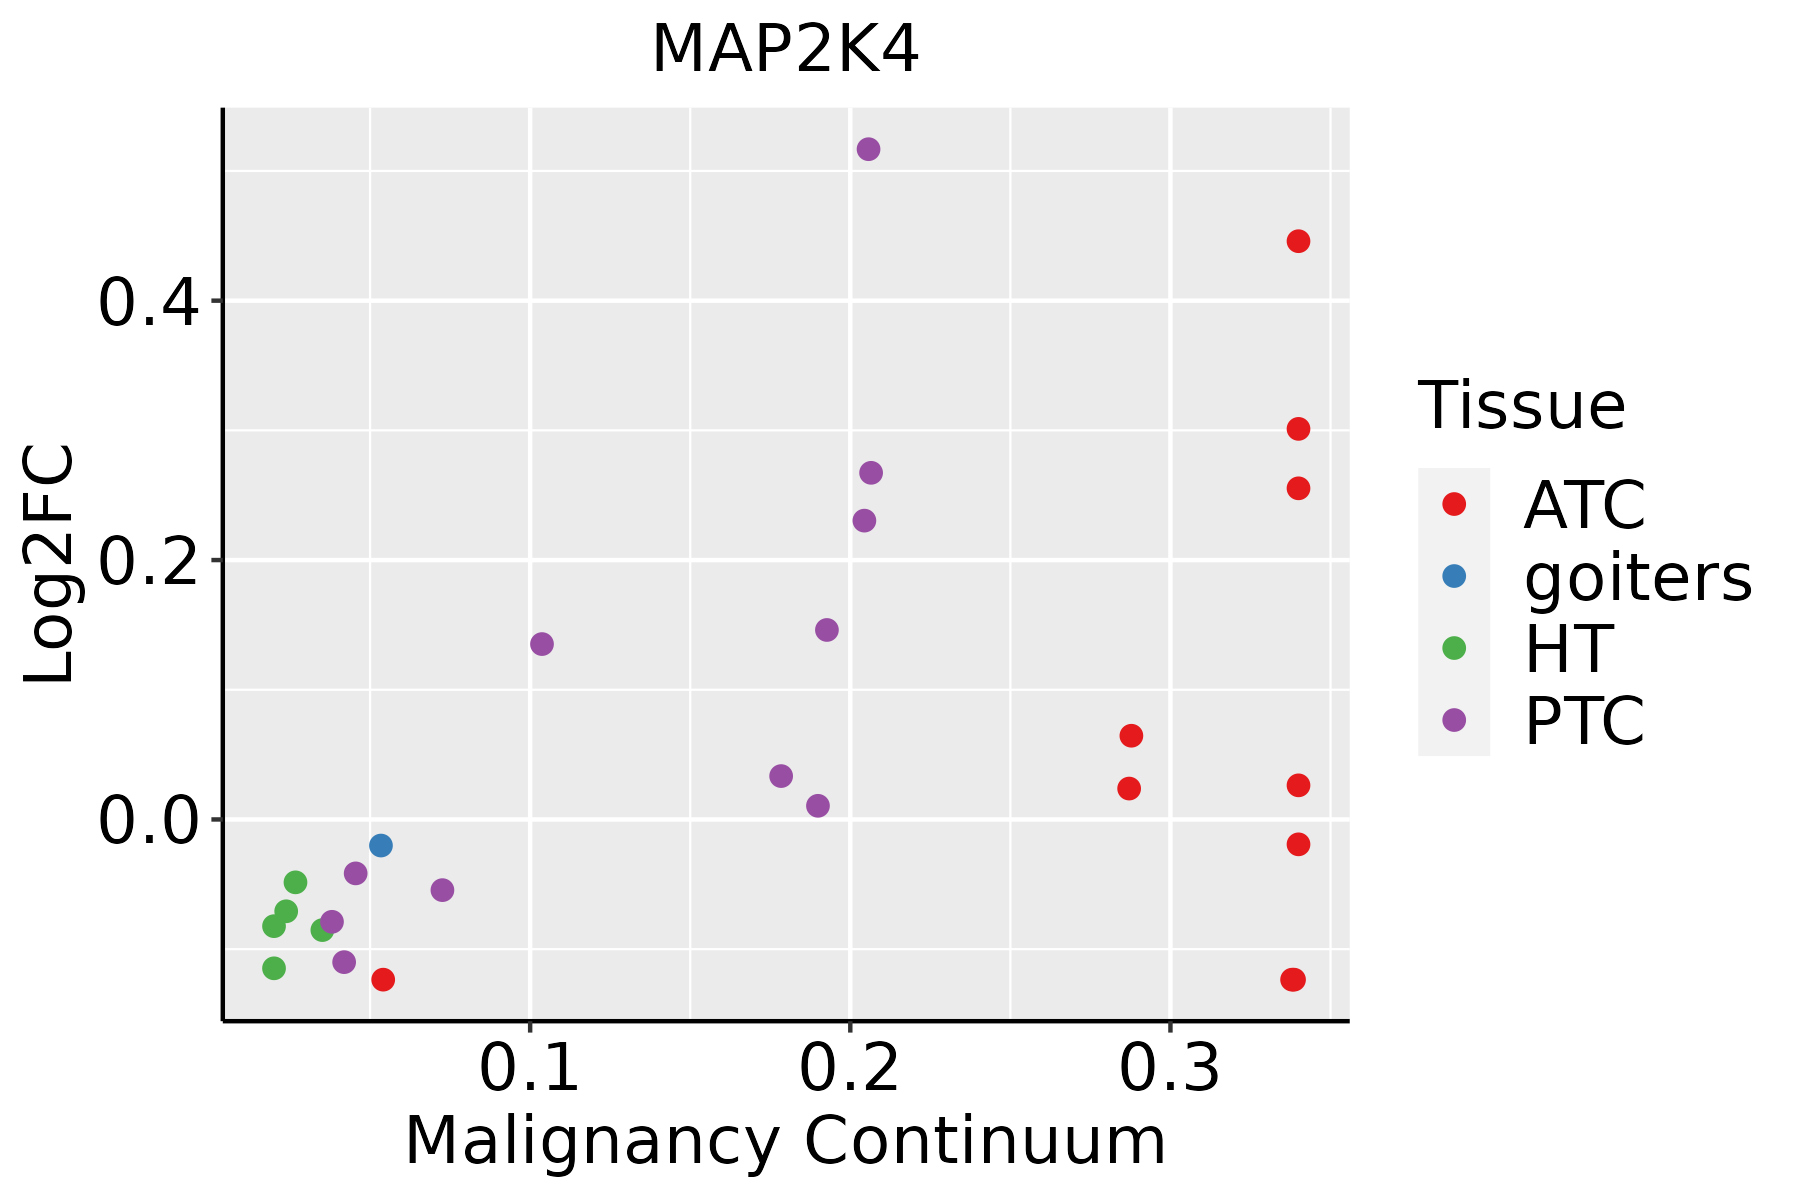 | ATC: Anaplastic thyroid cancer |
| HT: Hashimoto's thyroiditis |
| PTC: Papillary thyroid cancer |
| GO ID | Tissue | Disease Stage | Description | Gene Ratio | Bg Ratio | pvalue | p.adjust | Count |
| GO:007149610 | Cervix | CC | cellular response to external stimulus | 78/2311 | 320/18723 | 1.82e-09 | 1.98e-07 | 78 |
| GO:00027644 | Cervix | CC | immune response-regulating signaling pathway | 97/2311 | 468/18723 | 1.49e-07 | 7.07e-06 | 97 |
| GO:00075689 | Cervix | CC | aging | 75/2311 | 339/18723 | 2.75e-07 | 1.13e-05 | 75 |
| GO:00310988 | Cervix | CC | stress-activated protein kinase signaling cascade | 58/2311 | 247/18723 | 8.02e-07 | 2.89e-05 | 58 |
| GO:00514038 | Cervix | CC | stress-activated MAPK cascade | 55/2311 | 239/18723 | 2.96e-06 | 8.31e-05 | 55 |
| GO:00380933 | Cervix | CC | Fc receptor signaling pathway | 19/2311 | 50/18723 | 3.42e-06 | 9.17e-05 | 19 |
| GO:00712148 | Cervix | CC | cellular response to abiotic stimulus | 69/2311 | 331/18723 | 7.36e-06 | 1.73e-04 | 69 |
| GO:01040048 | Cervix | CC | cellular response to environmental stimulus | 69/2311 | 331/18723 | 7.36e-06 | 1.73e-04 | 69 |
| GO:00160498 | Cervix | CC | cell growth | 92/2311 | 482/18723 | 1.16e-05 | 2.49e-04 | 92 |
| GO:00075695 | Cervix | CC | cell aging | 34/2311 | 132/18723 | 1.92e-05 | 3.53e-04 | 34 |
| GO:00096127 | Cervix | CC | response to mechanical stimulus | 48/2311 | 216/18723 | 3.23e-05 | 5.29e-04 | 48 |
| GO:0038095 | Cervix | CC | Fc-epsilon receptor signaling pathway | 11/2311 | 24/18723 | 5.28e-05 | 7.88e-04 | 11 |
| GO:000974310 | Cervix | CC | response to carbohydrate | 53/2311 | 253/18723 | 7.02e-05 | 9.85e-04 | 53 |
| GO:007099710 | Cervix | CC | neuron death | 70/2311 | 361/18723 | 7.50e-05 | 1.03e-03 | 70 |
| GO:00712602 | Cervix | CC | cellular response to mechanical stimulus | 23/2311 | 81/18723 | 8.34e-05 | 1.12e-03 | 23 |
| GO:190121610 | Cervix | CC | positive regulation of neuron death | 26/2311 | 97/18723 | 8.64e-05 | 1.15e-03 | 26 |
| GO:00605375 | Cervix | CC | muscle tissue development | 76/2311 | 403/18723 | 9.76e-05 | 1.27e-03 | 76 |
| GO:00903981 | Cervix | CC | cellular senescence | 25/2311 | 93/18723 | 1.11e-04 | 1.40e-03 | 25 |
| GO:00147064 | Cervix | CC | striated muscle tissue development | 72/2311 | 384/18723 | 1.76e-04 | 2.07e-03 | 72 |
| GO:190121410 | Cervix | CC | regulation of neuron death | 61/2311 | 319/18723 | 3.11e-04 | 3.31e-03 | 61 |
| Pathway ID | Tissue | Disease Stage | Description | Gene Ratio | Bg Ratio | pvalue | p.adjust | qvalue | Count |
| hsa0493511 | Lung | IAC | Growth hormone synthesis, secretion and action | 24/1053 | 120/8465 | 1.18e-02 | 4.22e-02 | 2.80e-02 | 24 |
| hsa0514211 | Lung | IAC | Chagas disease | 21/1053 | 102/8465 | 1.30e-02 | 4.57e-02 | 3.04e-02 | 21 |
| hsa0541723 | Lung | AIS | Lipid and atherosclerosis | 46/961 | 215/8465 | 1.33e-05 | 3.32e-04 | 2.12e-04 | 46 |
| hsa0520823 | Lung | AIS | Chemical carcinogenesis - reactive oxygen species | 47/961 | 223/8465 | 1.63e-05 | 3.77e-04 | 2.41e-04 | 47 |
| hsa0541823 | Lung | AIS | Fluid shear stress and atherosclerosis | 33/961 | 139/8465 | 2.48e-05 | 4.73e-04 | 3.03e-04 | 33 |
| hsa0513223 | Lung | AIS | Salmonella infection | 50/961 | 249/8465 | 3.47e-05 | 5.62e-04 | 3.59e-04 | 50 |
| hsa0401021 | Lung | AIS | MAPK signaling pathway | 57/961 | 302/8465 | 6.41e-05 | 9.43e-04 | 6.03e-04 | 57 |
| hsa0516623 | Lung | AIS | Human T-cell leukemia virus 1 infection | 45/961 | 222/8465 | 6.69e-05 | 9.43e-04 | 6.03e-04 | 45 |
| hsa0516722 | Lung | AIS | Kaposi sarcoma-associated herpesvirus infection | 40/961 | 194/8465 | 1.14e-04 | 1.42e-03 | 9.10e-04 | 40 |
| hsa0513523 | Lung | AIS | Yersinia infection | 30/961 | 137/8465 | 2.70e-04 | 2.92e-03 | 1.87e-03 | 30 |
| hsa0401221 | Lung | AIS | ErbB signaling pathway | 21/961 | 85/8465 | 4.06e-04 | 3.87e-03 | 2.47e-03 | 21 |
| hsa0491221 | Lung | AIS | GnRH signaling pathway | 20/961 | 93/8465 | 3.38e-03 | 1.89e-02 | 1.21e-02 | 20 |
| hsa0492621 | Lung | AIS | Relaxin signaling pathway | 25/961 | 129/8465 | 4.95e-03 | 2.47e-02 | 1.58e-02 | 25 |
| hsa0493521 | Lung | AIS | Growth hormone synthesis, secretion and action | 23/961 | 120/8465 | 7.85e-03 | 3.58e-02 | 2.29e-02 | 23 |
| hsa0512021 | Lung | AIS | Epithelial cell signaling in Helicobacter pylori infection | 15/961 | 70/8465 | 1.07e-02 | 4.45e-02 | 2.85e-02 | 15 |
| hsa0541733 | Lung | AIS | Lipid and atherosclerosis | 46/961 | 215/8465 | 1.33e-05 | 3.32e-04 | 2.12e-04 | 46 |
| hsa0520833 | Lung | AIS | Chemical carcinogenesis - reactive oxygen species | 47/961 | 223/8465 | 1.63e-05 | 3.77e-04 | 2.41e-04 | 47 |
| hsa0541833 | Lung | AIS | Fluid shear stress and atherosclerosis | 33/961 | 139/8465 | 2.48e-05 | 4.73e-04 | 3.03e-04 | 33 |
| hsa0513233 | Lung | AIS | Salmonella infection | 50/961 | 249/8465 | 3.47e-05 | 5.62e-04 | 3.59e-04 | 50 |
| hsa0401031 | Lung | AIS | MAPK signaling pathway | 57/961 | 302/8465 | 6.41e-05 | 9.43e-04 | 6.03e-04 | 57 |
| Hugo Symbol | Variant Class | Variant Classification | dbSNP RS | HGVSc | HGVSp | HGVSp Short | SWISSPROT | BIOTYPE | SIFT | PolyPhen | Tumor Sample Barcode | Tissue | Histology | Sex | Age | Stage | Therapy Types | Drugs | Outcome |
| MAP2K4 | SNV | Missense_Mutation | | c.785G>T | p.Ser262Ile | p.S262I | P45985 | protein_coding | deleterious(0) | probably_damaging(1) | TCGA-A2-A1G4-01 | Breast | breast invasive carcinoma | Female | >=65 | III/IV | Chemotherapy | adriamycin | SD |
| MAP2K4 | SNV | Missense_Mutation | | c.1187N>C | p.Leu396Pro | p.L396P | P45985 | protein_coding | deleterious(0) | probably_damaging(0.992) | TCGA-A7-A26H-01 | Breast | breast invasive carcinoma | Female | >=65 | I/II | Hormone Therapy | anastrozole | PD |
| MAP2K4 | SNV | Missense_Mutation | | c.850G>A | p.Glu284Lys | p.E284K | P45985 | protein_coding | deleterious(0) | probably_damaging(0.989) | TCGA-A8-A093-01 | Breast | breast invasive carcinoma | Female | <65 | I/II | Hormone Therapy | tamoxiphen | SD |
| MAP2K4 | SNV | Missense_Mutation | | c.1186C>G | p.Leu396Val | p.L396V | P45985 | protein_coding | deleterious(0) | benign(0.306) | TCGA-AO-A0JF-01 | Breast | breast invasive carcinoma | Female | >=65 | I/II | Chemotherapy | doxorubicin | SD |
| MAP2K4 | SNV | Missense_Mutation | | c.803C>T | p.Ser268Phe | p.S268F | P45985 | protein_coding | deleterious(0.01) | probably_damaging(1) | TCGA-AR-A1AS-01 | Breast | breast invasive carcinoma | Female | <65 | I/II | Chemotherapy | doxorubicin | SD |
| MAP2K4 | SNV | Missense_Mutation | | c.584N>T | p.Ser195Leu | p.S195L | P45985 | protein_coding | deleterious(0) | probably_damaging(1) | TCGA-B6-A0WZ-01 | Breast | breast invasive carcinoma | Female | <65 | I/II | Unknown | Unknown | PD |
| MAP2K4 | SNV | Missense_Mutation | | c.433C>T | p.Arg145Trp | p.R145W | P45985 | protein_coding | deleterious(0) | probably_damaging(0.998) | TCGA-B6-A0X4-01 | Breast | breast invasive carcinoma | Female | <65 | I/II | Unknown | Unknown | PD |
| MAP2K4 | SNV | Missense_Mutation | | c.584N>T | p.Ser195Leu | p.S195L | P45985 | protein_coding | deleterious(0) | probably_damaging(1) | TCGA-BH-A0DP-01 | Breast | breast invasive carcinoma | Female | <65 | I/II | Hormone Therapy | arimidex | SD |
| MAP2K4 | SNV | Missense_Mutation | | c.590N>G | p.Asp197Gly | p.D197G | P45985 | protein_coding | deleterious(0.01) | possibly_damaging(0.838) | TCGA-BH-A0EI-01 | Breast | breast invasive carcinoma | Female | <65 | I/II | Unknown | Unknown | SD |
| MAP2K4 | SNV | Missense_Mutation | | c.901N>T | p.Val301Phe | p.V301F | P45985 | protein_coding | deleterious(0) | probably_damaging(0.998) | TCGA-BH-A0GY-01 | Breast | breast invasive carcinoma | Female | >=65 | I/II | Chemotherapy | cyotxan | SD |
| Entrez ID | Symbol | Category | Interaction Types | Drug Claim Name | Drug Name | PMIDs |
| 6416 | MAP2K4 | KINASE, DRUGGABLE GENOME, CLINICALLY ACTIONABLE, TYROSINE KINASE, SERINE THREONINE KINASE, ENZYME | inhibitor | TRAMETINIB | TRAMETINIB | |
| 6416 | MAP2K4 | KINASE, DRUGGABLE GENOME, CLINICALLY ACTIONABLE, TYROSINE KINASE, SERINE THREONINE KINASE, ENZYME | inhibitor | 135652717 | STAUROSPORINE | |
| 6416 | MAP2K4 | KINASE, DRUGGABLE GENOME, CLINICALLY ACTIONABLE, TYROSINE KINASE, SERINE THREONINE KINASE, ENZYME | inhibitor | PD 0325901 | | |
| 6416 | MAP2K4 | KINASE, DRUGGABLE GENOME, CLINICALLY ACTIONABLE, TYROSINE KINASE, SERINE THREONINE KINASE, ENZYME | | ethanol | ALCOHOL | |
| 6416 | MAP2K4 | KINASE, DRUGGABLE GENOME, CLINICALLY ACTIONABLE, TYROSINE KINASE, SERINE THREONINE KINASE, ENZYME | inhibitor | GDC-0973 | COBIMETINIB | |
| 6416 | MAP2K4 | KINASE, DRUGGABLE GENOME, CLINICALLY ACTIONABLE, TYROSINE KINASE, SERINE THREONINE KINASE, ENZYME | inhibitor | BAY869766 | | |
| 6416 | MAP2K4 | KINASE, DRUGGABLE GENOME, CLINICALLY ACTIONABLE, TYROSINE KINASE, SERINE THREONINE KINASE, ENZYME | inhibitor | AZD6244 | SELUMETINIB | |
| 6416 | MAP2K4 | KINASE, DRUGGABLE GENOME, CLINICALLY ACTIONABLE, TYROSINE KINASE, SERINE THREONINE KINASE, ENZYME | inhibitor | 178102628 | | |
| 6416 | MAP2K4 | KINASE, DRUGGABLE GENOME, CLINICALLY ACTIONABLE, TYROSINE KINASE, SERINE THREONINE KINASE, ENZYME | inhibitor | SELUMETINIB | SELUMETINIB | |
| 6416 | MAP2K4 | KINASE, DRUGGABLE GENOME, CLINICALLY ACTIONABLE, TYROSINE KINASE, SERINE THREONINE KINASE, ENZYME | inhibitor | MEK162 | BINIMETINIB | |


