
|
|||||
|
 | |
| |
| |
| |
| |
| |
|
Gene: RAF1 |
Gene summary for RAF1 |
| Gene information | Species | Human | Gene symbol | RAF1 | Gene ID | 5894 |
| Gene name | Raf-1 proto-oncogene, serine/threonine kinase | |
| Gene Alias | CMD1NN | |
| Cytomap | 3p25.2 | |
| Gene Type | protein-coding | GO ID | GO:0000165 | UniProtAcc | L7RRS6 |
Top |
Malignant transformation analysis |
| Identification of the aberrant gene expression in precancerous and cancerous lesions by comparing the gene expression of stem-like cells in diseased tissues with normal stem cells |
| Entrez ID | Symbol | Replicates | Species | Organ | Tissue | Adj P-value | Log2FC | Malignancy |
| 5894 | RAF1 | CCI_2 | Human | Cervix | CC | 5.83e-03 | 5.23e-01 | 0.5249 |
| 5894 | RAF1 | CCI_3 | Human | Cervix | CC | 1.45e-11 | 5.87e-01 | 0.516 |
| 5894 | RAF1 | LZE4T | Human | Esophagus | ESCC | 1.65e-06 | 1.26e-01 | 0.0811 |
| 5894 | RAF1 | LZE7T | Human | Esophagus | ESCC | 1.47e-09 | 2.26e-01 | 0.0667 |
| 5894 | RAF1 | LZE8T | Human | Esophagus | ESCC | 2.44e-04 | 7.10e-02 | 0.067 |
| 5894 | RAF1 | LZE20T | Human | Esophagus | ESCC | 1.39e-02 | 1.34e-02 | 0.0662 |
| 5894 | RAF1 | LZE24T | Human | Esophagus | ESCC | 8.75e-13 | 3.06e-01 | 0.0596 |
| 5894 | RAF1 | P1T-E | Human | Esophagus | ESCC | 2.13e-06 | 1.75e-01 | 0.0875 |
| 5894 | RAF1 | P2T-E | Human | Esophagus | ESCC | 2.58e-21 | 3.44e-01 | 0.1177 |
| 5894 | RAF1 | P4T-E | Human | Esophagus | ESCC | 1.97e-17 | 3.45e-01 | 0.1323 |
| 5894 | RAF1 | P5T-E | Human | Esophagus | ESCC | 6.82e-29 | 6.01e-01 | 0.1327 |
| 5894 | RAF1 | P8T-E | Human | Esophagus | ESCC | 4.09e-26 | 2.17e-01 | 0.0889 |
| 5894 | RAF1 | P9T-E | Human | Esophagus | ESCC | 6.08e-14 | 3.11e-01 | 0.1131 |
| 5894 | RAF1 | P10T-E | Human | Esophagus | ESCC | 2.43e-28 | 3.74e-01 | 0.116 |
| 5894 | RAF1 | P11T-E | Human | Esophagus | ESCC | 1.67e-16 | 3.54e-01 | 0.1426 |
| 5894 | RAF1 | P12T-E | Human | Esophagus | ESCC | 2.84e-22 | 4.10e-01 | 0.1122 |
| 5894 | RAF1 | P15T-E | Human | Esophagus | ESCC | 3.45e-17 | 2.66e-01 | 0.1149 |
| 5894 | RAF1 | P16T-E | Human | Esophagus | ESCC | 8.00e-12 | 2.31e-01 | 0.1153 |
| 5894 | RAF1 | P17T-E | Human | Esophagus | ESCC | 5.02e-09 | 2.42e-01 | 0.1278 |
| 5894 | RAF1 | P19T-E | Human | Esophagus | ESCC | 1.34e-08 | 4.25e-01 | 0.1662 |
| Page: 1 2 3 4 5 6 |
| Tissue | Expression Dynamics | Abbreviation |
| Cervix | 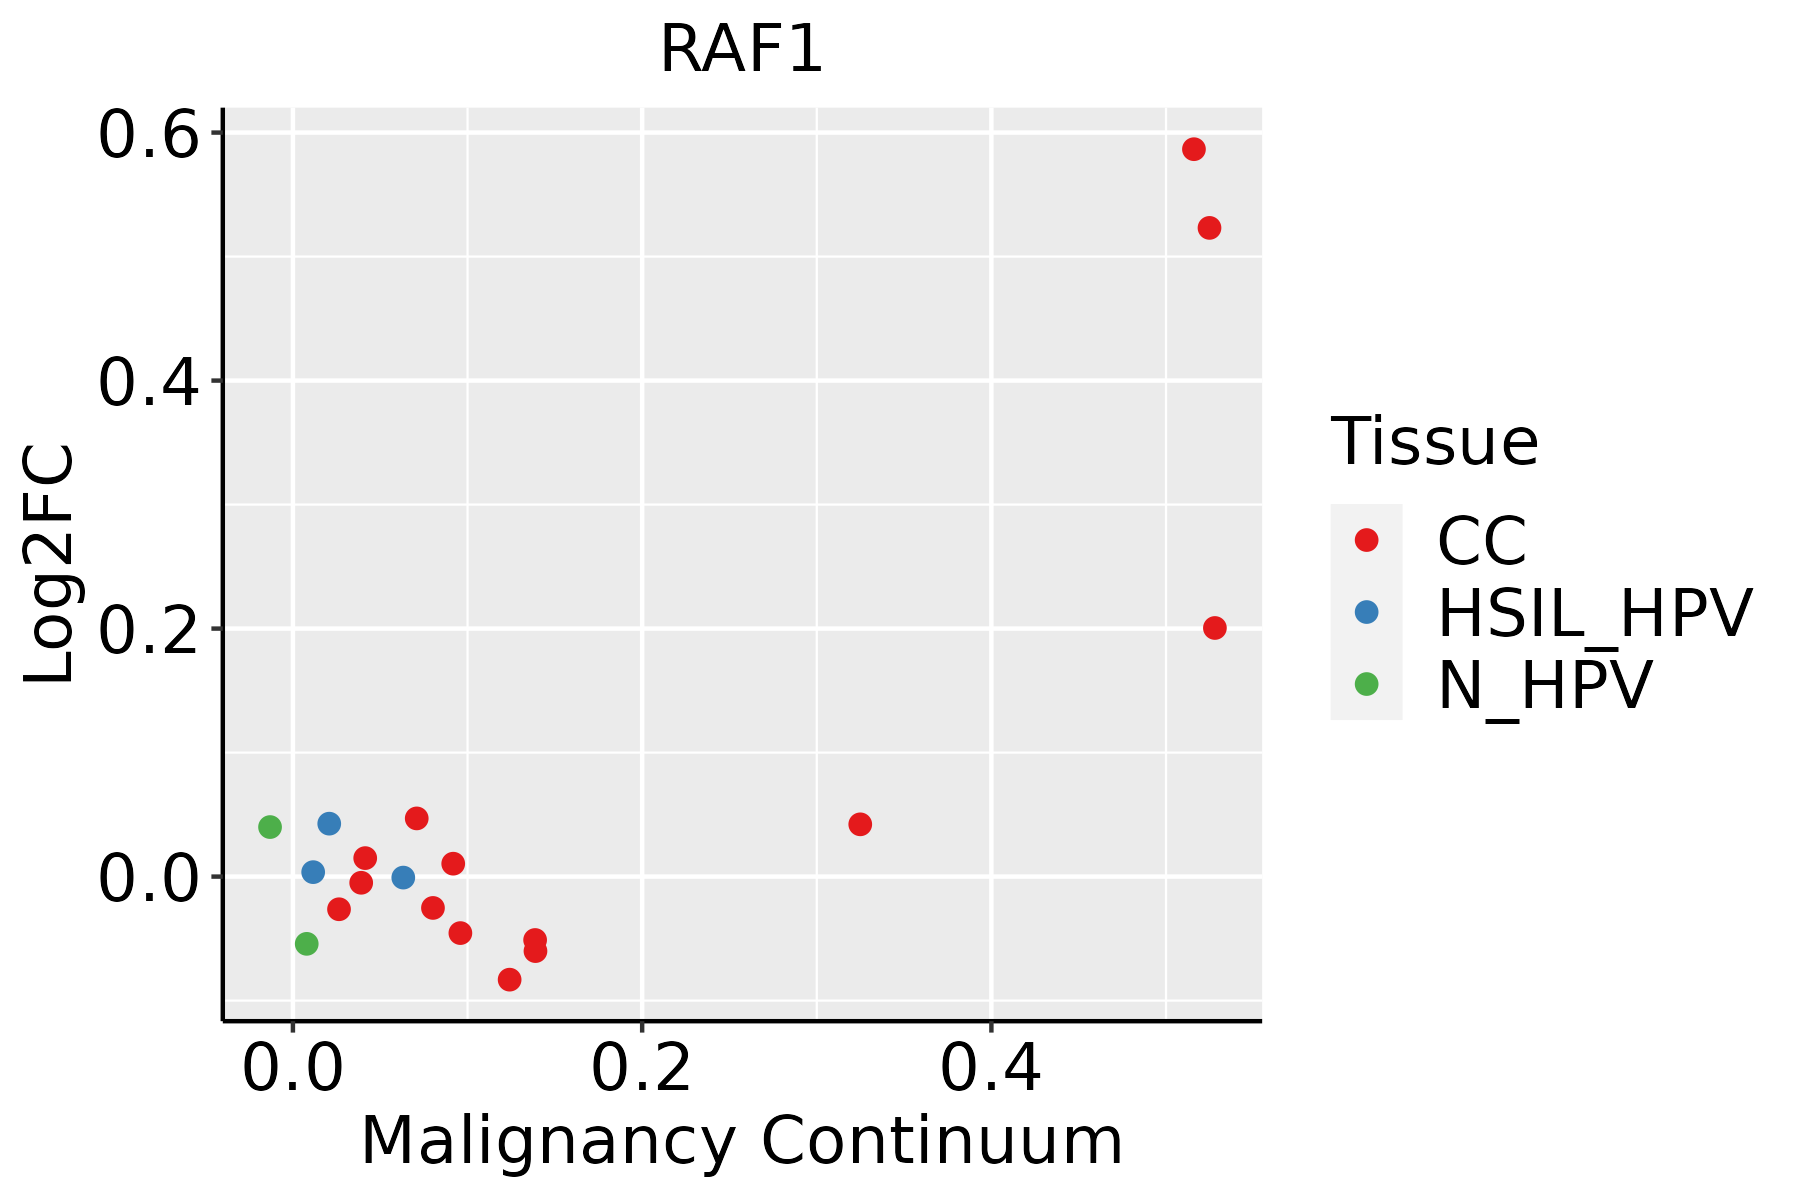 | CC: Cervix cancer |
| HSIL_HPV: HPV-infected high-grade squamous intraepithelial lesions | ||
| N_HPV: HPV-infected normal cervix | ||
| Esophagus | 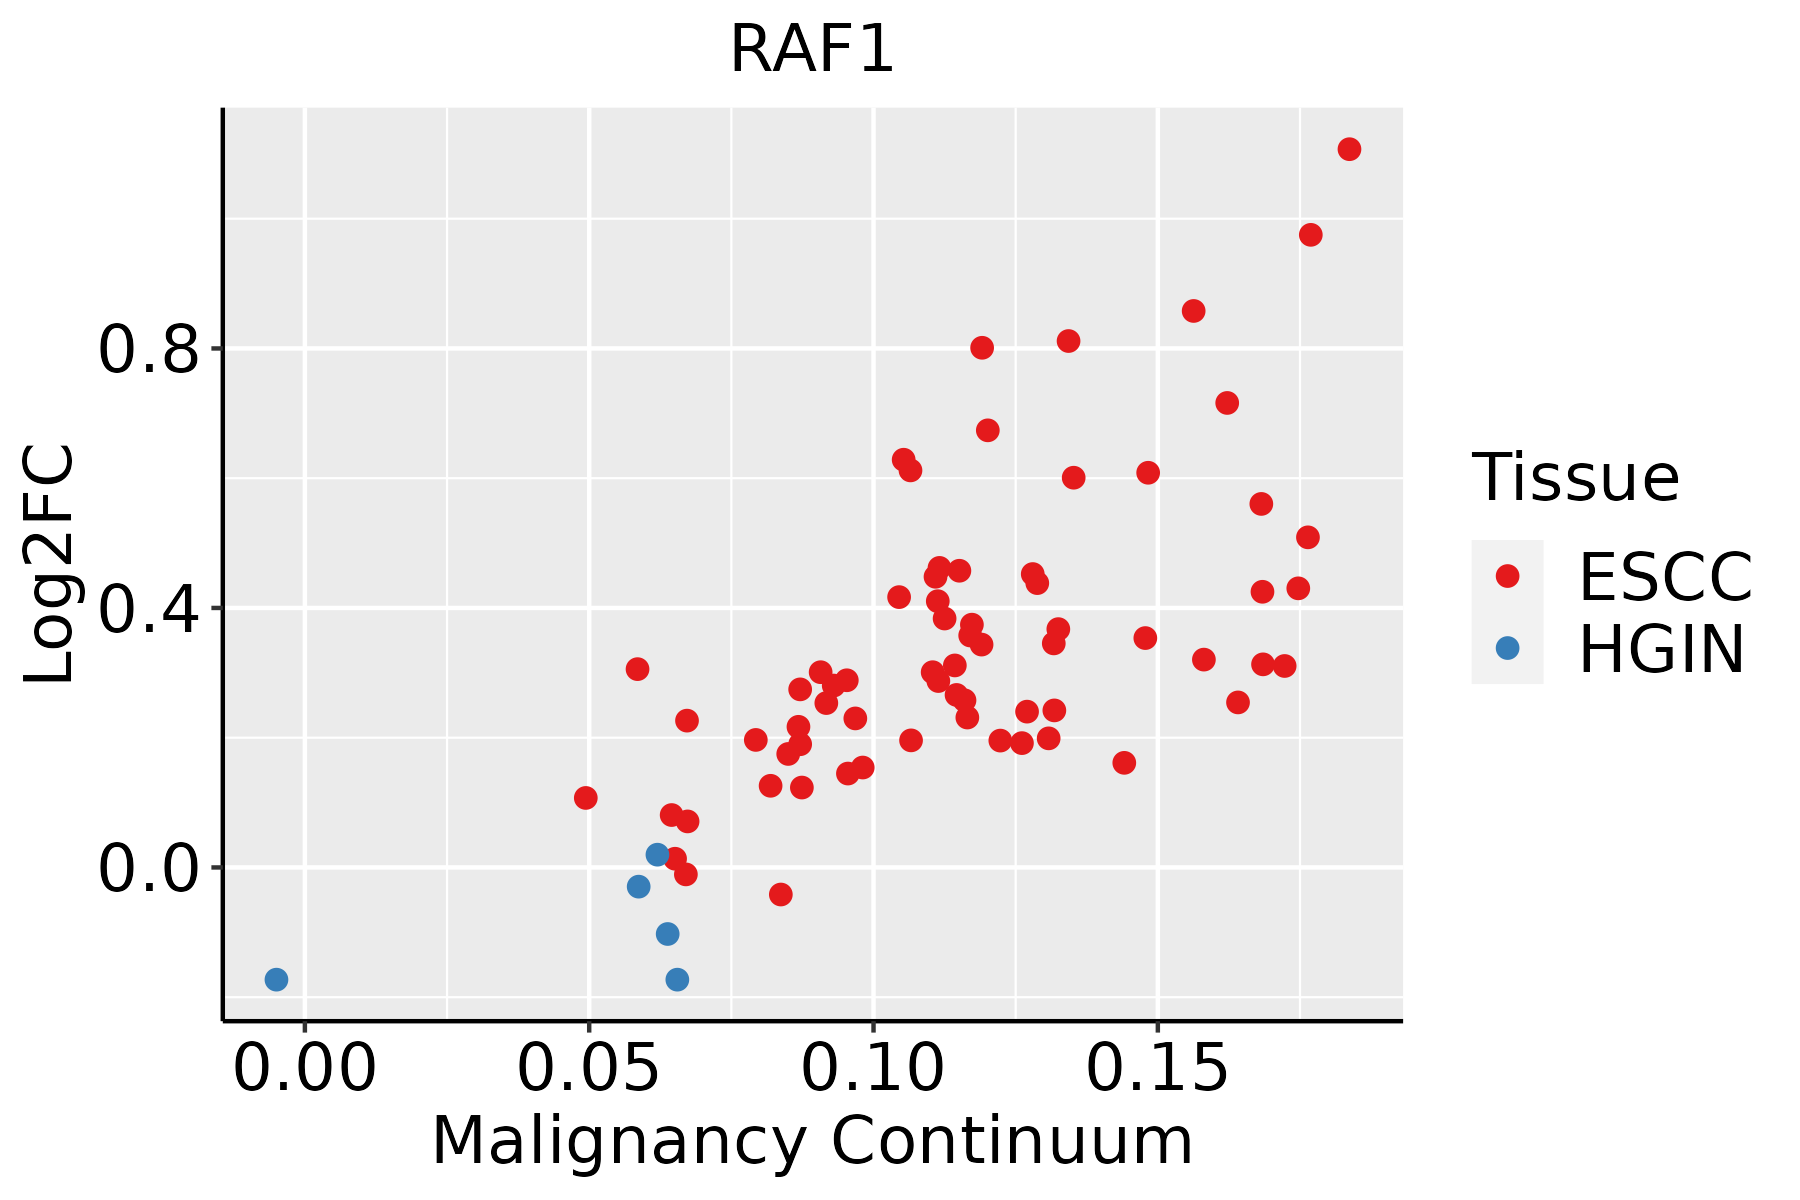 | ESCC: Esophageal squamous cell carcinoma |
| HGIN: High-grade intraepithelial neoplasias | ||
| LGIN: Low-grade intraepithelial neoplasias | ||
| Liver | 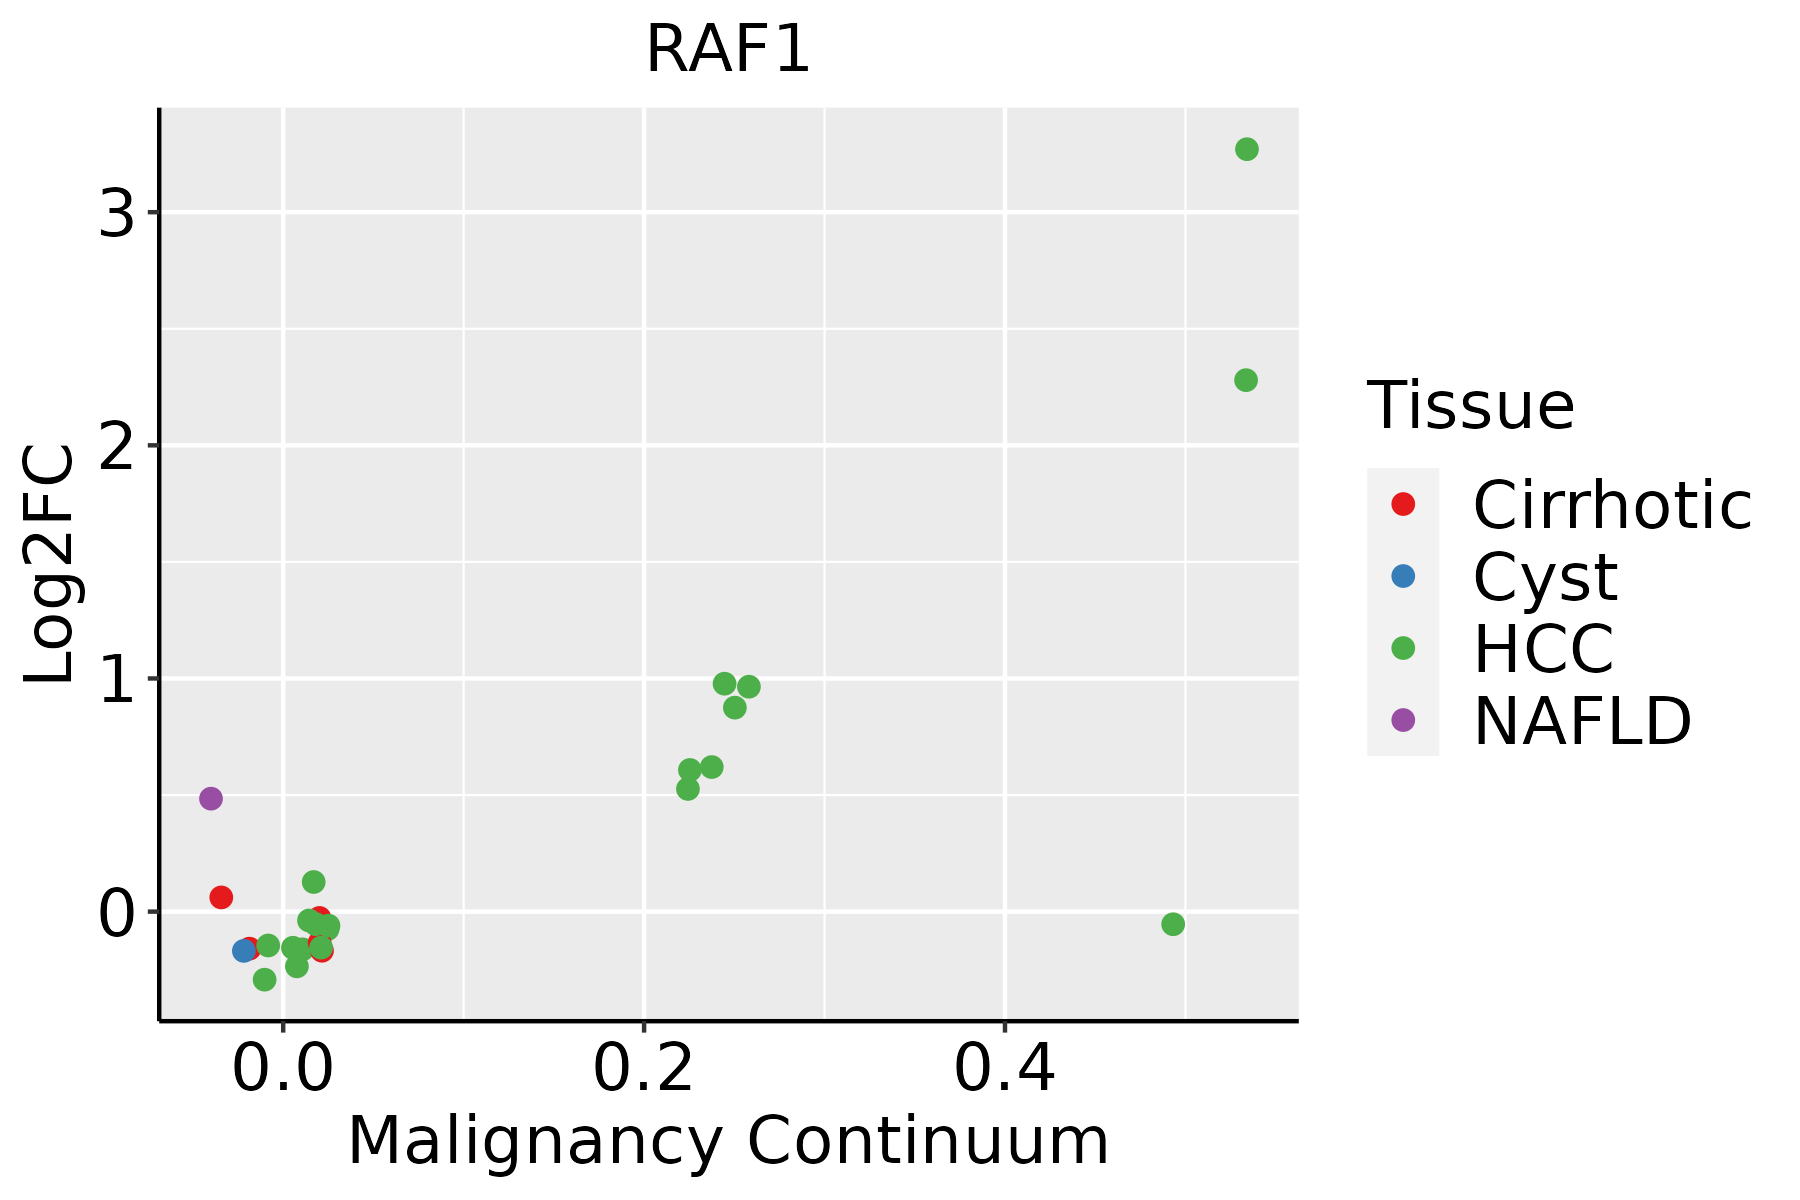 | HCC: Hepatocellular carcinoma |
| NAFLD: Non-alcoholic fatty liver disease | ||
| Oral Cavity |  | EOLP: Erosive Oral lichen planus |
| LP: leukoplakia | ||
| NEOLP: Non-erosive oral lichen planus | ||
| OSCC: Oral squamous cell carcinoma | ||
| Skin |  | AK: Actinic keratosis |
| cSCC: Cutaneous squamous cell carcinoma | ||
| SCCIS:squamous cell carcinoma in situ | ||
| Thyroid |  | ATC: Anaplastic thyroid cancer |
| HT: Hashimoto's thyroiditis | ||
| PTC: Papillary thyroid cancer |
| ∗log2FC in expression of this searched gene in stem-like cells from each diseased tissue sample relative to stem-like cells in normal samples in each tissue plotted against the malignancy continuum. Samples are colored based on if they are from different disease stage. |
Top |
Malignant transformation related pathway analysis |
| Find out the enriched GO biological processes and KEGG pathways involved in transition from healthy to precancer to cancer |
| Tissue | Disease Stage | Enriched GO biological Processes |
| Colorectum | AD |  |
| Colorectum | SER |  |
| Colorectum | MSS |  |
| Colorectum | MSI-H |  |
| Colorectum | FAP |  |
| ∗Top 15 enriched GO BP terms are showed in the bar plot of each disease state in each tissue. Each row represents a significant GO biological process which is colored according to the -log10(p.adjust). |
| Page: 1 2 3 4 5 6 7 8 9 |
| GO ID | Tissue | Disease Stage | Description | Gene Ratio | Bg Ratio | pvalue | p.adjust | Count |
| GO:004206010 | Cervix | CC | wound healing | 109/2311 | 422/18723 | 1.84e-14 | 1.57e-11 | 109 |
| GO:200123310 | Cervix | CC | regulation of apoptotic signaling pathway | 96/2311 | 356/18723 | 4.08e-14 | 3.05e-11 | 96 |
| GO:005254710 | Cervix | CC | regulation of peptidase activity | 112/2311 | 461/18723 | 6.70e-13 | 3.08e-10 | 112 |
| GO:005254810 | Cervix | CC | regulation of endopeptidase activity | 103/2311 | 432/18723 | 1.89e-11 | 5.14e-09 | 103 |
| GO:00510566 | Cervix | CC | regulation of small GTPase mediated signal transduction | 75/2311 | 302/18723 | 1.54e-09 | 1.74e-07 | 75 |
| GO:004325410 | Cervix | CC | regulation of protein-containing complex assembly | 96/2311 | 428/18723 | 2.91e-09 | 3.05e-07 | 96 |
| GO:200011610 | Cervix | CC | regulation of cysteine-type endopeptidase activity | 61/2311 | 235/18723 | 8.69e-09 | 7.22e-07 | 61 |
| GO:00072656 | Cervix | CC | Ras protein signal transduction | 79/2311 | 337/18723 | 9.49e-09 | 7.77e-07 | 79 |
| GO:004328110 | Cervix | CC | regulation of cysteine-type endopeptidase activity involved in apoptotic process | 55/2311 | 209/18723 | 2.77e-08 | 1.95e-06 | 55 |
| GO:004586110 | Cervix | CC | negative regulation of proteolysis | 80/2311 | 351/18723 | 2.88e-08 | 1.98e-06 | 80 |
| GO:200123410 | Cervix | CC | negative regulation of apoptotic signaling pathway | 56/2311 | 224/18723 | 1.39e-07 | 6.70e-06 | 56 |
| GO:00513469 | Cervix | CC | negative regulation of hydrolase activity | 81/2311 | 379/18723 | 4.27e-07 | 1.67e-05 | 81 |
| GO:00104669 | Cervix | CC | negative regulation of peptidase activity | 60/2311 | 262/18723 | 1.27e-06 | 4.34e-05 | 60 |
| GO:009719110 | Cervix | CC | extrinsic apoptotic signaling pathway | 52/2311 | 219/18723 | 2.06e-06 | 6.34e-05 | 52 |
| GO:001095110 | Cervix | CC | negative regulation of endopeptidase activity | 56/2311 | 252/18723 | 7.43e-06 | 1.74e-04 | 56 |
| GO:00072666 | Cervix | CC | Rho protein signal transduction | 35/2311 | 137/18723 | 1.77e-05 | 3.33e-04 | 35 |
| GO:004873210 | Cervix | CC | gland development | 84/2311 | 436/18723 | 1.93e-05 | 3.54e-04 | 84 |
| GO:00465785 | Cervix | CC | regulation of Ras protein signal transduction | 44/2311 | 189/18723 | 2.05e-05 | 3.73e-04 | 44 |
| GO:200123610 | Cervix | CC | regulation of extrinsic apoptotic signaling pathway | 37/2311 | 151/18723 | 2.80e-05 | 4.65e-04 | 37 |
| GO:00434104 | Cervix | CC | positive regulation of MAPK cascade | 90/2311 | 480/18723 | 2.92e-05 | 4.83e-04 | 90 |
| Page: 1 2 3 4 5 6 7 8 9 10 11 12 13 14 15 16 17 18 19 20 21 22 23 24 25 26 27 28 29 30 |
| Pathway ID | Tissue | Disease Stage | Description | Gene Ratio | Bg Ratio | pvalue | p.adjust | qvalue | Count |
| hsa052308 | Liver | Cirrhotic | Central carbon metabolism in cancer | 30/2530 | 70/8465 | 1.41e-02 | 4.35e-02 | 2.68e-02 | 30 |
| hsa0520832 | Liver | Cirrhotic | Chemical carcinogenesis - reactive oxygen species | 121/2530 | 223/8465 | 1.35e-14 | 4.08e-13 | 2.52e-13 | 121 |
| hsa0502215 | Liver | Cirrhotic | Pathways of neurodegeneration - multiple diseases | 217/2530 | 476/8465 | 7.30e-14 | 2.03e-12 | 1.25e-12 | 217 |
| hsa0501015 | Liver | Cirrhotic | Alzheimer disease | 180/2530 | 384/8465 | 5.52e-13 | 1.36e-11 | 8.36e-12 | 180 |
| hsa0513232 | Liver | Cirrhotic | Salmonella infection | 121/2530 | 249/8465 | 2.47e-10 | 5.13e-09 | 3.16e-09 | 121 |
| hsa0451031 | Liver | Cirrhotic | Focal adhesion | 93/2530 | 203/8465 | 9.27e-07 | 1.10e-05 | 6.80e-06 | 93 |
| hsa0481031 | Liver | Cirrhotic | Regulation of actin cytoskeleton | 100/2530 | 229/8465 | 5.28e-06 | 5.50e-05 | 3.39e-05 | 100 |
| hsa0414011 | Liver | Cirrhotic | Autophagy - animal | 65/2530 | 141/8465 | 3.10e-05 | 2.47e-04 | 1.52e-04 | 65 |
| hsa0521911 | Liver | Cirrhotic | Bladder cancer | 25/2530 | 41/8465 | 3.48e-05 | 2.57e-04 | 1.59e-04 | 25 |
| hsa0520511 | Liver | Cirrhotic | Proteoglycans in cancer | 85/2530 | 205/8465 | 2.37e-04 | 1.58e-03 | 9.75e-04 | 85 |
| hsa0421812 | Liver | Cirrhotic | Cellular senescence | 66/2530 | 156/8465 | 5.94e-04 | 3.60e-03 | 2.22e-03 | 66 |
| hsa0421011 | Liver | Cirrhotic | Apoptosis | 58/2530 | 136/8465 | 9.84e-04 | 5.55e-03 | 3.42e-03 | 58 |
| hsa0521111 | Liver | Cirrhotic | Renal cell carcinoma | 33/2530 | 69/8465 | 1.24e-03 | 6.64e-03 | 4.09e-03 | 33 |
| hsa051651 | Liver | Cirrhotic | Human papillomavirus infection | 124/2530 | 331/8465 | 1.55e-03 | 7.83e-03 | 4.83e-03 | 124 |
| hsa0521012 | Liver | Cirrhotic | Colorectal cancer | 39/2530 | 86/8465 | 1.67e-03 | 8.01e-03 | 4.94e-03 | 39 |
| hsa0521311 | Liver | Cirrhotic | Endometrial cancer | 28/2530 | 58/8465 | 2.37e-03 | 1.00e-02 | 6.16e-03 | 28 |
| hsa0516313 | Liver | Cirrhotic | Human cytomegalovirus infection | 87/2530 | 225/8465 | 2.67e-03 | 1.10e-02 | 6.76e-03 | 87 |
| hsa0516012 | Liver | Cirrhotic | Hepatitis C | 63/2530 | 157/8465 | 3.67e-03 | 1.49e-02 | 9.20e-03 | 63 |
| hsa0491031 | Liver | Cirrhotic | Insulin signaling pathway | 56/2530 | 137/8465 | 3.74e-03 | 1.50e-02 | 9.26e-03 | 56 |
| hsa0521211 | Liver | Cirrhotic | Pancreatic cancer | 34/2530 | 76/8465 | 4.20e-03 | 1.63e-02 | 1.00e-02 | 34 |
| Page: 1 2 3 4 5 6 7 8 9 10 11 12 13 14 15 16 17 18 19 20 21 22 23 24 25 26 27 28 29 30 31 |
Top |
Cell-cell communication analysis |
| Identification of potential cell-cell interactions between two cell types and their ligand-receptor pairs for different disease states |
| Ligand | Receptor | LRpair | Pathway | Tissue | Disease Stage |
| Page: 1 |
Top |
Single-cell gene regulatory network inference analysis |
| Find out the significant the regulons (TFs) and the target genes of each regulon across cell types for different disease states |
| TF | Cell Type | Tissue | Disease Stage | Target Gene | RSS | Regulon Activity |
| ∗The dot plots of a searched regulon are shown for all cell subpopulations in each disease state of each tissue based on the regulon specific score inferred using pySCENIC and by calculating the average expression. |
| Page: 1 |
Top |
Somatic mutation of malignant transformation related genes |
| Annotation of somatic variants for genes involved in malignant transformation |
| Hugo Symbol | Variant Class | Variant Classification | dbSNP RS | HGVSc | HGVSp | HGVSp Short | SWISSPROT | BIOTYPE | SIFT | PolyPhen | Tumor Sample Barcode | Tissue | Histology | Sex | Age | Stage | Therapy Types | Drugs | Outcome |
| RAF1 | SNV | Missense_Mutation | c.677T>A | p.Val226Asp | p.V226D | P04049 | protein_coding | tolerated(0.59) | benign(0) | TCGA-A8-A09Z-01 | Breast | breast invasive carcinoma | Female | >=65 | I/II | Unknown | Unknown | SD | |
| RAF1 | SNV | Missense_Mutation | rs730881004 | c.1814N>T | p.Ser605Phe | p.S605F | P04049 | protein_coding | deleterious(0) | probably_damaging(0.986) | TCGA-AC-A3W5-01 | Breast | breast invasive carcinoma | Female | >=65 | I/II | Chemotherapy | docetaxel | CR |
| RAF1 | SNV | Missense_Mutation | c.364N>G | p.Ile122Val | p.I122V | P04049 | protein_coding | tolerated(0.3) | benign(0.001) | TCGA-BH-A18S-01 | Breast | breast invasive carcinoma | Female | >=65 | I/II | Unknown | Unknown | SD | |
| RAF1 | SNV | Missense_Mutation | c.1819N>C | p.Glu607Gln | p.E607Q | P04049 | protein_coding | deleterious(0.02) | probably_damaging(0.949) | TCGA-GM-A2DO-01 | Breast | breast invasive carcinoma | Female | <65 | I/II | Hormone Therapy | tamoxiphen | CR | |
| RAF1 | SNV | Missense_Mutation | novel | c.1060N>T | p.Arg354Trp | p.R354W | P04049 | protein_coding | deleterious(0) | probably_damaging(0.982) | TCGA-OL-A5RW-01 | Breast | breast invasive carcinoma | Female | <65 | I/II | Chemotherapy | adriamycin | CR |
| RAF1 | insertion | Nonsense_Mutation | novel | c.1576_1577insAGGCTCAGGGCTGCTAGAATGTGATTAAAGC | p.Ser526LysfsTer6 | p.S526Kfs*6 | P04049 | protein_coding | TCGA-A2-A0D1-01 | Breast | breast invasive carcinoma | Female | >=65 | I/II | Chemotherapy | taxotere | SD | ||
| RAF1 | insertion | In_Frame_Ins | novel | c.1724_1725insAAAGCAGGGGCCCAGCCCCAGCTGTTG | p.Lys575_Asn576insLysGlnGlyProSerProSerCysTrp | p.K575_N576insKQGPSPSCW | P04049 | protein_coding | TCGA-A8-A08H-01 | Breast | breast invasive carcinoma | Female | >=65 | I/II | Unknown | Unknown | SD | ||
| RAF1 | insertion | Frame_Shift_Ins | novel | c.296_297insTGTTGAAGTGCAAATCTTTGAAG | p.Arg100ValfsTer21 | p.R100Vfs*21 | P04049 | protein_coding | TCGA-AO-A0JB-01 | Breast | breast invasive carcinoma | Female | <65 | III/IV | Chemotherapy | cyclophosphamide | SD | ||
| RAF1 | insertion | In_Frame_Ins | novel | c.1697_1698insTTTTAAAGTAAT | p.Ala566_Ser567insPheLysValIle | p.A566_S567insFKVI | P04049 | protein_coding | TCGA-BH-A0BA-01 | Breast | breast invasive carcinoma | Female | <65 | III/IV | Chemotherapy | cytoxan | SD | ||
| RAF1 | insertion | Frame_Shift_Ins | novel | c.1696_1697insTTACCTC | p.Ala566ValfsTer8 | p.A566Vfs*8 | P04049 | protein_coding | TCGA-BH-A0BA-01 | Breast | breast invasive carcinoma | Female | <65 | III/IV | Chemotherapy | cytoxan | SD |
| Page: 1 2 3 4 5 6 7 8 |
Top |
Related drugs of malignant transformation related genes |
| Identification of chemicals and drugs interact with genes involved in malignant transfromation |
| (DGIdb 4.0) |
| Entrez ID | Symbol | Category | Interaction Types | Drug Claim Name | Drug Name | PMIDs |
| 5894 | RAF1 | DRUGGABLE GENOME, KINASE, ENZYME, SERINE THREONINE KINASE, CLINICALLY ACTIONABLE | SORAFENIB | SORAFENIB | ||
| 5894 | RAF1 | DRUGGABLE GENOME, KINASE, ENZYME, SERINE THREONINE KINASE, CLINICALLY ACTIONABLE | sorafenib | SORAFENIB | 20124951,28362716 | |
| 5894 | RAF1 | DRUGGABLE GENOME, KINASE, ENZYME, SERINE THREONINE KINASE, CLINICALLY ACTIONABLE | inhibitor | REGORAFENIB | REGORAFENIB | |
| 5894 | RAF1 | DRUGGABLE GENOME, KINASE, ENZYME, SERINE THREONINE KINASE, CLINICALLY ACTIONABLE | inhibitor | 404859105 | ||
| 5894 | RAF1 | DRUGGABLE GENOME, KINASE, ENZYME, SERINE THREONINE KINASE, CLINICALLY ACTIONABLE | TRAMETINIB | TRAMETINIB | 30835257 | |
| 5894 | RAF1 | DRUGGABLE GENOME, KINASE, ENZYME, SERINE THREONINE KINASE, CLINICALLY ACTIONABLE | inhibitor | CHEMBL3545296 | ARQ-736 | |
| 5894 | RAF1 | DRUGGABLE GENOME, KINASE, ENZYME, SERINE THREONINE KINASE, CLINICALLY ACTIONABLE | inhibitor | CHEMBL1200485 | SORAFENIB TOSYLATE | |
| 5894 | RAF1 | DRUGGABLE GENOME, KINASE, ENZYME, SERINE THREONINE KINASE, CLINICALLY ACTIONABLE | inhibitor | SORAFENIB | SORAFENIB | |
| 5894 | RAF1 | DRUGGABLE GENOME, KINASE, ENZYME, SERINE THREONINE KINASE, CLINICALLY ACTIONABLE | inhibitor | 328083491 | SB590885 | |
| 5894 | RAF1 | DRUGGABLE GENOME, KINASE, ENZYME, SERINE THREONINE KINASE, CLINICALLY ACTIONABLE | XL281 |
| Page: 1 2 3 4 5 6 |

Copyright 2023-Present -The University of Texas Health Science Center at Houston |