
|
|||||
|
 | |
| |
| |
| |
| |
| |
|
Gene: PIK3R3 |
Gene summary for PIK3R3 |
| Gene information | Species | Human | Gene symbol | PIK3R3 | Gene ID | 8503 |
| Gene name | phosphoinositide-3-kinase regulatory subunit 3 | |
| Gene Alias | p55 | |
| Cytomap | 1p34.1 | |
| Gene Type | protein-coding | GO ID | GO:0001525 | UniProtAcc | Q8N381 |
Top |
Malignant transformation analysis |
| Identification of the aberrant gene expression in precancerous and cancerous lesions by comparing the gene expression of stem-like cells in diseased tissues with normal stem cells |
| Entrez ID | Symbol | Replicates | Species | Organ | Tissue | Adj P-value | Log2FC | Malignancy |
| 8503 | PIK3R3 | AEH-subject1 | Human | Endometrium | AEH | 2.14e-26 | 6.20e-01 | -0.3059 |
| 8503 | PIK3R3 | AEH-subject2 | Human | Endometrium | AEH | 1.48e-15 | 5.34e-01 | -0.2525 |
| 8503 | PIK3R3 | AEH-subject3 | Human | Endometrium | AEH | 5.32e-25 | 6.09e-01 | -0.2576 |
| 8503 | PIK3R3 | AEH-subject4 | Human | Endometrium | AEH | 1.10e-05 | 3.50e-01 | -0.2657 |
| 8503 | PIK3R3 | AEH-subject5 | Human | Endometrium | AEH | 5.43e-09 | 3.50e-01 | -0.2953 |
| 8503 | PIK3R3 | EEC-subject1 | Human | Endometrium | EEC | 2.06e-21 | 6.77e-01 | -0.2682 |
| 8503 | PIK3R3 | EEC-subject2 | Human | Endometrium | EEC | 4.99e-09 | 4.27e-01 | -0.2607 |
| 8503 | PIK3R3 | EEC-subject4 | Human | Endometrium | EEC | 2.23e-04 | 2.80e-01 | -0.2571 |
| 8503 | PIK3R3 | EEC-subject5 | Human | Endometrium | EEC | 6.73e-22 | 5.84e-01 | -0.249 |
| 8503 | PIK3R3 | GSM5276934 | Human | Endometrium | EEC | 1.96e-03 | -1.11e-01 | -0.0913 |
| 8503 | PIK3R3 | GSM5276935 | Human | Endometrium | EEC | 8.26e-13 | 3.71e-01 | -0.123 |
| 8503 | PIK3R3 | GSM6177620_NYU_UCEC1_lib1_lib1 | Human | Endometrium | EEC | 2.92e-03 | 1.18e-01 | -0.1869 |
| 8503 | PIK3R3 | GSM6177620_NYU_UCEC1_lib2_lib2 | Human | Endometrium | EEC | 5.20e-04 | 1.90e-01 | -0.1875 |
| 8503 | PIK3R3 | GSM6177620_NYU_UCEC1_lib3_lib3 | Human | Endometrium | EEC | 3.17e-04 | 1.50e-01 | -0.1883 |
| 8503 | PIK3R3 | GSM6177621_NYU_UCEC2_lib1_lib1 | Human | Endometrium | EEC | 9.35e-03 | 6.65e-02 | -0.1934 |
| 8503 | PIK3R3 | GSM6177622_NYU_UCEC3_lib1_lib1 | Human | Endometrium | EEC | 8.55e-07 | 6.26e-02 | -0.1917 |
| 8503 | PIK3R3 | GSM6177622_NYU_UCEC3_lib2_lib2 | Human | Endometrium | EEC | 3.19e-07 | 7.60e-02 | -0.1916 |
| 8503 | PIK3R3 | LZE5T | Human | Esophagus | ESCC | 3.85e-02 | 6.33e-01 | 0.0514 |
| 8503 | PIK3R3 | LZE7T | Human | Esophagus | ESCC | 8.28e-08 | 6.32e-01 | 0.0667 |
| 8503 | PIK3R3 | LZE8T | Human | Esophagus | ESCC | 1.18e-02 | 8.07e-02 | 0.067 |
| Page: 1 2 3 4 |
| Tissue | Expression Dynamics | Abbreviation |
| Endometrium | 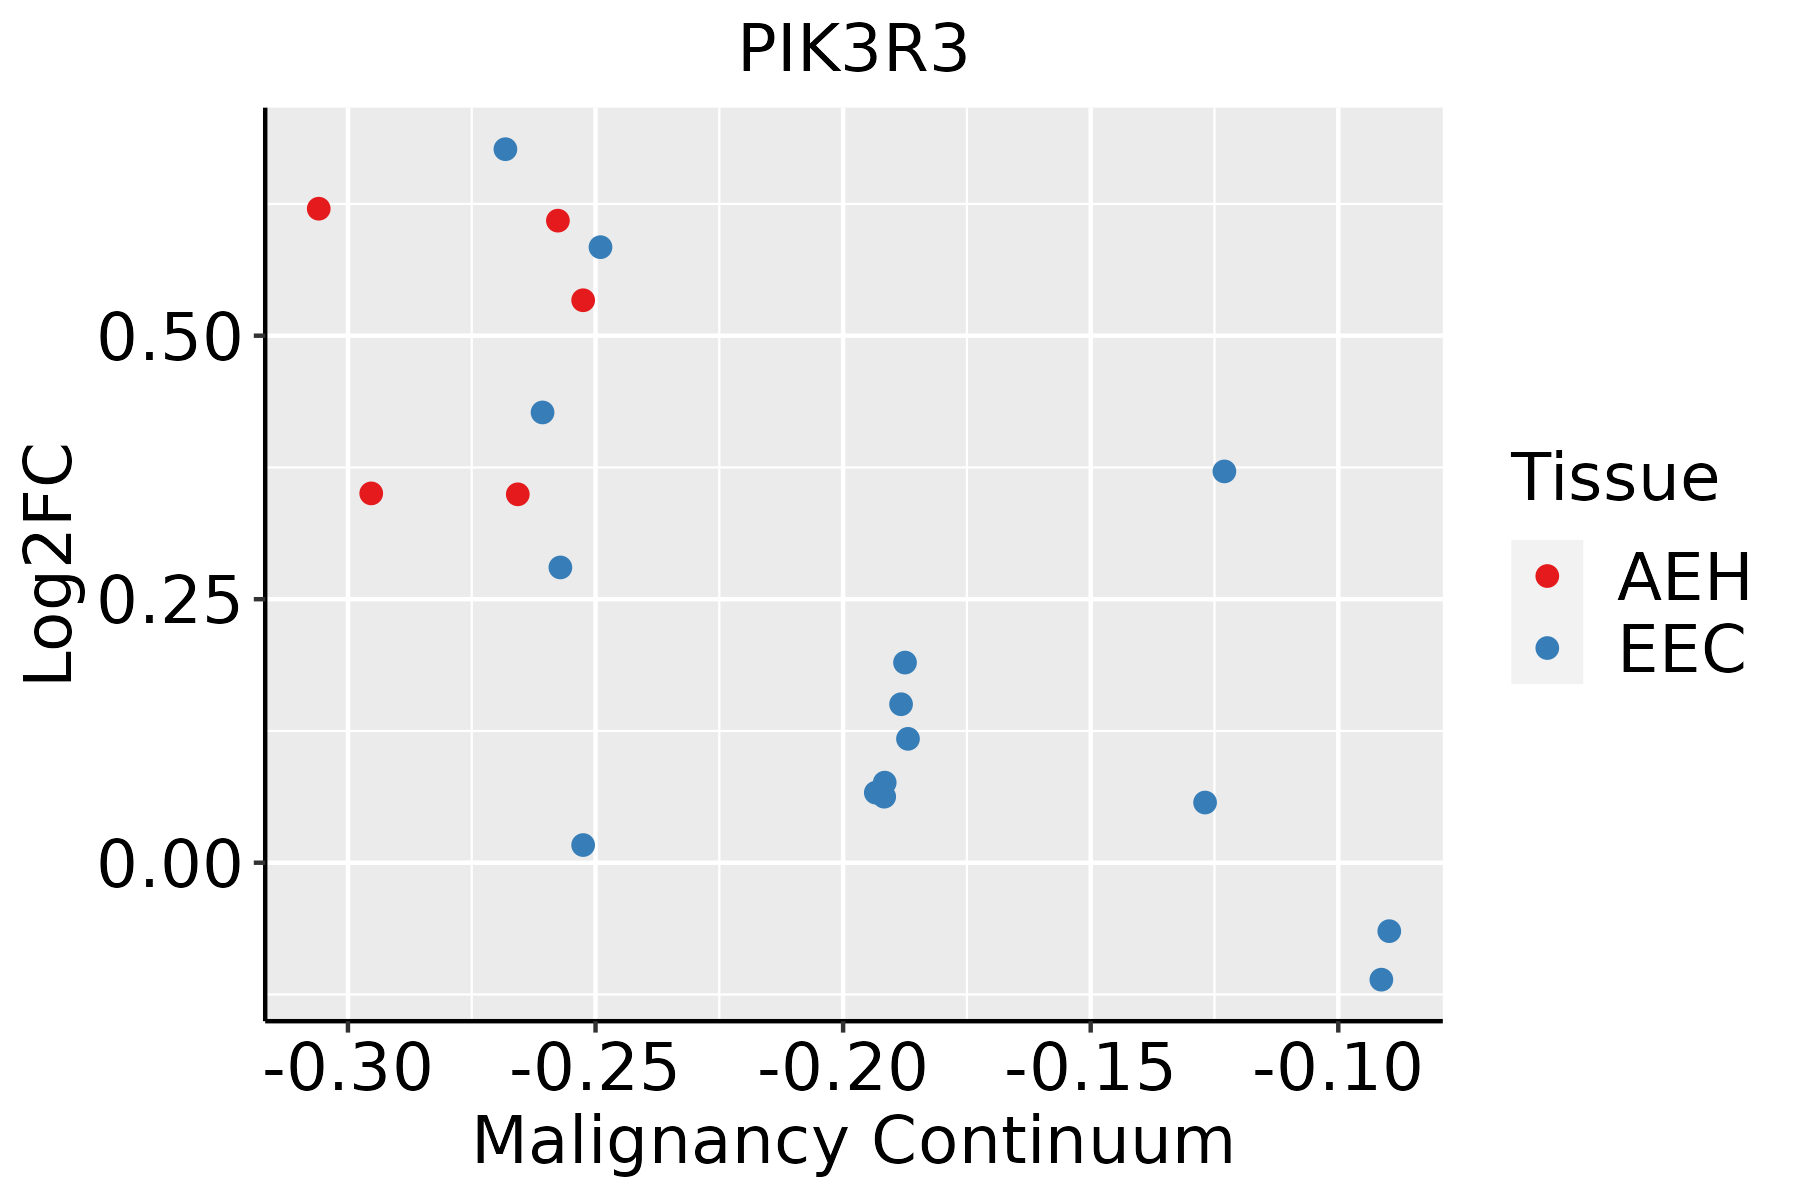 | AEH: Atypical endometrial hyperplasia |
| EEC: Endometrioid Cancer | ||
| Esophagus |  | ESCC: Esophageal squamous cell carcinoma |
| HGIN: High-grade intraepithelial neoplasias | ||
| LGIN: Low-grade intraepithelial neoplasias | ||
| Lung |  | AAH: Atypical adenomatous hyperplasia |
| AIS: Adenocarcinoma in situ | ||
| IAC: Invasive lung adenocarcinoma | ||
| MIA: Minimally invasive adenocarcinoma |
| ∗log2FC in expression of this searched gene in stem-like cells from each diseased tissue sample relative to stem-like cells in normal samples in each tissue plotted against the malignancy continuum. Samples are colored based on if they are from different disease stage. |
Top |
Malignant transformation related pathway analysis |
| Find out the enriched GO biological processes and KEGG pathways involved in transition from healthy to precancer to cancer |
| Tissue | Disease Stage | Enriched GO biological Processes |
| Colorectum | AD |  |
| Colorectum | SER |  |
| Colorectum | MSS |  |
| Colorectum | MSI-H |  |
| Colorectum | FAP |  |
| ∗Top 15 enriched GO BP terms are showed in the bar plot of each disease state in each tissue. Each row represents a significant GO biological process which is colored according to the -log10(p.adjust). |
| Page: 1 2 3 4 5 6 7 8 9 |
| GO ID | Tissue | Disease Stage | Description | Gene Ratio | Bg Ratio | pvalue | p.adjust | Count |
| GO:000166710 | Endometrium | AEH | ameboidal-type cell migration | 90/2100 | 475/18723 | 3.73e-07 | 1.57e-05 | 90 |
| GO:009013014 | Endometrium | AEH | tissue migration | 73/2100 | 365/18723 | 5.79e-07 | 2.20e-05 | 73 |
| GO:009013214 | Endometrium | AEH | epithelium migration | 72/2100 | 360/18723 | 6.90e-07 | 2.55e-05 | 72 |
| GO:001063114 | Endometrium | AEH | epithelial cell migration | 71/2100 | 357/18723 | 1.02e-06 | 3.52e-05 | 71 |
| GO:00435428 | Endometrium | AEH | endothelial cell migration | 55/2100 | 279/18723 | 2.11e-05 | 4.15e-04 | 55 |
| GO:19016539 | Endometrium | AEH | cellular response to peptide | 64/2100 | 359/18723 | 1.16e-04 | 1.63e-03 | 64 |
| GO:004343410 | Endometrium | AEH | response to peptide hormone | 70/2100 | 414/18723 | 2.93e-04 | 3.35e-03 | 70 |
| GO:00328699 | Endometrium | AEH | cellular response to insulin stimulus | 37/2100 | 203/18723 | 1.97e-03 | 1.54e-02 | 37 |
| GO:00713758 | Endometrium | AEH | cellular response to peptide hormone stimulus | 49/2100 | 290/18723 | 2.24e-03 | 1.72e-02 | 49 |
| GO:00434914 | Endometrium | AEH | protein kinase B signaling | 37/2100 | 211/18723 | 3.89e-03 | 2.64e-02 | 37 |
| GO:00435342 | Endometrium | AEH | blood vessel endothelial cell migration | 32/2100 | 176/18723 | 3.97e-03 | 2.66e-02 | 32 |
| GO:00082866 | Endometrium | AEH | insulin receptor signaling pathway | 23/2100 | 116/18723 | 4.58e-03 | 2.95e-02 | 23 |
| GO:00328689 | Endometrium | AEH | response to insulin | 44/2100 | 264/18723 | 4.70e-03 | 3.00e-02 | 44 |
| GO:000166716 | Endometrium | EEC | ameboidal-type cell migration | 91/2168 | 475/18723 | 7.87e-07 | 2.80e-05 | 91 |
| GO:009013015 | Endometrium | EEC | tissue migration | 73/2168 | 365/18723 | 1.91e-06 | 5.78e-05 | 73 |
| GO:009013215 | Endometrium | EEC | epithelium migration | 72/2168 | 360/18723 | 2.24e-06 | 6.59e-05 | 72 |
| GO:001063115 | Endometrium | EEC | epithelial cell migration | 71/2168 | 357/18723 | 3.24e-06 | 8.85e-05 | 71 |
| GO:190165314 | Endometrium | EEC | cellular response to peptide | 68/2168 | 359/18723 | 2.75e-05 | 4.83e-04 | 68 |
| GO:004354213 | Endometrium | EEC | endothelial cell migration | 55/2168 | 279/18723 | 5.12e-05 | 8.18e-04 | 55 |
| GO:004343416 | Endometrium | EEC | response to peptide hormone | 74/2168 | 414/18723 | 9.11e-05 | 1.28e-03 | 74 |
| Page: 1 2 3 4 |
| Pathway ID | Tissue | Disease Stage | Description | Gene Ratio | Bg Ratio | pvalue | p.adjust | qvalue | Count |
| hsa05220110 | Esophagus | ESCC | Chronic myeloid leukemia | 61/4205 | 76/8465 | 3.20e-08 | 2.68e-07 | 1.37e-07 | 61 |
| hsa0414015 | Esophagus | ESCC | Autophagy - animal | 101/4205 | 141/8465 | 7.60e-08 | 6.21e-07 | 3.18e-07 | 101 |
| hsa0520537 | Esophagus | ESCC | Proteoglycans in cancer | 138/4205 | 205/8465 | 1.79e-07 | 1.40e-06 | 7.15e-07 | 138 |
| hsa0520335 | Esophagus | ESCC | Viral carcinogenesis | 137/4205 | 204/8465 | 2.47e-07 | 1.88e-06 | 9.62e-07 | 137 |
| hsa05417310 | Esophagus | ESCC | Lipid and atherosclerosis | 143/4205 | 215/8465 | 3.30e-07 | 2.45e-06 | 1.26e-06 | 143 |
| hsa0522216 | Esophagus | ESCC | Small cell lung cancer | 69/4205 | 92/8465 | 5.40e-07 | 3.85e-06 | 1.97e-06 | 69 |
| hsa0516338 | Esophagus | ESCC | Human cytomegalovirus infection | 148/4205 | 225/8465 | 5.73e-07 | 4.00e-06 | 2.05e-06 | 148 |
| hsa0521517 | Esophagus | ESCC | Prostate cancer | 72/4205 | 97/8465 | 6.12e-07 | 4.10e-06 | 2.10e-06 | 72 |
| hsa05100310 | Esophagus | ESCC | Bacterial invasion of epithelial cells | 59/4205 | 77/8465 | 1.05e-06 | 6.76e-06 | 3.46e-06 | 59 |
| hsa0516016 | Esophagus | ESCC | Hepatitis C | 107/4205 | 157/8465 | 1.75e-06 | 1.08e-05 | 5.55e-06 | 107 |
| hsa0152414 | Esophagus | ESCC | Platinum drug resistance | 56/4205 | 73/8465 | 1.85e-06 | 1.13e-05 | 5.78e-06 | 56 |
| hsa0407117 | Esophagus | ESCC | Sphingolipid signaling pathway | 85/4205 | 121/8465 | 3.04e-06 | 1.73e-05 | 8.84e-06 | 85 |
| hsa0493317 | Esophagus | ESCC | AGE-RAGE signaling pathway in diabetic complications | 72/4205 | 100/8465 | 4.15e-06 | 2.28e-05 | 1.17e-05 | 72 |
| hsa0516114 | Esophagus | ESCC | Hepatitis B | 108/4205 | 162/8465 | 7.68e-06 | 4.15e-05 | 2.12e-05 | 108 |
| hsa05213110 | Esophagus | ESCC | Endometrial cancer | 45/4205 | 58/8465 | 1.14e-05 | 5.98e-05 | 3.06e-05 | 45 |
| hsa0406814 | Esophagus | ESCC | FoxO signaling pathway | 89/4205 | 131/8465 | 1.56e-05 | 7.98e-05 | 4.09e-05 | 89 |
| hsa0462513 | Esophagus | ESCC | C-type lectin receptor signaling pathway | 73/4205 | 104/8465 | 1.57e-05 | 7.98e-05 | 4.09e-05 | 73 |
| hsa0521119 | Esophagus | ESCC | Renal cell carcinoma | 51/4205 | 69/8465 | 3.29e-05 | 1.53e-04 | 7.83e-05 | 51 |
| hsa04066113 | Esophagus | ESCC | HIF-1 signaling pathway | 75/4205 | 109/8465 | 3.66e-05 | 1.68e-04 | 8.60e-05 | 75 |
| hsa0522519 | Esophagus | ESCC | Hepatocellular carcinoma | 109/4205 | 168/8465 | 4.27e-05 | 1.88e-04 | 9.64e-05 | 109 |
| Page: 1 2 3 4 5 6 7 8 9 10 11 12 13 14 15 16 17 18 19 20 21 22 23 24 25 |
Top |
Cell-cell communication analysis |
| Identification of potential cell-cell interactions between two cell types and their ligand-receptor pairs for different disease states |
| Ligand | Receptor | LRpair | Pathway | Tissue | Disease Stage |
| Page: 1 |
Top |
Single-cell gene regulatory network inference analysis |
| Find out the significant the regulons (TFs) and the target genes of each regulon across cell types for different disease states |
| TF | Cell Type | Tissue | Disease Stage | Target Gene | RSS | Regulon Activity |
| ∗The dot plots of a searched regulon are shown for all cell subpopulations in each disease state of each tissue based on the regulon specific score inferred using pySCENIC and by calculating the average expression. |
| Page: 1 |
Top |
Somatic mutation of malignant transformation related genes |
| Annotation of somatic variants for genes involved in malignant transformation |
| Hugo Symbol | Variant Class | Variant Classification | dbSNP RS | HGVSc | HGVSp | HGVSp Short | SWISSPROT | BIOTYPE | SIFT | PolyPhen | Tumor Sample Barcode | Tissue | Histology | Sex | Age | Stage | Therapy Types | Drugs | Outcome |
| PIK3R3 | SNV | Missense_Mutation | c.1103C>T | p.Ala368Val | p.A368V | Q92569 | protein_coding | deleterious(0.04) | probably_damaging(0.967) | TCGA-AR-A24H-01 | Breast | breast invasive carcinoma | Female | >=65 | I/II | Hormone Therapy | tamoxiphen | SD | |
| PIK3R3 | SNV | Missense_Mutation | rs779089992 | c.280N>G | p.Thr94Ala | p.T94A | Q92569 | protein_coding | deleterious(0.02) | benign(0.072) | TCGA-E2-A14S-01 | Breast | breast invasive carcinoma | Female | >=65 | I/II | Chemotherapy | cytoxan | SD |
| PIK3R3 | SNV | Missense_Mutation | c.977N>G | p.Leu326Arg | p.L326R | Q92569 | protein_coding | deleterious(0) | benign(0.038) | TCGA-E2-A15K-06 | Breast | breast invasive carcinoma | Female | <65 | I/II | Chemotherapy | adriamycin | SD | |
| PIK3R3 | SNV | Missense_Mutation | novel | c.499N>G | p.Gln167Glu | p.Q167E | Q92569 | protein_coding | tolerated(0.4) | benign(0.084) | TCGA-S3-AA10-01 | Breast | breast invasive carcinoma | Female | >=65 | I/II | Chemotherapy | cytoxan | CR |
| PIK3R3 | deletion | Frame_Shift_Del | c.883delN | p.Met295Ter | p.M295* | Q92569 | protein_coding | TCGA-D8-A1XK-01 | Breast | breast invasive carcinoma | Female | <65 | I/II | Chemotherapy | doxorubicine+cyclophosphamide | SD | |||
| PIK3R3 | SNV | Missense_Mutation | novel | c.1304C>T | p.Thr435Ile | p.T435I | Q92569 | protein_coding | deleterious(0.01) | benign(0.083) | TCGA-2W-A8YY-01 | Cervix | cervical & endocervical cancer | Female | <65 | I/II | Chemotherapy | cisplatin | CR |
| PIK3R3 | SNV | Missense_Mutation | novel | c.314G>A | p.Arg105Gln | p.R105Q | Q92569 | protein_coding | deleterious(0.01) | probably_damaging(0.994) | TCGA-2W-A8YY-01 | Cervix | cervical & endocervical cancer | Female | <65 | I/II | Chemotherapy | cisplatin | CR |
| PIK3R3 | SNV | Missense_Mutation | novel | c.1010C>G | p.Ala337Gly | p.A337G | Q92569 | protein_coding | tolerated(0.49) | benign(0) | TCGA-C5-A2M1-01 | Cervix | cervical & endocervical cancer | Female | <65 | I/II | Unknown | Unknown | SD |
| PIK3R3 | SNV | Missense_Mutation | rs780117361 | c.116N>G | p.Pro39Arg | p.P39R | Q92569 | protein_coding | deleterious(0) | benign(0.36) | TCGA-EK-A2RJ-01 | Cervix | cervical & endocervical cancer | Female | <65 | I/II | Unknown | Unknown | SD |
| PIK3R3 | SNV | Missense_Mutation | c.1015N>A | p.Glu339Lys | p.E339K | Q92569 | protein_coding | tolerated(0.12) | benign(0.06) | TCGA-IR-A3LA-01 | Cervix | cervical & endocervical cancer | Female | <65 | I/II | Chemotherapy | cisplatin | CR |
| Page: 1 2 3 4 5 6 7 |
Top |
Related drugs of malignant transformation related genes |
| Identification of chemicals and drugs interact with genes involved in malignant transfromation |
| (DGIdb 4.0) |
| Entrez ID | Symbol | Category | Interaction Types | Drug Claim Name | Drug Name | PMIDs |
| 8503 | PIK3R3 | KINASE, ENZYME, PHOSPHATIDYLINOSITOL 3 KINASE, CLINICALLY ACTIONABLE | inhibitor | GDC-0941 | PICTILISIB | |
| 8503 | PIK3R3 | KINASE, ENZYME, PHOSPHATIDYLINOSITOL 3 KINASE, CLINICALLY ACTIONABLE | inhibitor | CHEMBL1079593 | VS-5584 | |
| 8503 | PIK3R3 | KINASE, ENZYME, PHOSPHATIDYLINOSITOL 3 KINASE, CLINICALLY ACTIONABLE | inhibitor | XL-765 | VOXTALISIB | |
| 8503 | PIK3R3 | KINASE, ENZYME, PHOSPHATIDYLINOSITOL 3 KINASE, CLINICALLY ACTIONABLE | inhibitor | CHEMBL1234354 | PF-04691502 | |
| 8503 | PIK3R3 | KINASE, ENZYME, PHOSPHATIDYLINOSITOL 3 KINASE, CLINICALLY ACTIONABLE | inhibitor | BKM120 | BUPARLISIB | |
| 8503 | PIK3R3 | KINASE, ENZYME, PHOSPHATIDYLINOSITOL 3 KINASE, CLINICALLY ACTIONABLE | inhibitor | CHEMBL3360203 | PILARALISIB | |
| 8503 | PIK3R3 | KINASE, ENZYME, PHOSPHATIDYLINOSITOL 3 KINASE, CLINICALLY ACTIONABLE | inhibitor | BAY80-6946 | COPANLISIB | |
| 8503 | PIK3R3 | KINASE, ENZYME, PHOSPHATIDYLINOSITOL 3 KINASE, CLINICALLY ACTIONABLE | inhibitor | CHEMBL586701 | ZSTK-474 | |
| 8503 | PIK3R3 | KINASE, ENZYME, PHOSPHATIDYLINOSITOL 3 KINASE, CLINICALLY ACTIONABLE | inhibitor | CHEMBL2017974 | BUPARLISIB | |
| 8503 | PIK3R3 | KINASE, ENZYME, PHOSPHATIDYLINOSITOL 3 KINASE, CLINICALLY ACTIONABLE | inhibitor | CHEMBL2165191 | AZD-6482 |
| Page: 1 2 3 4 5 6 |

Copyright 2023-Present -The University of Texas Health Science Center at Houston |