| Tissue | Expression Dynamics | Abbreviation |
| Endometrium | 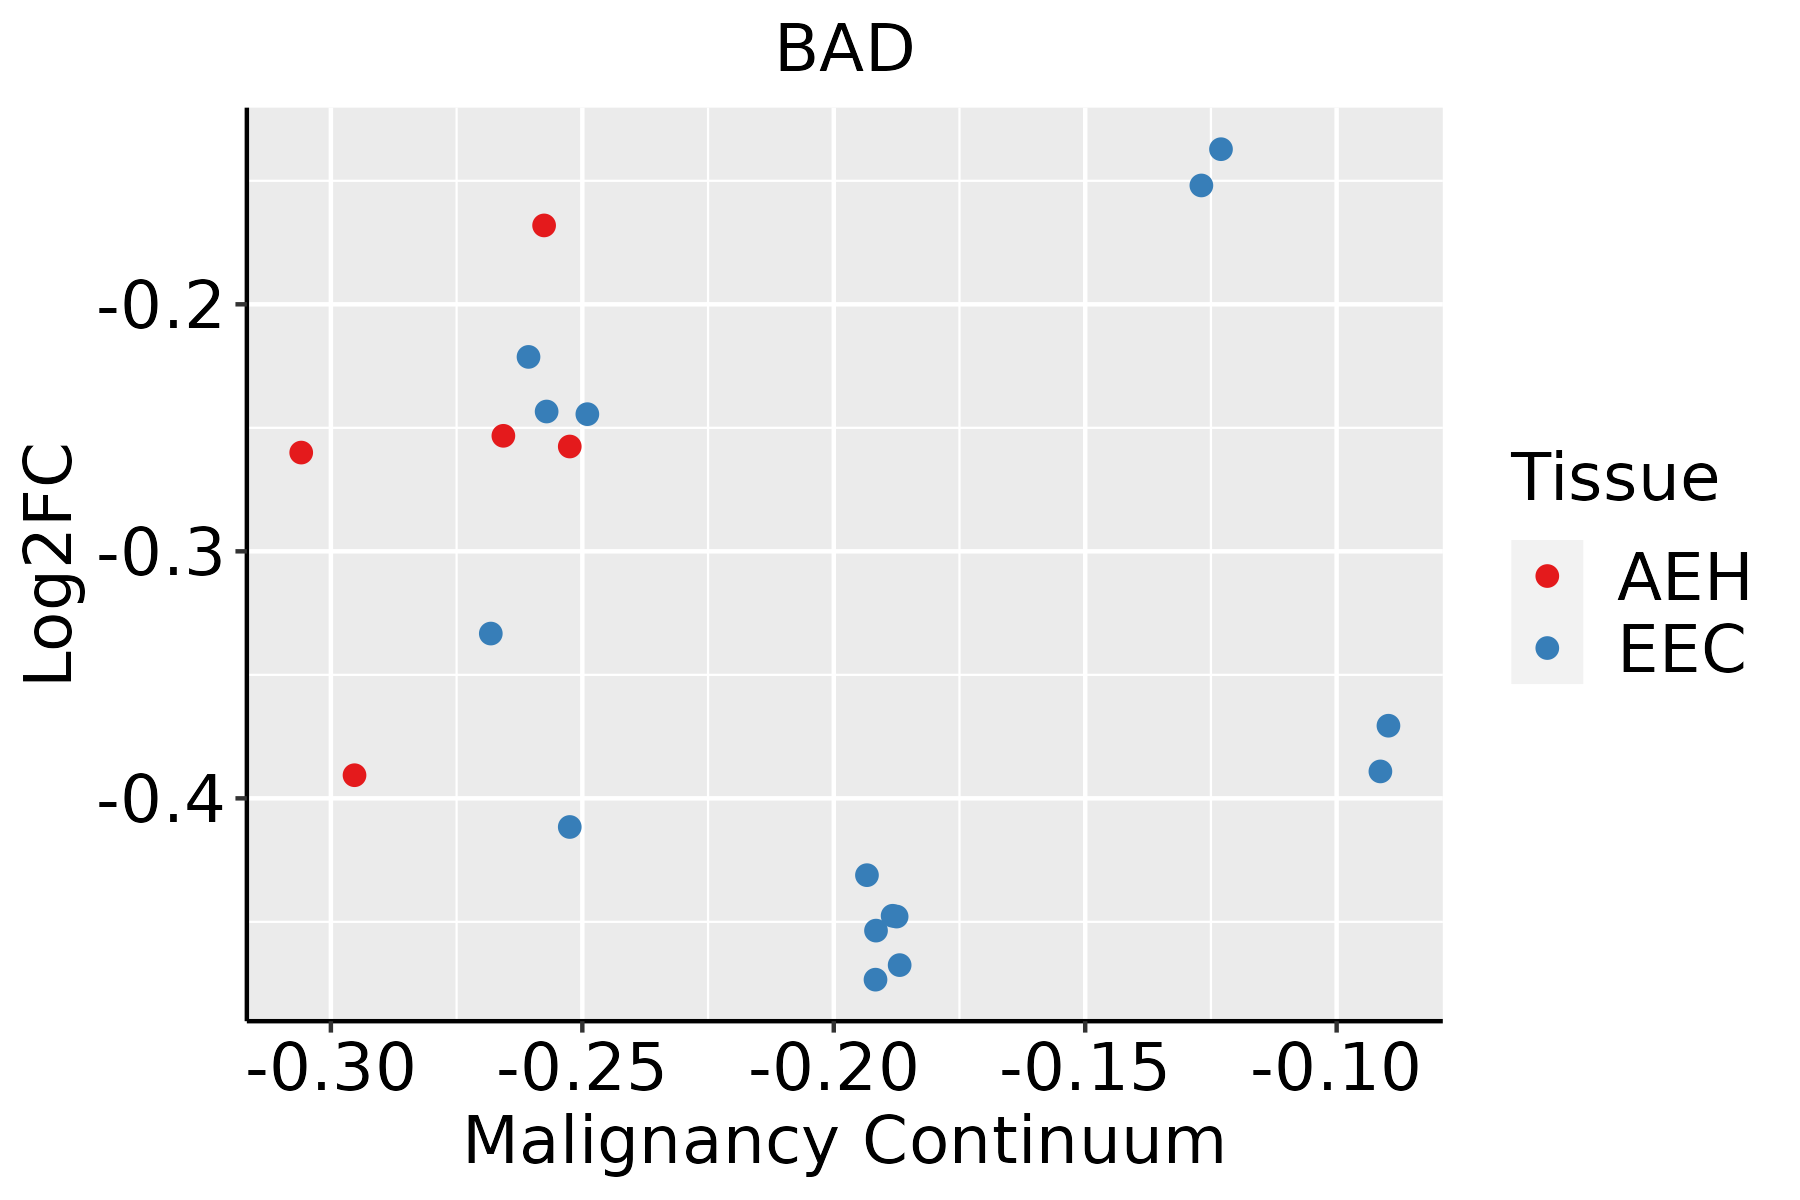 | AEH: Atypical endometrial hyperplasia |
| EEC: Endometrioid Cancer |
| Esophagus | 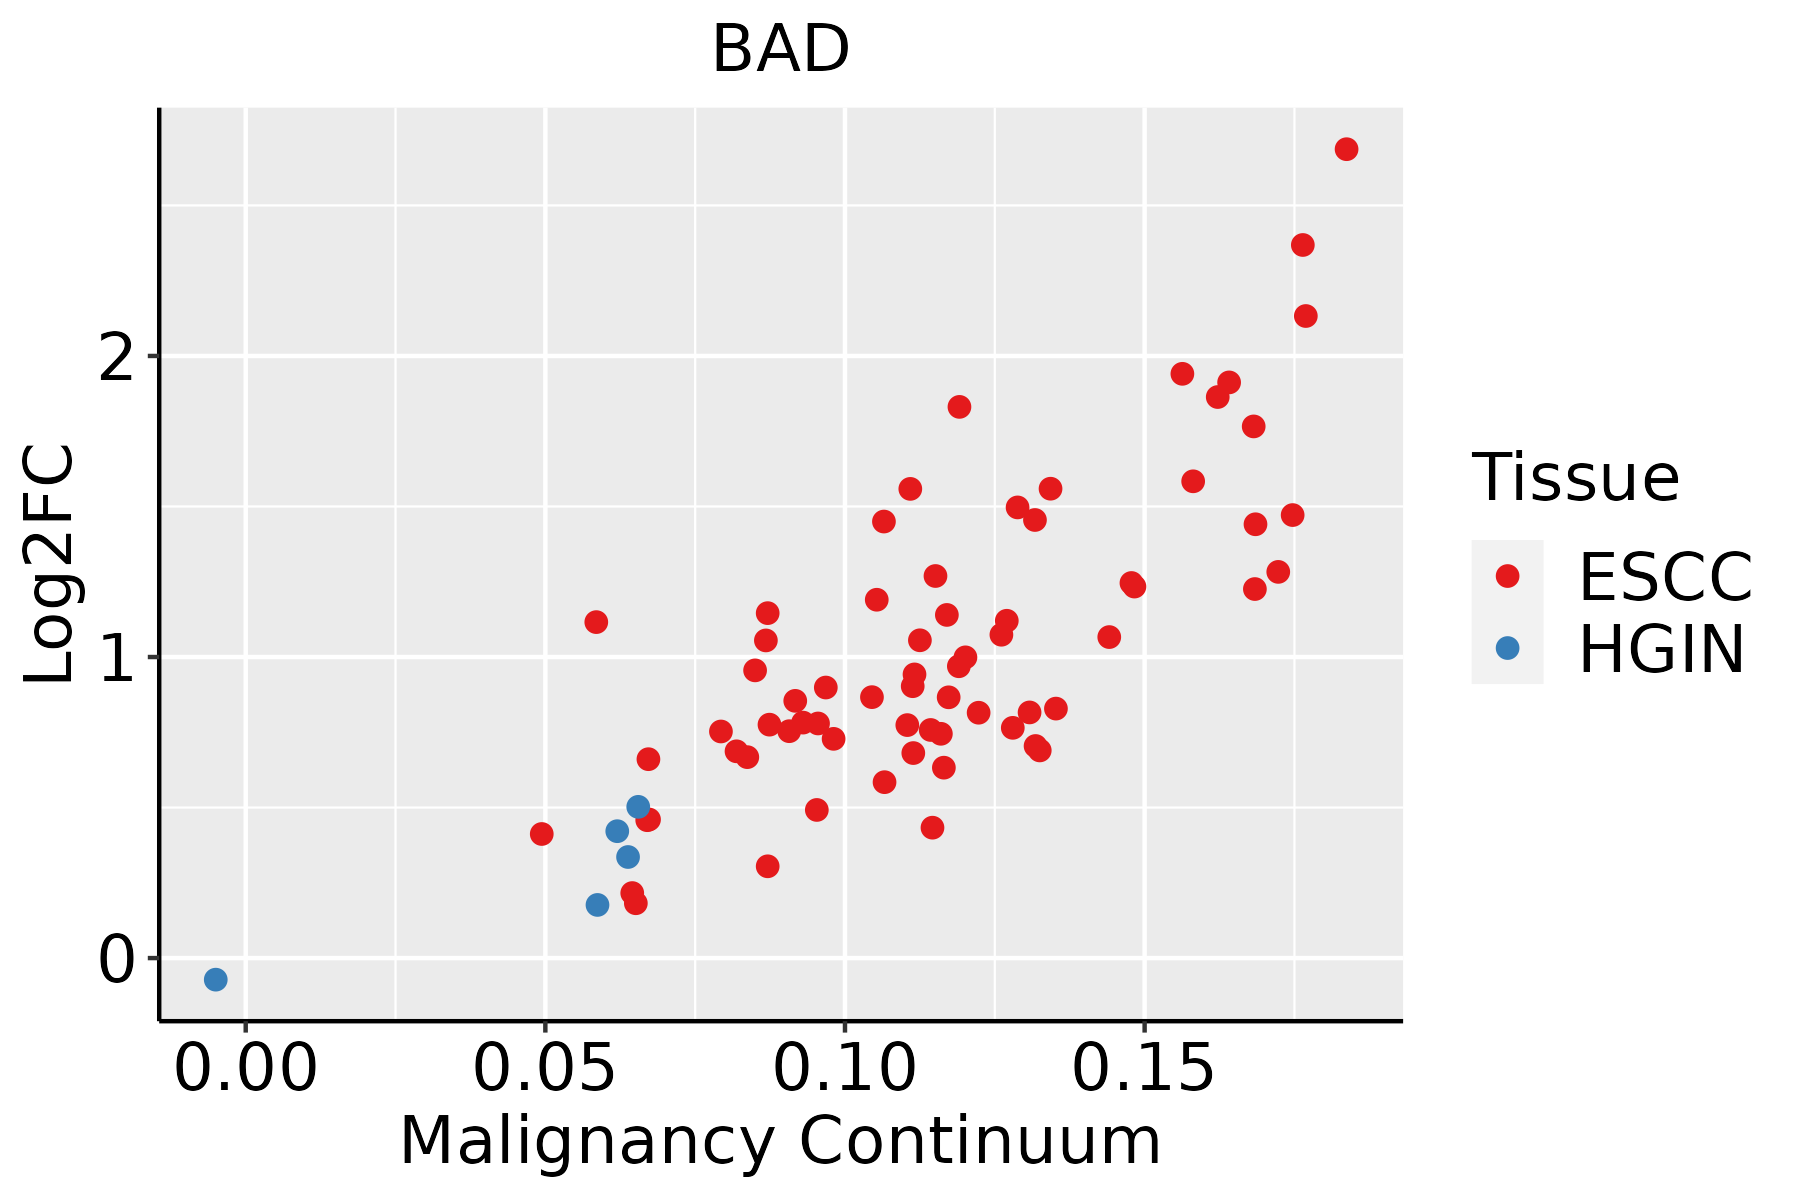 | ESCC: Esophageal squamous cell carcinoma |
| HGIN: High-grade intraepithelial neoplasias |
| LGIN: Low-grade intraepithelial neoplasias |
| Liver | 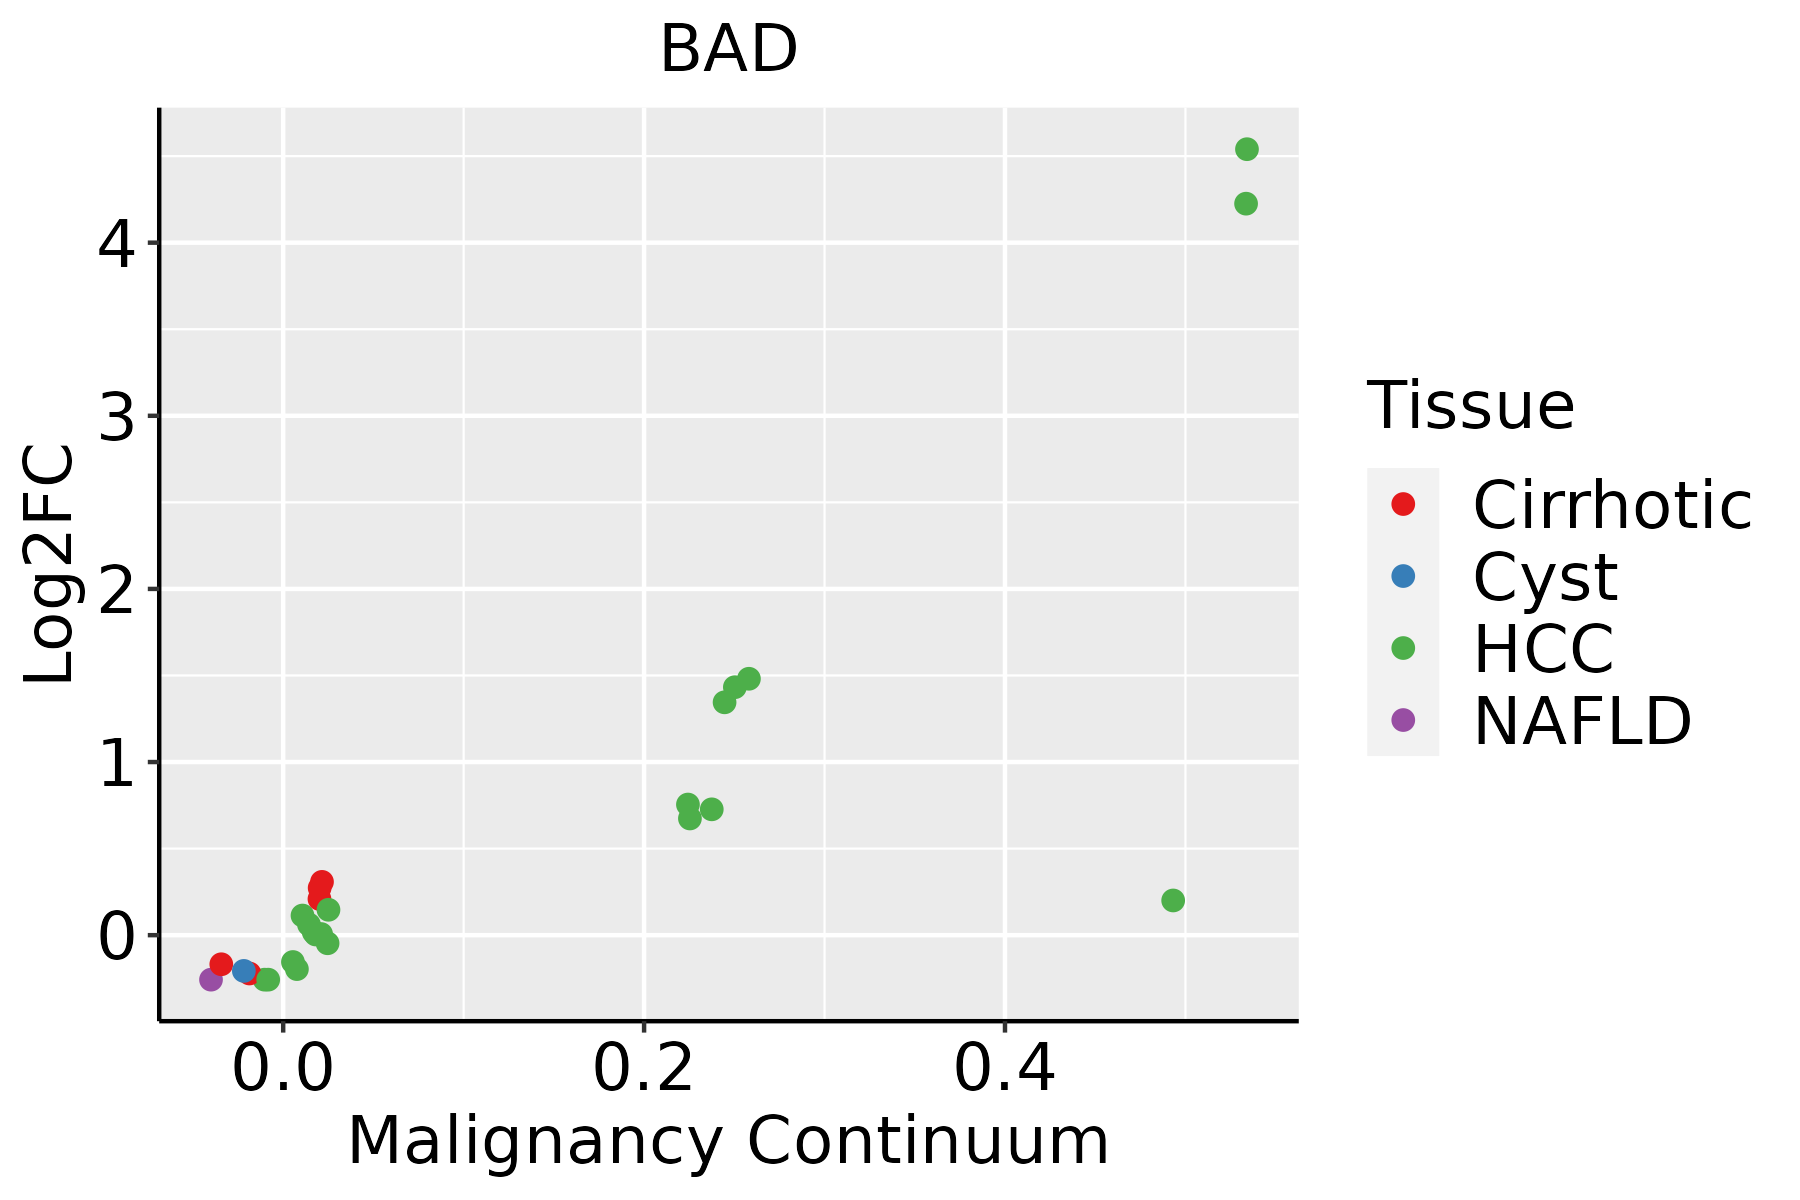 | HCC: Hepatocellular carcinoma |
| NAFLD: Non-alcoholic fatty liver disease |
| Oral Cavity | 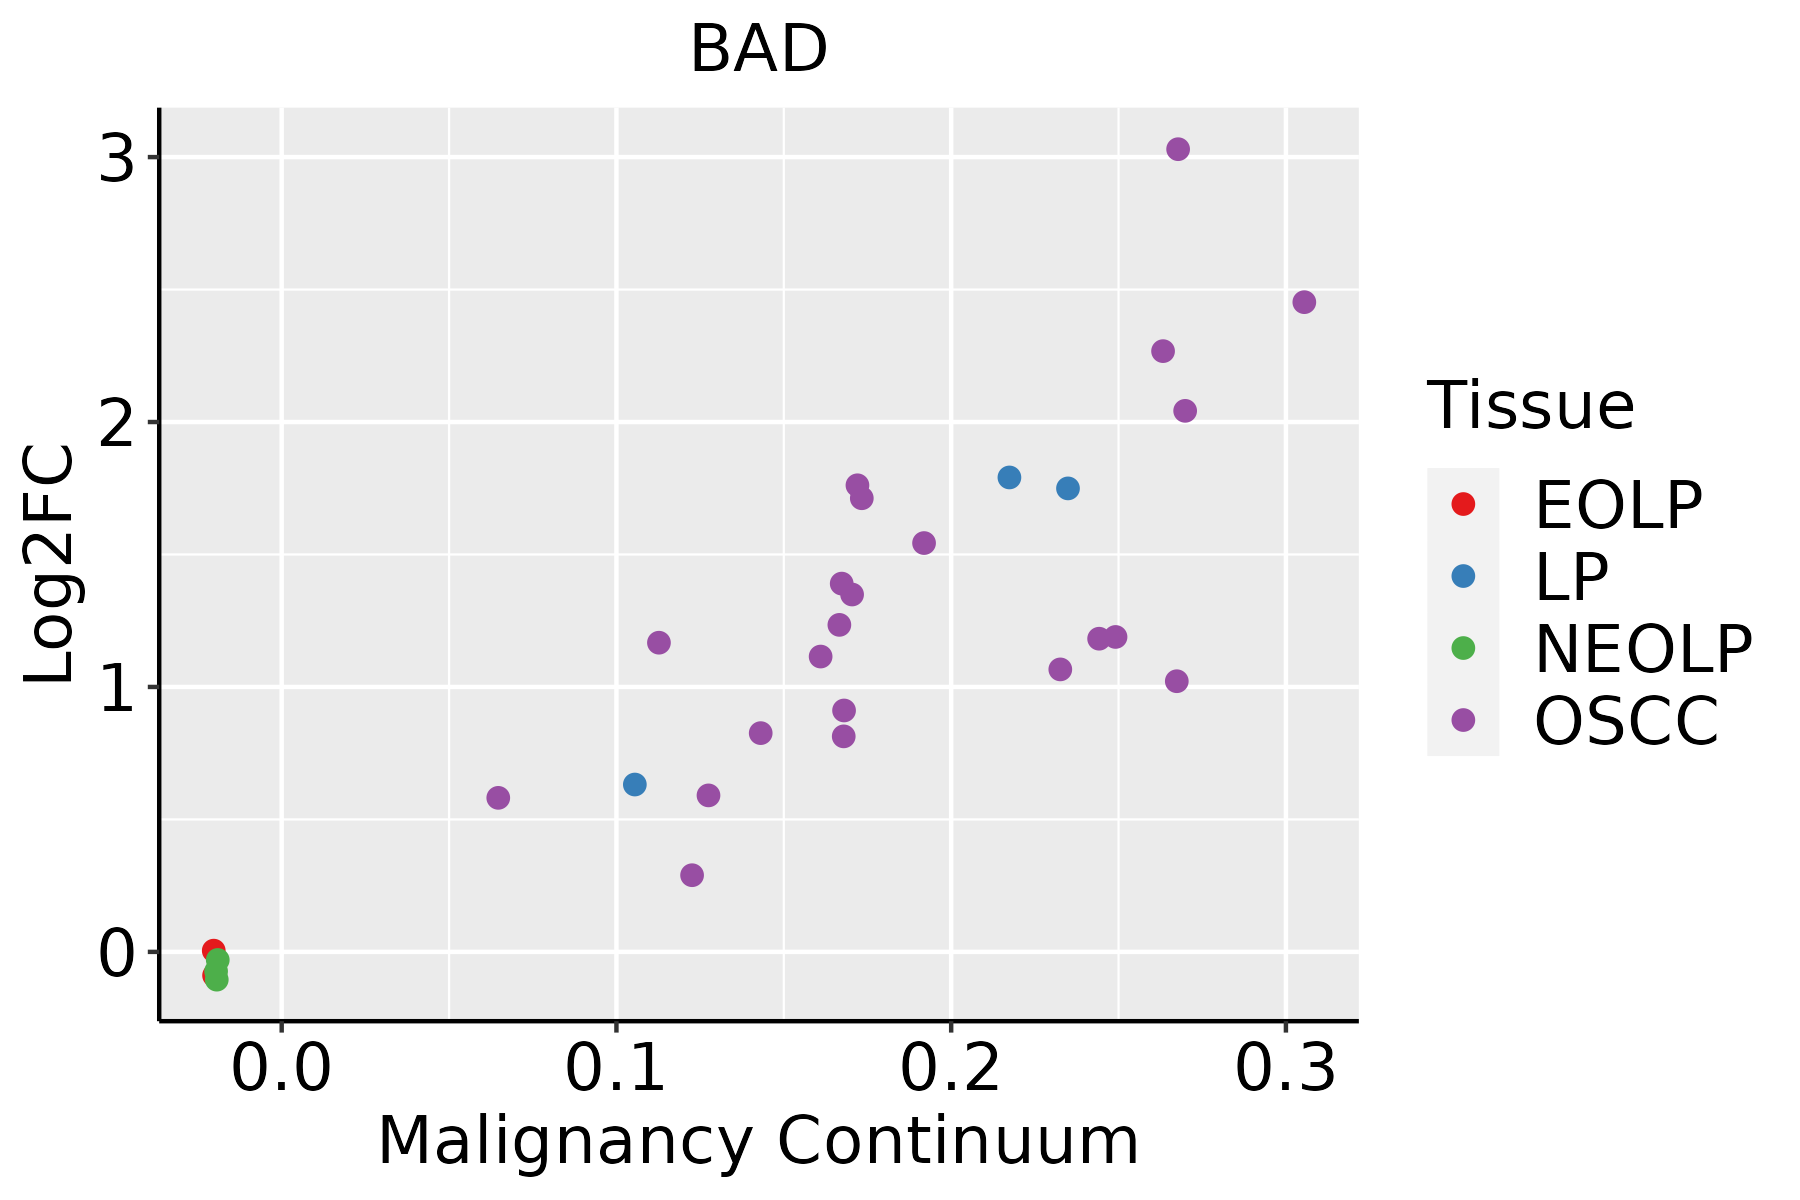 | EOLP: Erosive Oral lichen planus |
| LP: leukoplakia |
| NEOLP: Non-erosive oral lichen planus |
| OSCC: Oral squamous cell carcinoma |
| Prostate | 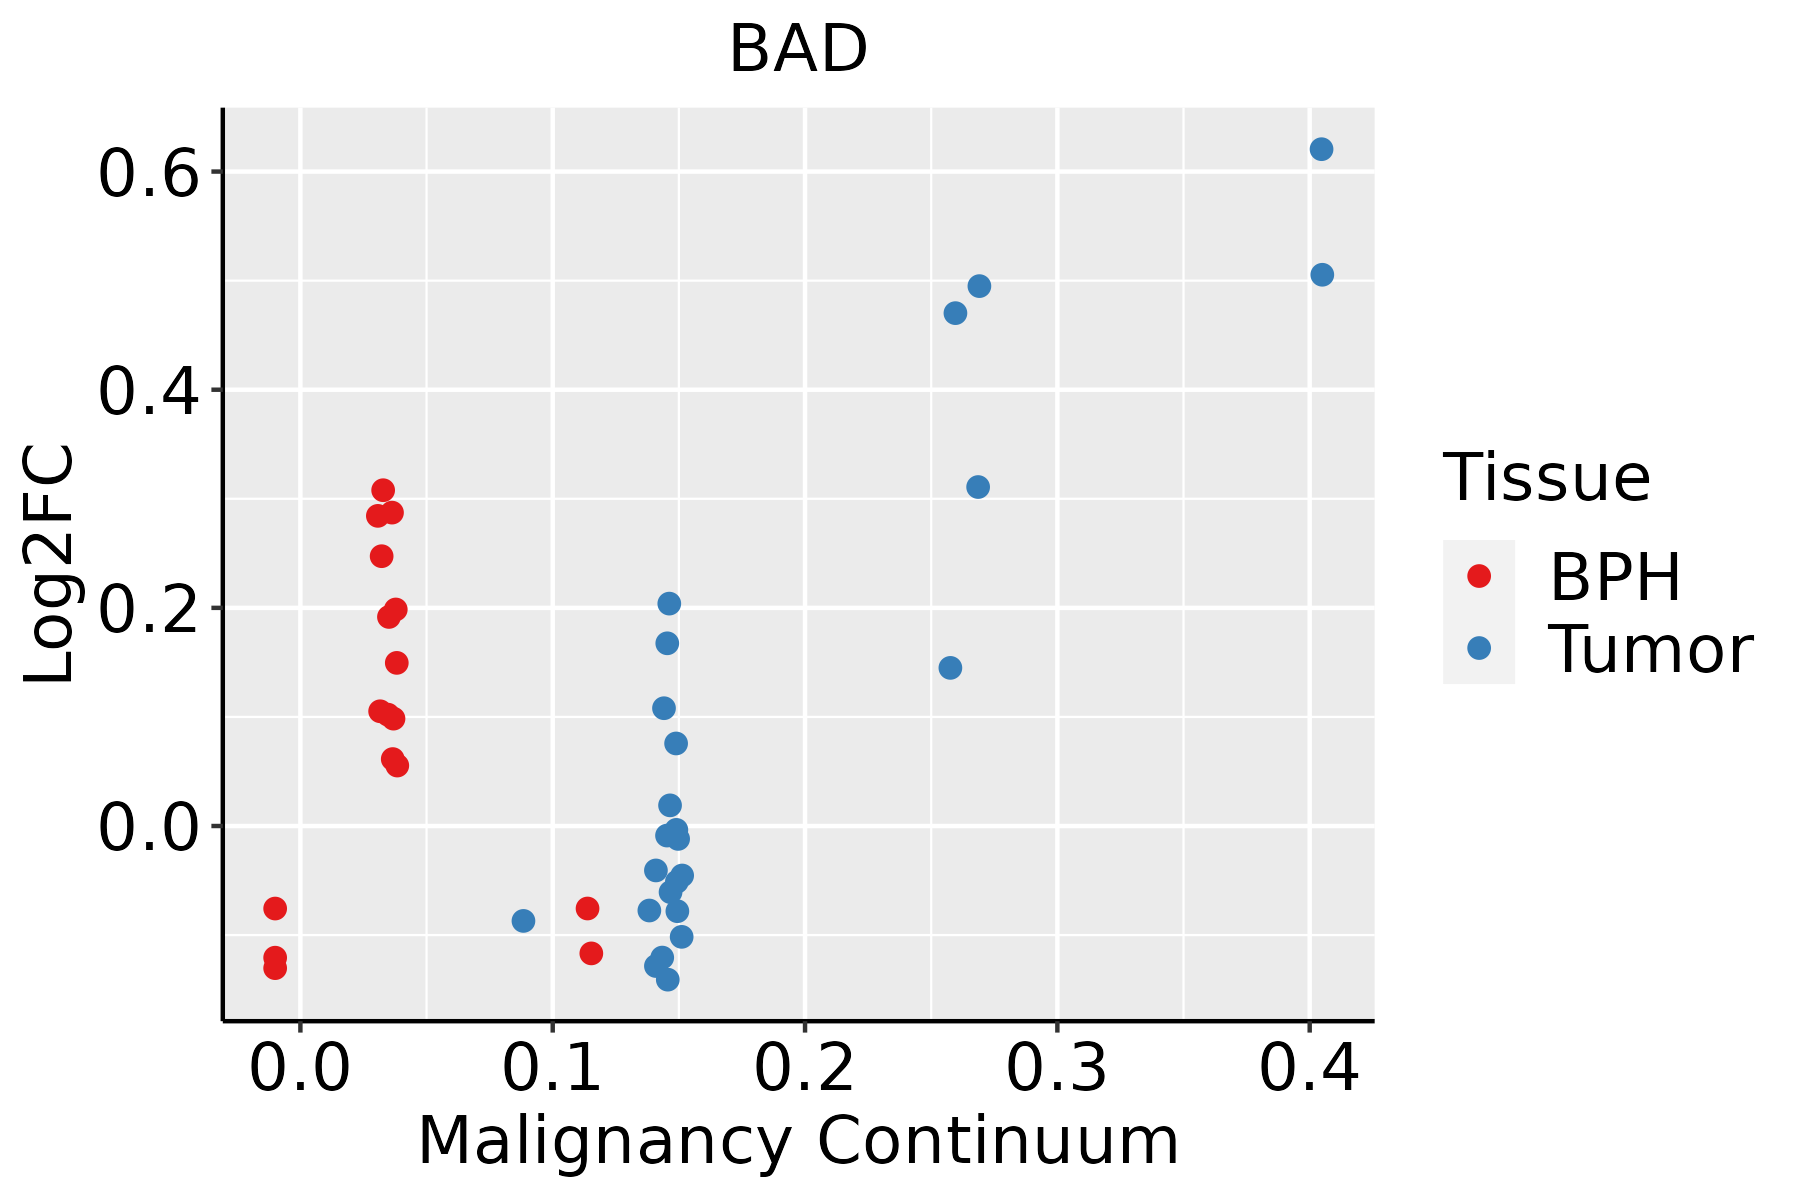 | BPH: Benign Prostatic Hyperplasia |
| Skin |  | AK: Actinic keratosis |
| cSCC: Cutaneous squamous cell carcinoma |
| SCCIS:squamous cell carcinoma in situ |
| Thyroid | 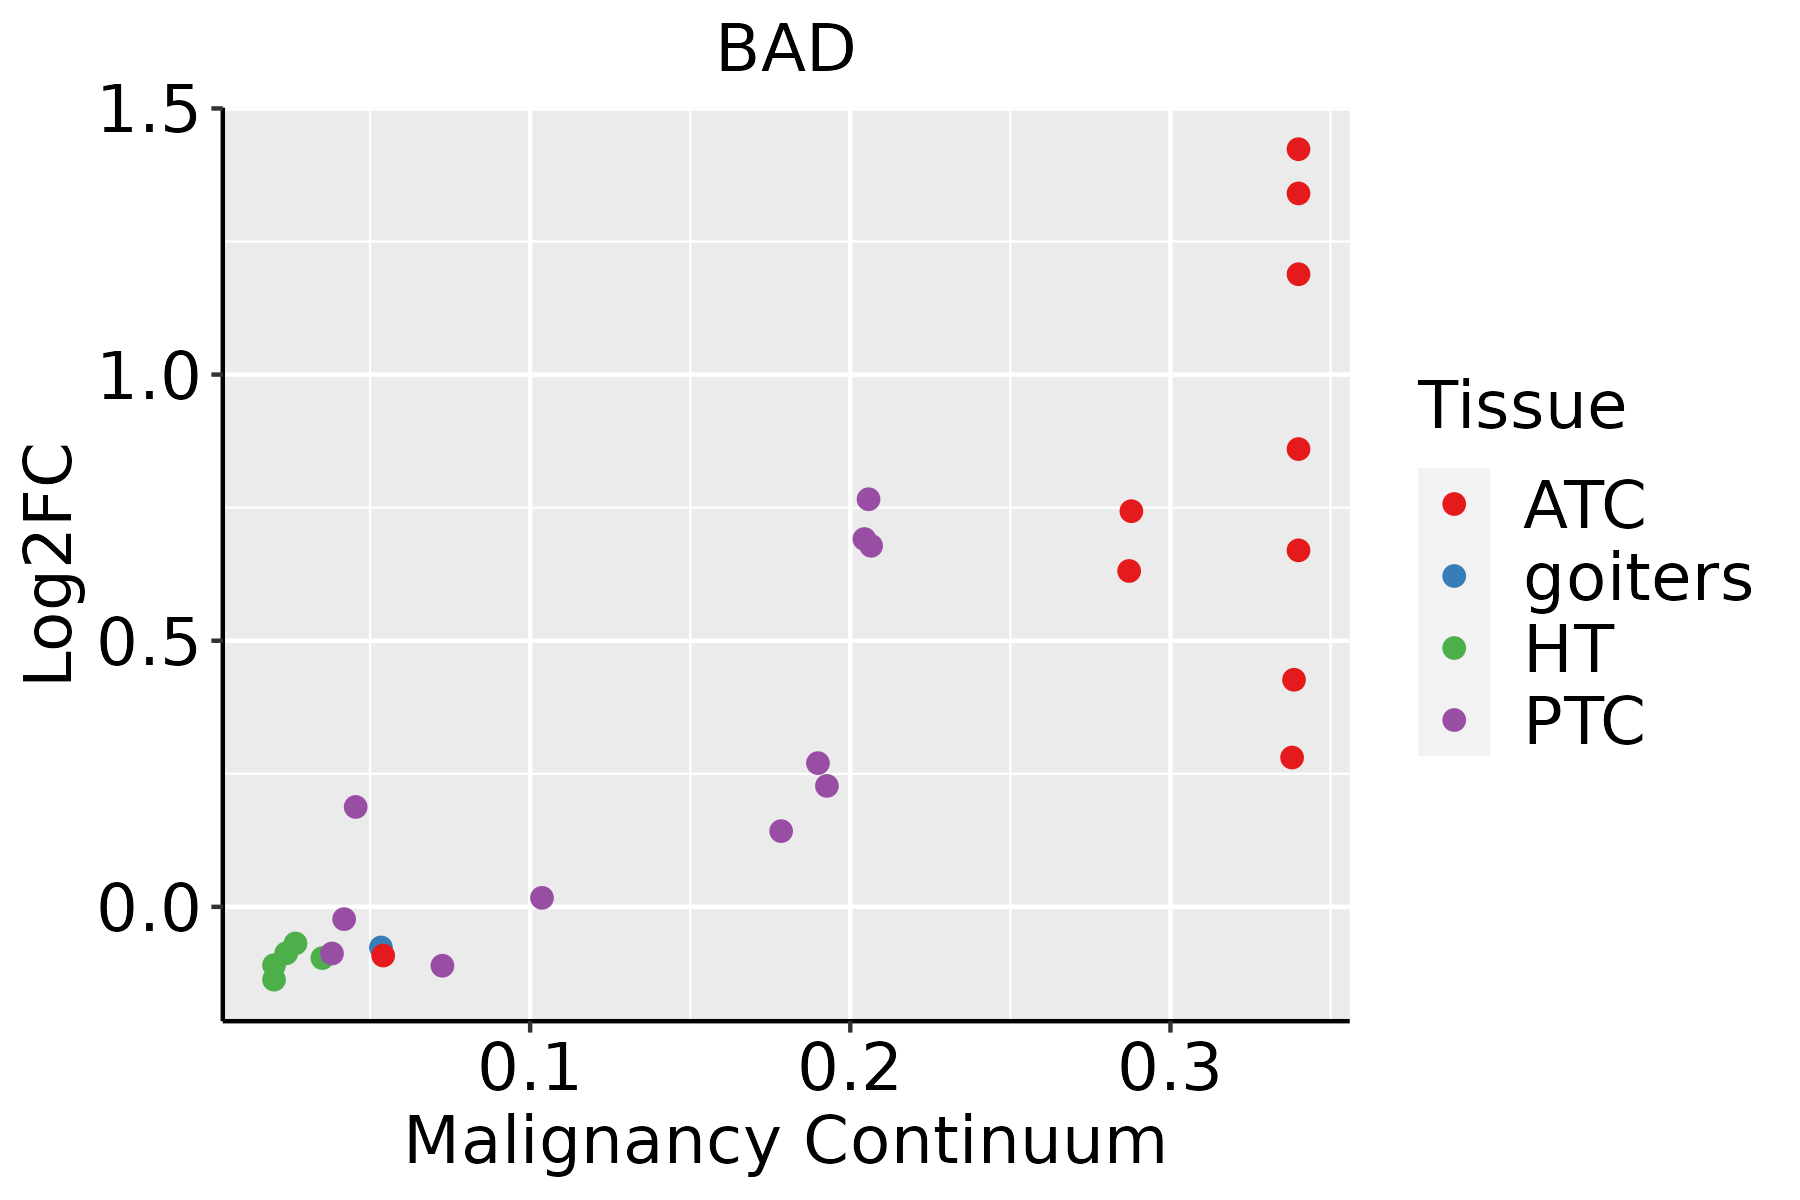 | ATC: Anaplastic thyroid cancer |
| HT: Hashimoto's thyroiditis |
| PTC: Papillary thyroid cancer |
| GO ID | Tissue | Disease Stage | Description | Gene Ratio | Bg Ratio | pvalue | p.adjust | Count |
| GO:0044282 | Colorectum | AD | small molecule catabolic process | 118/3918 | 376/18723 | 1.05e-06 | 3.55e-05 | 118 |
| GO:0009083 | Colorectum | AD | branched-chain amino acid catabolic process | 10/3918 | 15/18723 | 1.68e-04 | 2.29e-03 | 10 |
| GO:0016054 | Colorectum | AD | organic acid catabolic process | 73/3918 | 240/18723 | 3.20e-04 | 3.81e-03 | 73 |
| GO:0046395 | Colorectum | AD | carboxylic acid catabolic process | 70/3918 | 236/18723 | 9.06e-04 | 8.71e-03 | 70 |
| GO:0006520 | Colorectum | AD | cellular amino acid metabolic process | 81/3918 | 284/18723 | 1.37e-03 | 1.19e-02 | 81 |
| GO:0009081 | Colorectum | AD | branched-chain amino acid metabolic process | 10/3918 | 19/18723 | 2.25e-03 | 1.77e-02 | 10 |
| GO:00090831 | Colorectum | MSS | branched-chain amino acid catabolic process | 10/3467 | 15/18723 | 5.64e-05 | 9.87e-04 | 10 |
| GO:00090811 | Colorectum | MSS | branched-chain amino acid metabolic process | 10/3467 | 19/18723 | 8.39e-04 | 8.68e-03 | 10 |
| GO:00442822 | Colorectum | MSS | small molecule catabolic process | 94/3467 | 376/18723 | 9.85e-04 | 9.86e-03 | 94 |
| GO:00160542 | Colorectum | MSS | organic acid catabolic process | 61/3467 | 240/18723 | 4.72e-03 | 3.31e-02 | 61 |
| GO:00442823 | Colorectum | FAP | small molecule catabolic process | 77/2622 | 376/18723 | 3.25e-04 | 4.16e-03 | 77 |
| GO:00160543 | Colorectum | FAP | organic acid catabolic process | 50/2622 | 240/18723 | 2.30e-03 | 1.85e-02 | 50 |
| GO:00090832 | Colorectum | FAP | branched-chain amino acid catabolic process | 7/2622 | 15/18723 | 2.40e-03 | 1.90e-02 | 7 |
| GO:00463951 | Colorectum | FAP | carboxylic acid catabolic process | 48/2622 | 236/18723 | 4.53e-03 | 3.08e-02 | 48 |
| GO:00090833 | Colorectum | CRC | branched-chain amino acid catabolic process | 6/2078 | 15/18723 | 3.82e-03 | 3.19e-02 | 6 |
| GO:004603416 | Endometrium | AEH | ATP metabolic process | 106/2100 | 277/18723 | 4.13e-32 | 1.24e-28 | 106 |
| GO:009719316 | Endometrium | AEH | intrinsic apoptotic signaling pathway | 75/2100 | 288/18723 | 1.46e-12 | 2.83e-10 | 75 |
| GO:200123316 | Endometrium | AEH | regulation of apoptotic signaling pathway | 86/2100 | 356/18723 | 2.97e-12 | 4.95e-10 | 86 |
| GO:000683910 | Endometrium | AEH | mitochondrial transport | 66/2100 | 254/18723 | 3.55e-11 | 4.96e-09 | 66 |
| GO:004578516 | Endometrium | AEH | positive regulation of cell adhesion | 96/2100 | 437/18723 | 5.50e-11 | 7.18e-09 | 96 |
| Pathway ID | Tissue | Disease Stage | Description | Gene Ratio | Bg Ratio | pvalue | p.adjust | qvalue | Count |
| hsa015243 | Liver | HCC | Platinum drug resistance | 52/4020 | 73/8465 | 3.14e-05 | 1.88e-04 | 1.04e-04 | 52 |
| hsa051653 | Liver | HCC | Human papillomavirus infection | 188/4020 | 331/8465 | 3.34e-04 | 1.49e-03 | 8.29e-04 | 188 |
| hsa0517012 | Liver | HCC | Human immunodeficiency virus 1 infection | 125/4020 | 212/8465 | 4.51e-04 | 1.94e-03 | 1.08e-03 | 125 |
| hsa0472211 | Liver | HCC | Neurotrophin signaling pathway | 74/4020 | 119/8465 | 8.27e-04 | 3.26e-03 | 1.81e-03 | 74 |
| hsa0491913 | Liver | HCC | Thyroid hormone signaling pathway | 75/4020 | 121/8465 | 8.76e-04 | 3.38e-03 | 1.88e-03 | 75 |
| hsa0514531 | Liver | HCC | Toxoplasmosis | 70/4020 | 112/8465 | 9.25e-04 | 3.52e-03 | 1.96e-03 | 70 |
| hsa042103 | Liver | HCC | Apoptosis | 83/4020 | 136/8465 | 9.51e-04 | 3.58e-03 | 1.99e-03 | 83 |
| hsa0516031 | Liver | HCC | Hepatitis C | 94/4020 | 157/8465 | 1.11e-03 | 4.10e-03 | 2.28e-03 | 94 |
| hsa0401211 | Liver | HCC | ErbB signaling pathway | 54/4020 | 85/8465 | 2.02e-03 | 7.07e-03 | 3.93e-03 | 54 |
| hsa052033 | Liver | HCC | Viral carcinogenesis | 117/4020 | 204/8465 | 2.68e-03 | 8.98e-03 | 5.00e-03 | 117 |
| hsa0522311 | Liver | HCC | Non-small cell lung cancer | 46/4020 | 72/8465 | 3.61e-03 | 1.12e-02 | 6.22e-03 | 46 |
| hsa0152131 | Liver | HCC | EGFR tyrosine kinase inhibitor resistance | 48/4020 | 79/8465 | 1.19e-02 | 2.99e-02 | 1.66e-02 | 48 |
| hsa015221 | Liver | HCC | Endocrine resistance | 58/4020 | 98/8465 | 1.28e-02 | 3.19e-02 | 1.78e-02 | 58 |
| hsa0516111 | Liver | HCC | Hepatitis B | 91/4020 | 162/8465 | 1.56e-02 | 3.76e-02 | 2.09e-02 | 91 |
| hsa052211 | Liver | HCC | Acute myeloid leukemia | 41/4020 | 67/8465 | 1.64e-02 | 3.90e-02 | 2.17e-02 | 41 |
| hsa0541752 | Liver | HCC | Lipid and atherosclerosis | 118/4020 | 215/8465 | 1.66e-02 | 3.92e-02 | 2.18e-02 | 118 |
| hsa0501428 | Oral cavity | OSCC | Amyotrophic lateral sclerosis | 246/3704 | 364/8465 | 6.65e-21 | 1.11e-18 | 5.67e-19 | 246 |
| hsa0501028 | Oral cavity | OSCC | Alzheimer disease | 244/3704 | 384/8465 | 1.18e-15 | 3.60e-14 | 1.83e-14 | 244 |
| hsa0502228 | Oral cavity | OSCC | Pathways of neurodegeneration - multiple diseases | 292/3704 | 476/8465 | 1.60e-15 | 4.47e-14 | 2.28e-14 | 292 |
| hsa0502028 | Oral cavity | OSCC | Prion disease | 181/3704 | 273/8465 | 2.05e-14 | 5.30e-13 | 2.70e-13 | 181 |
| TF | Cell Type | Tissue | Disease Stage | Target Gene | RSS | Regulon Activity |
| BAD | MYOFIB | Esophagus | ADJ | FIBCD1,SLC22A23,S100A3, etc. | 0.00e+00 |  |
| BAD | INCAF | Esophagus | ADJ | FIBCD1,SLC22A23,S100A3, etc. | 0.00e+00 | |
| BAD | SMC | Esophagus | ESCC | FIBCD1,SLC22A23,S100A3, etc. | 5.49e-03 |  |
| BAD | FIB | Esophagus | ESCC | FIBCD1,SLC22A23,S100A3, etc. | 0.00e+00 | |
| Hugo Symbol | Variant Class | Variant Classification | dbSNP RS | HGVSc | HGVSp | HGVSp Short | SWISSPROT | BIOTYPE | SIFT | PolyPhen | Tumor Sample Barcode | Tissue | Histology | Sex | Age | Stage | Therapy Types | Drugs | Outcome |
| BAD | SNV | Missense_Mutation | | c.351G>A | p.Met117Ile | p.M117I | Q92934 | protein_coding | deleterious(0) | probably_damaging(0.966) | TCGA-AC-A23H-01 | Breast | breast invasive carcinoma | Female | >=65 | I/II | Unknown | Unknown | PD |
| BAD | SNV | Missense_Mutation | | c.293N>A | p.Arg98His | p.R98H | Q92934 | protein_coding | deleterious(0.03) | possibly_damaging(0.688) | TCGA-EK-A2RK-01 | Cervix | cervical & endocervical cancer | Female | >=65 | I/II | Unknown | Unknown | SD |
| BAD | SNV | Missense_Mutation | | c.57G>C | p.Glu19Asp | p.E19D | Q92934 | protein_coding | tolerated_low_confidence(1) | benign(0.001) | TCGA-4N-A93T-01 | Colorectum | colon adenocarcinoma | Male | >=65 | III/IV | Chemotherapy | xeloda | SD |
| BAD | SNV | Missense_Mutation | rs775688969 | c.74N>A | p.Ser25Asn | p.S25N | Q92934 | protein_coding | tolerated(0.13) | benign(0.409) | TCGA-AA-A010-01 | Colorectum | colon adenocarcinoma | Female | <65 | I/II | Chemotherapy | folinic | CR |
| BAD | SNV | Missense_Mutation | novel | c.212G>T | p.Ser71Ile | p.S71I | Q92934 | protein_coding | deleterious(0.01) | possibly_damaging(0.857) | TCGA-AJ-A5DW-01 | Endometrium | uterine corpus endometrioid carcinoma | Female | <65 | I/II | Unknown | Unknown | SD |
| BAD | SNV | Missense_Mutation | novel | c.401N>T | p.Ser134Ile | p.S134I | Q92934 | protein_coding | deleterious(0) | probably_damaging(0.998) | TCGA-AX-A1CE-01 | Endometrium | uterine corpus endometrioid carcinoma | Female | <65 | I/II | Unspecific | Paclitaxel | SD |
| BAD | SNV | Missense_Mutation | novel | c.485N>A | p.Gly162Glu | p.G162E | Q92934 | protein_coding | deleterious_low_confidence(0) | probably_damaging(1) | TCGA-AX-A2HC-01 | Endometrium | uterine corpus endometrioid carcinoma | Female | <65 | III/IV | Chemotherapy | paclitaxel | PD |
| BAD | SNV | Missense_Mutation | | c.298N>A | p.Ala100Thr | p.A100T | Q92934 | protein_coding | deleterious(0) | probably_damaging(0.999) | TCGA-D1-A17R-01 | Endometrium | uterine corpus endometrioid carcinoma | Female | <65 | I/II | Unknown | Unknown | SD |
| BAD | SNV | Missense_Mutation | | c.128G>A | p.Gly43Asp | p.G43D | Q92934 | protein_coding | tolerated(0.08) | probably_damaging(1) | TCGA-FI-A2D5-01 | Endometrium | uterine corpus endometrioid carcinoma | Female | <65 | III/IV | Chemotherapy | carboplatinum | PD |
| BAD | SNV | Missense_Mutation | | c.483N>T | p.Arg161Ser | p.R161S | Q92934 | protein_coding | deleterious_low_confidence(0) | benign(0.272) | TCGA-CH-5739-01 | Prostate | prostate adenocarcinoma | Male | >=65 | 7 | Unknown | Unknown | SD |


