
|
|||||
|
 | |
| |
| |
| |
| |
| |
|
Gene: MAP2K2 |
Gene summary for MAP2K2 |
| Gene information | Species | Human | Gene symbol | MAP2K2 | Gene ID | 5605 |
| Gene name | mitogen-activated protein kinase kinase 2 | |
| Gene Alias | CFC4 | |
| Cytomap | 19p13.3 | |
| Gene Type | protein-coding | GO ID | GO:0000165 | UniProtAcc | P36507 |
Top |
Malignant transformation analysis |
| Identification of the aberrant gene expression in precancerous and cancerous lesions by comparing the gene expression of stem-like cells in diseased tissues with normal stem cells |
| Entrez ID | Symbol | Replicates | Species | Organ | Tissue | Adj P-value | Log2FC | Malignancy |
| 5605 | MAP2K2 | HTA11_3410_2000001011 | Human | Colorectum | AD | 3.03e-04 | 2.29e-01 | 0.0155 |
| 5605 | MAP2K2 | HTA11_2487_2000001011 | Human | Colorectum | SER | 3.12e-21 | 8.82e-01 | -0.1808 |
| 5605 | MAP2K2 | HTA11_1938_2000001011 | Human | Colorectum | AD | 4.45e-05 | 4.84e-01 | -0.0811 |
| 5605 | MAP2K2 | HTA11_78_2000001011 | Human | Colorectum | AD | 1.04e-04 | 3.86e-01 | -0.1088 |
| 5605 | MAP2K2 | HTA11_347_2000001011 | Human | Colorectum | AD | 6.87e-32 | 8.00e-01 | -0.1954 |
| 5605 | MAP2K2 | HTA11_411_2000001011 | Human | Colorectum | SER | 3.45e-05 | 1.07e+00 | -0.2602 |
| 5605 | MAP2K2 | HTA11_2112_2000001011 | Human | Colorectum | SER | 7.42e-13 | 1.46e+00 | -0.2196 |
| 5605 | MAP2K2 | HTA11_3361_2000001011 | Human | Colorectum | AD | 4.67e-14 | 6.42e-01 | -0.1207 |
| 5605 | MAP2K2 | HTA11_83_2000001011 | Human | Colorectum | SER | 3.17e-11 | 6.69e-01 | -0.1526 |
| 5605 | MAP2K2 | HTA11_696_2000001011 | Human | Colorectum | AD | 1.02e-29 | 8.46e-01 | -0.1464 |
| 5605 | MAP2K2 | HTA11_866_2000001011 | Human | Colorectum | AD | 2.31e-17 | 5.55e-01 | -0.1001 |
| 5605 | MAP2K2 | HTA11_1391_2000001011 | Human | Colorectum | AD | 3.59e-26 | 8.74e-01 | -0.059 |
| 5605 | MAP2K2 | HTA11_2992_2000001011 | Human | Colorectum | SER | 6.22e-13 | 1.06e+00 | -0.1706 |
| 5605 | MAP2K2 | HTA11_5212_2000001011 | Human | Colorectum | AD | 2.80e-06 | 6.69e-01 | -0.2061 |
| 5605 | MAP2K2 | HTA11_5216_2000001011 | Human | Colorectum | SER | 1.04e-02 | 6.15e-01 | -0.1462 |
| 5605 | MAP2K2 | HTA11_546_2000001011 | Human | Colorectum | AD | 6.60e-06 | 5.55e-01 | -0.0842 |
| 5605 | MAP2K2 | HTA11_866_3004761011 | Human | Colorectum | AD | 4.05e-03 | 2.52e-01 | 0.096 |
| 5605 | MAP2K2 | HTA11_4255_2000001011 | Human | Colorectum | SER | 1.31e-02 | 4.92e-01 | 0.0446 |
| 5605 | MAP2K2 | HTA11_8622_2000001021 | Human | Colorectum | SER | 2.07e-04 | 4.43e-01 | 0.0528 |
| 5605 | MAP2K2 | HTA11_10623_2000001011 | Human | Colorectum | AD | 3.75e-02 | 4.96e-01 | -0.0177 |
| Page: 1 2 3 4 5 6 7 8 9 |
| Tissue | Expression Dynamics | Abbreviation |
| Colorectum (GSE201348) |  | FAP: Familial adenomatous polyposis |
| CRC: Colorectal cancer | ||
| Colorectum (HTA11) |  | AD: Adenomas |
| SER: Sessile serrated lesions | ||
| MSI-H: Microsatellite-high colorectal cancer | ||
| MSS: Microsatellite stable colorectal cancer | ||
| Esophagus |  | ESCC: Esophageal squamous cell carcinoma |
| HGIN: High-grade intraepithelial neoplasias | ||
| LGIN: Low-grade intraepithelial neoplasias | ||
| GC | 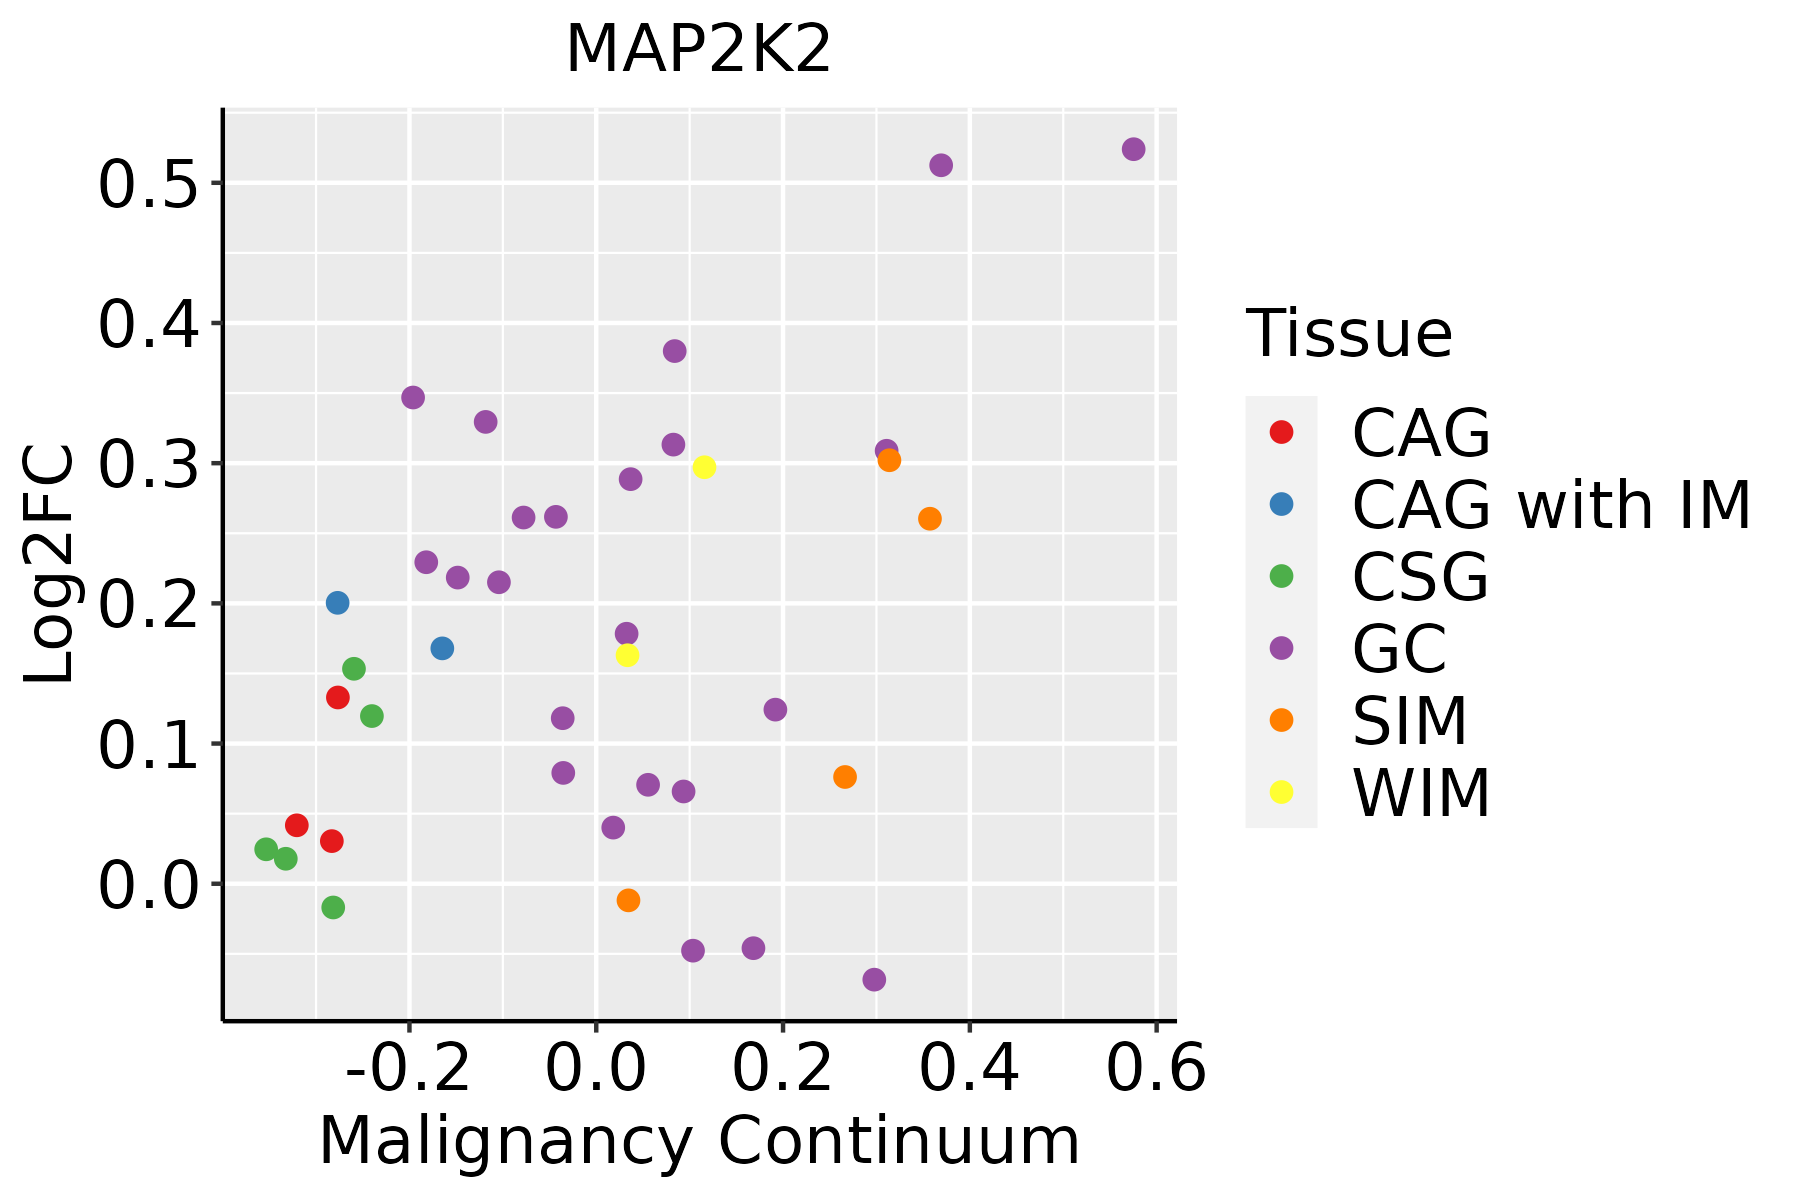 | CAG: Chronic atrophic gastritis |
| CAG with IM: Chronic atrophic gastritis with intestinal metaplasia | ||
| CSG: Chronic superficial gastritis | ||
| GC: Gastric cancer | ||
| SIM: Severe intestinal metaplasia | ||
| WIM: Wild intestinal metaplasia | ||
| Liver | 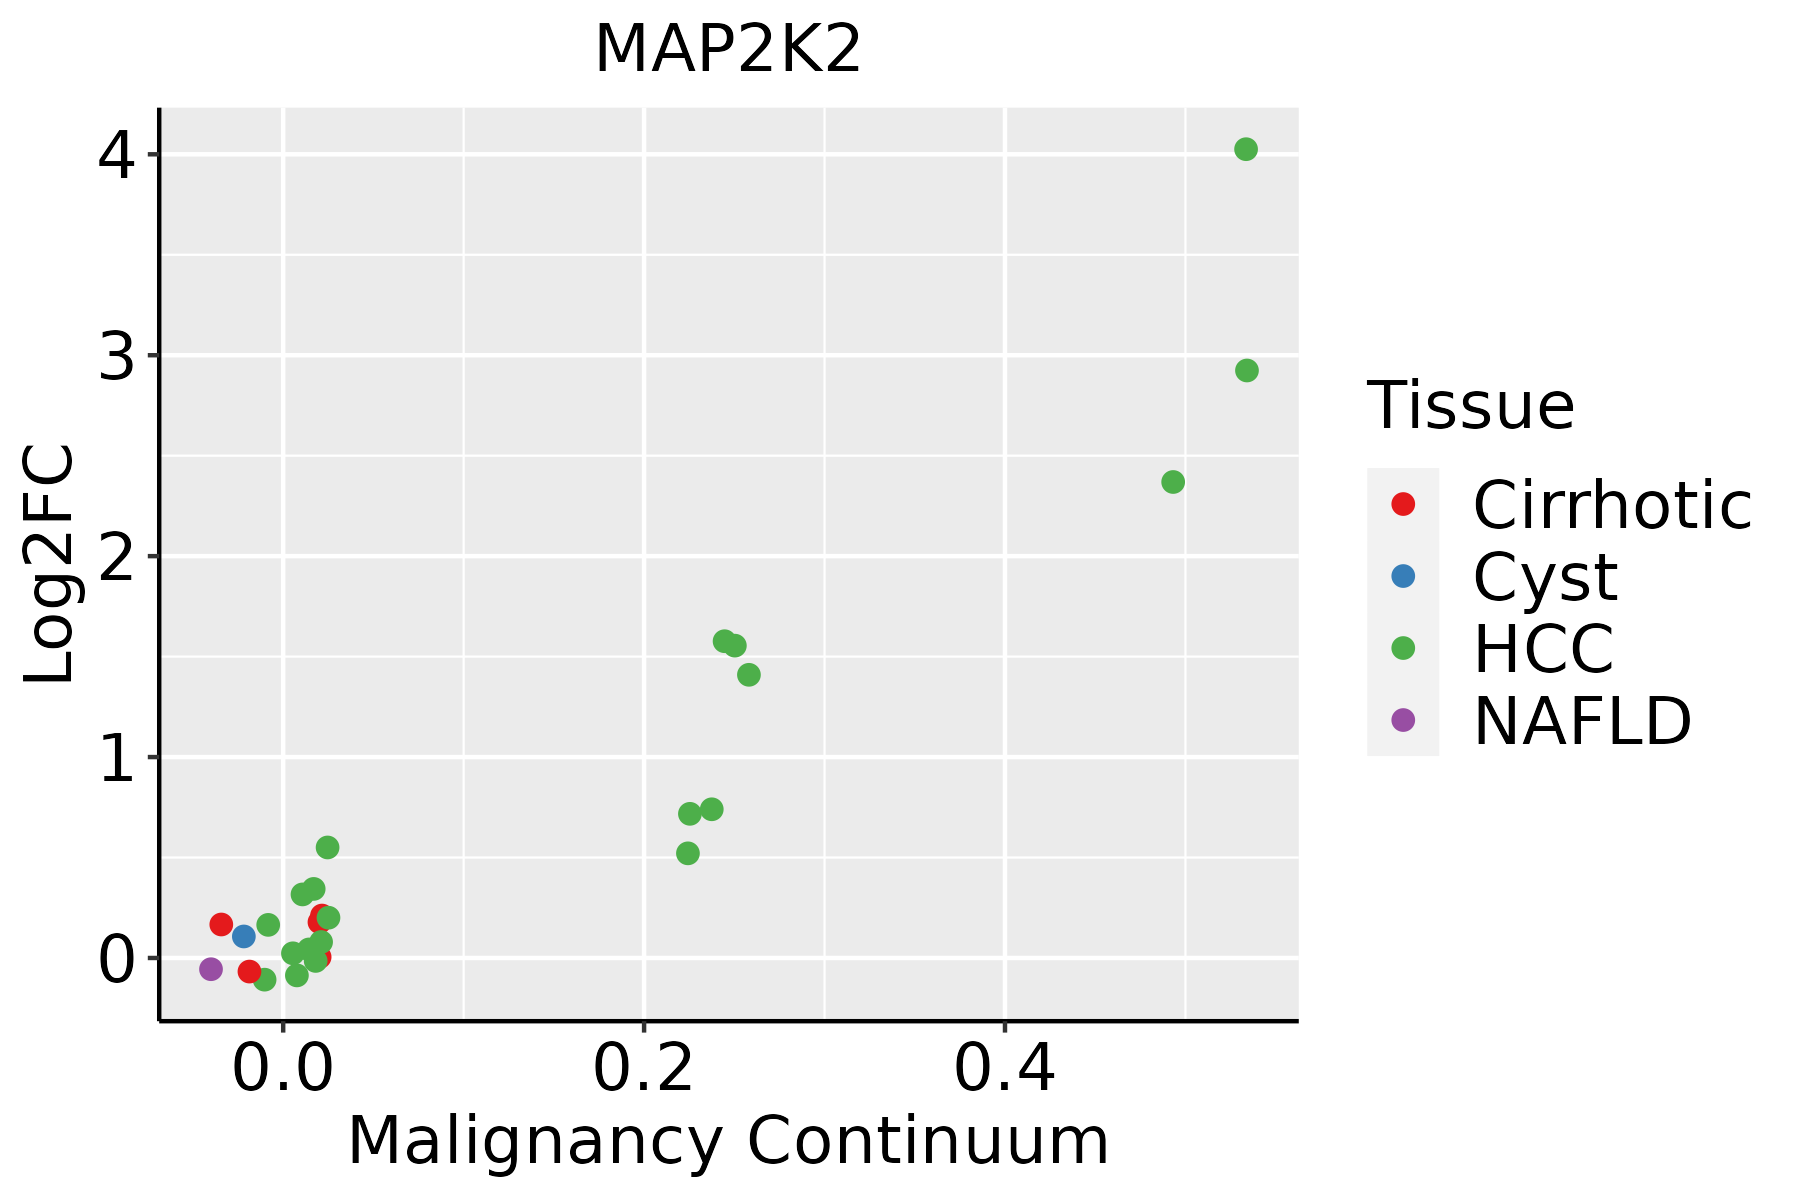 | HCC: Hepatocellular carcinoma |
| NAFLD: Non-alcoholic fatty liver disease | ||
| Oral Cavity | 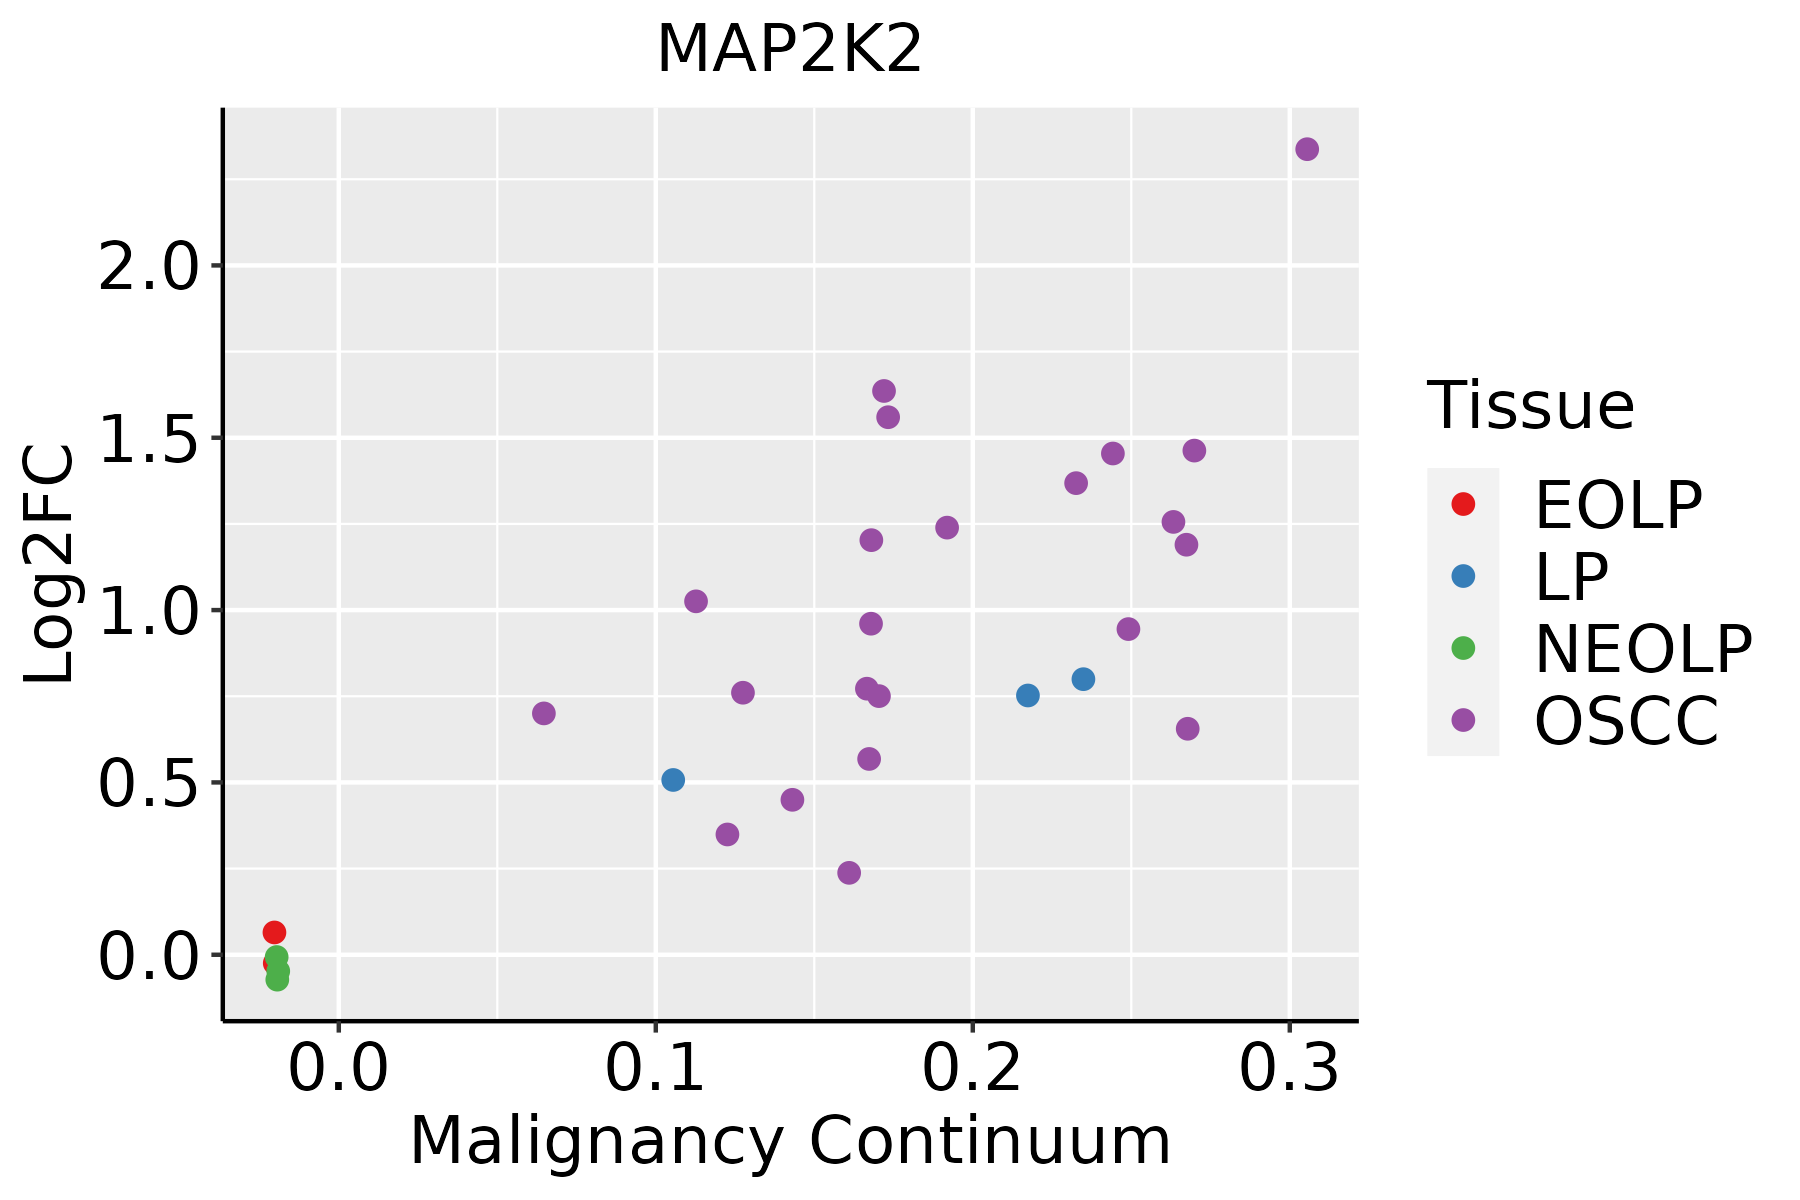 | EOLP: Erosive Oral lichen planus |
| LP: leukoplakia | ||
| NEOLP: Non-erosive oral lichen planus | ||
| OSCC: Oral squamous cell carcinoma | ||
| Skin |  | AK: Actinic keratosis |
| cSCC: Cutaneous squamous cell carcinoma | ||
| SCCIS:squamous cell carcinoma in situ | ||
| Thyroid | 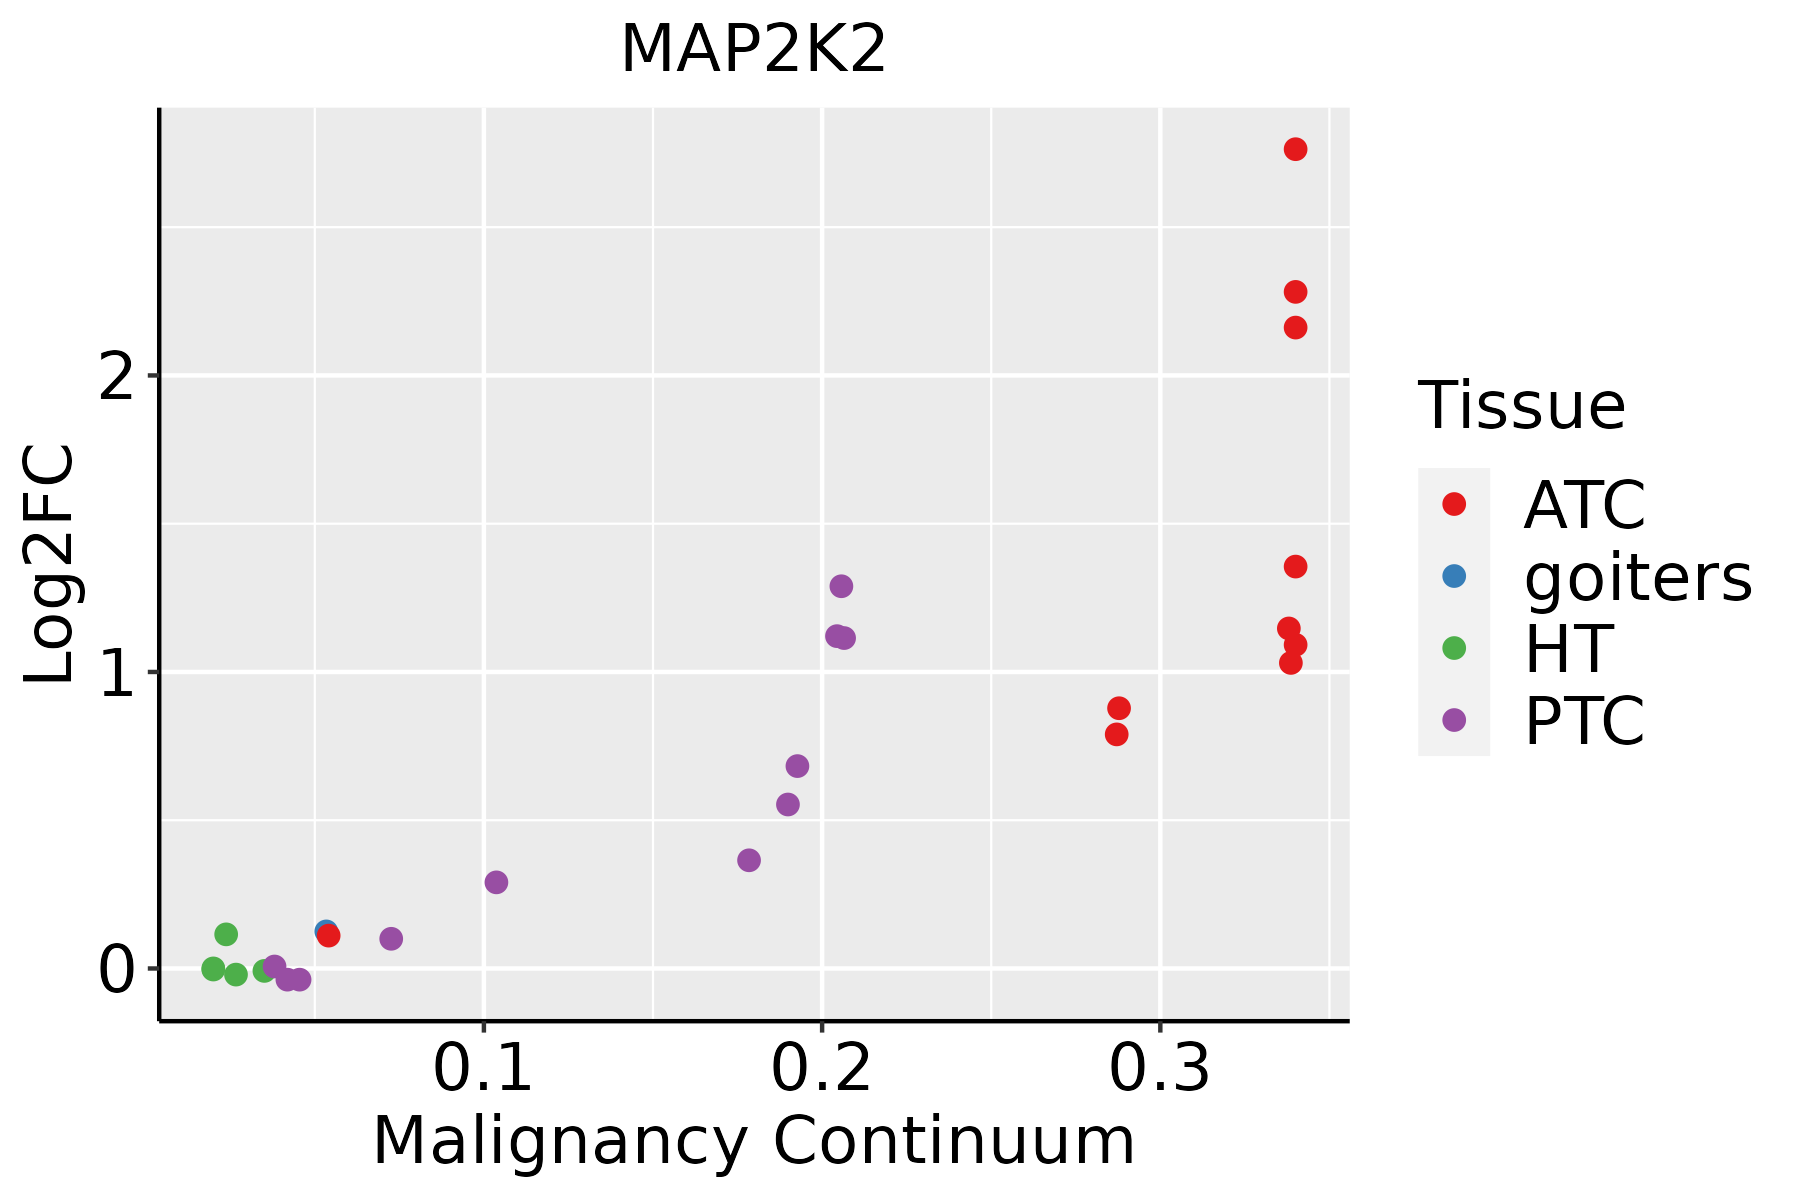 | ATC: Anaplastic thyroid cancer |
| HT: Hashimoto's thyroiditis | ||
| PTC: Papillary thyroid cancer |
| ∗log2FC in expression of this searched gene in stem-like cells from each diseased tissue sample relative to stem-like cells in normal samples in each tissue plotted against the malignancy continuum. Samples are colored based on if they are from different disease stage. |
Top |
Malignant transformation related pathway analysis |
| Find out the enriched GO biological processes and KEGG pathways involved in transition from healthy to precancer to cancer |
| Tissue | Disease Stage | Enriched GO biological Processes |
| Colorectum | AD |  |
| Colorectum | SER |  |
| Colorectum | MSS |  |
| Colorectum | MSI-H |  |
| Colorectum | FAP |  |
| ∗Top 15 enriched GO BP terms are showed in the bar plot of each disease state in each tissue. Each row represents a significant GO biological process which is colored according to the -log10(p.adjust). |
| Page: 1 2 3 4 5 6 7 8 9 |
| GO ID | Tissue | Disease Stage | Description | Gene Ratio | Bg Ratio | pvalue | p.adjust | Count |
| GO:0016482 | Colorectum | AD | cytosolic transport | 68/3918 | 168/18723 | 6.00e-09 | 3.72e-07 | 68 |
| GO:0032386 | Colorectum | AD | regulation of intracellular transport | 109/3918 | 337/18723 | 5.33e-07 | 1.95e-05 | 109 |
| GO:0046777 | Colorectum | AD | protein autophosphorylation | 74/3918 | 227/18723 | 2.48e-05 | 4.76e-04 | 74 |
| GO:0033674 | Colorectum | AD | positive regulation of kinase activity | 131/3918 | 467/18723 | 1.28e-04 | 1.85e-03 | 131 |
| GO:0051403 | Colorectum | AD | stress-activated MAPK cascade | 72/3918 | 239/18723 | 4.77e-04 | 5.25e-03 | 72 |
| GO:0031098 | Colorectum | AD | stress-activated protein kinase signaling cascade | 74/3918 | 247/18723 | 4.80e-04 | 5.27e-03 | 74 |
| GO:0098927 | Colorectum | AD | vesicle-mediated transport between endosomal compartments | 19/3918 | 43/18723 | 5.03e-04 | 5.43e-03 | 19 |
| GO:0045860 | Colorectum | AD | positive regulation of protein kinase activity | 107/3918 | 386/18723 | 8.01e-04 | 7.92e-03 | 107 |
| GO:0045022 | Colorectum | AD | early endosome to late endosome transport | 17/3918 | 40/18723 | 1.66e-03 | 1.38e-02 | 17 |
| GO:0018105 | Colorectum | AD | peptidyl-serine phosphorylation | 88/3918 | 315/18723 | 1.73e-03 | 1.43e-02 | 88 |
| GO:0071900 | Colorectum | AD | regulation of protein serine/threonine kinase activity | 98/3918 | 359/18723 | 2.18e-03 | 1.73e-02 | 98 |
| GO:0070302 | Colorectum | AD | regulation of stress-activated protein kinase signaling cascade | 58/3918 | 195/18723 | 2.21e-03 | 1.74e-02 | 58 |
| GO:1903649 | Colorectum | AD | regulation of cytoplasmic transport | 13/3918 | 28/18723 | 2.22e-03 | 1.75e-02 | 13 |
| GO:0032872 | Colorectum | AD | regulation of stress-activated MAPK cascade | 57/3918 | 192/18723 | 2.51e-03 | 1.92e-02 | 57 |
| GO:0035196 | Colorectum | AD | production of miRNAs involved in gene silencing by miRNA | 20/3918 | 52/18723 | 2.87e-03 | 2.14e-02 | 20 |
| GO:0018209 | Colorectum | AD | peptidyl-serine modification | 92/3918 | 338/18723 | 3.19e-03 | 2.36e-02 | 92 |
| GO:0071902 | Colorectum | AD | positive regulation of protein serine/threonine kinase activity | 58/3918 | 200/18723 | 4.09e-03 | 2.84e-02 | 58 |
| GO:0031050 | Colorectum | AD | dsRNA processing | 20/3918 | 54/18723 | 4.76e-03 | 3.22e-02 | 20 |
| GO:0070918 | Colorectum | AD | production of small RNA involved in gene silencing by RNA | 20/3918 | 54/18723 | 4.76e-03 | 3.22e-02 | 20 |
| GO:0060147 | Colorectum | AD | regulation of posttranscriptional gene silencing | 19/3918 | 52/18723 | 6.92e-03 | 4.26e-02 | 19 |
| Page: 1 2 3 4 5 6 7 8 9 10 11 12 13 14 15 16 17 |
| Pathway ID | Tissue | Disease Stage | Description | Gene Ratio | Bg Ratio | pvalue | p.adjust | qvalue | Count |
| hsa0521628 | Esophagus | ESCC | Thyroid cancer | 32/4205 | 37/8465 | 2.98e-06 | 1.72e-05 | 8.81e-06 | 32 |
| hsa0407116 | Esophagus | ESCC | Sphingolipid signaling pathway | 85/4205 | 121/8465 | 3.04e-06 | 1.73e-05 | 8.84e-06 | 85 |
| hsa051619 | Esophagus | ESCC | Hepatitis B | 108/4205 | 162/8465 | 7.68e-06 | 4.15e-05 | 2.12e-05 | 108 |
| hsa0521320 | Esophagus | ESCC | Endometrial cancer | 45/4205 | 58/8465 | 1.14e-05 | 5.98e-05 | 3.06e-05 | 45 |
| hsa040689 | Esophagus | ESCC | FoxO signaling pathway | 89/4205 | 131/8465 | 1.56e-05 | 7.98e-05 | 4.09e-05 | 89 |
| hsa0521118 | Esophagus | ESCC | Renal cell carcinoma | 51/4205 | 69/8465 | 3.29e-05 | 1.53e-04 | 7.83e-05 | 51 |
| hsa0406629 | Esophagus | ESCC | HIF-1 signaling pathway | 75/4205 | 109/8465 | 3.66e-05 | 1.68e-04 | 8.60e-05 | 75 |
| hsa0522518 | Esophagus | ESCC | Hepatocellular carcinoma | 109/4205 | 168/8465 | 4.27e-05 | 1.88e-04 | 9.64e-05 | 109 |
| hsa0472225 | Esophagus | ESCC | Neurotrophin signaling pathway | 80/4205 | 119/8465 | 7.33e-05 | 3.07e-04 | 1.57e-04 | 80 |
| hsa052215 | Esophagus | ESCC | Acute myeloid leukemia | 49/4205 | 67/8465 | 7.43e-05 | 3.07e-04 | 1.57e-04 | 49 |
| hsa0523018 | Esophagus | ESCC | Central carbon metabolism in cancer | 50/4205 | 70/8465 | 1.70e-04 | 6.62e-04 | 3.39e-04 | 50 |
| hsa049109 | Esophagus | ESCC | Insulin signaling pathway | 89/4205 | 137/8465 | 1.97e-04 | 7.32e-04 | 3.75e-04 | 89 |
| hsa0152110 | Esophagus | ESCC | EGFR tyrosine kinase inhibitor resistance | 55/4205 | 79/8465 | 2.44e-04 | 8.78e-04 | 4.50e-04 | 55 |
| hsa0521417 | Esophagus | ESCC | Glioma | 52/4205 | 75/8465 | 4.20e-04 | 1.45e-03 | 7.43e-04 | 52 |
| hsa041505 | Esophagus | ESCC | mTOR signaling pathway | 98/4205 | 156/8465 | 5.81e-04 | 1.95e-03 | 9.97e-04 | 98 |
| hsa0491928 | Esophagus | ESCC | Thyroid hormone signaling pathway | 78/4205 | 121/8465 | 6.79e-04 | 2.23e-03 | 1.14e-03 | 78 |
| hsa049268 | Esophagus | ESCC | Relaxin signaling pathway | 81/4205 | 129/8465 | 1.72e-03 | 5.09e-03 | 2.61e-03 | 81 |
| hsa0401218 | Esophagus | ESCC | ErbB signaling pathway | 56/4205 | 85/8465 | 1.78e-03 | 5.24e-03 | 2.68e-03 | 56 |
| hsa052356 | Esophagus | ESCC | PD-L1 expression and PD-1 checkpoint pathway in cancer | 58/4205 | 89/8465 | 2.19e-03 | 6.16e-03 | 3.16e-03 | 58 |
| hsa015227 | Esophagus | ESCC | Endocrine resistance | 63/4205 | 98/8465 | 2.38e-03 | 6.58e-03 | 3.37e-03 | 63 |
| Page: 1 2 3 4 5 6 7 8 9 10 11 12 13 14 15 16 17 18 19 20 21 22 23 24 25 26 27 28 29 30 31 32 33 34 |
Top |
Cell-cell communication analysis |
| Identification of potential cell-cell interactions between two cell types and their ligand-receptor pairs for different disease states |
| Ligand | Receptor | LRpair | Pathway | Tissue | Disease Stage |
| Page: 1 |
Top |
Single-cell gene regulatory network inference analysis |
| Find out the significant the regulons (TFs) and the target genes of each regulon across cell types for different disease states |
| TF | Cell Type | Tissue | Disease Stage | Target Gene | RSS | Regulon Activity |
| ∗The dot plots of a searched regulon are shown for all cell subpopulations in each disease state of each tissue based on the regulon specific score inferred using pySCENIC and by calculating the average expression. |
| Page: 1 |
Top |
Somatic mutation of malignant transformation related genes |
| Annotation of somatic variants for genes involved in malignant transformation |
| Hugo Symbol | Variant Class | Variant Classification | dbSNP RS | HGVSc | HGVSp | HGVSp Short | SWISSPROT | BIOTYPE | SIFT | PolyPhen | Tumor Sample Barcode | Tissue | Histology | Sex | Age | Stage | Therapy Types | Drugs | Outcome |
| MAP2K2 | SNV | Missense_Mutation | c.150N>C | p.Gln50His | p.Q50H | P36507 | protein_coding | deleterious(0) | probably_damaging(0.993) | TCGA-AC-A23H-01 | Breast | breast invasive carcinoma | Female | >=65 | I/II | Unknown | Unknown | PD | |
| MAP2K2 | SNV | Missense_Mutation | rs765755554 | c.247G>A | p.Gly83Ser | p.G83S | P36507 | protein_coding | deleterious(0.02) | probably_damaging(0.98) | TCGA-AO-A124-01 | Breast | breast invasive carcinoma | Female | <65 | I/II | Chemotherapy | doxorubicin | SD |
| MAP2K2 | SNV | Missense_Mutation | rs531584619 | c.884C>T | p.Ser295Leu | p.S295L | P36507 | protein_coding | tolerated(0.07) | benign(0.045) | TCGA-4T-AA8H-01 | Colorectum | colon adenocarcinoma | Female | <65 | I/II | Unknown | Unknown | SD |
| MAP2K2 | SNV | Missense_Mutation | rs761669626 | c.743N>T | p.Ser248Leu | p.S248L | P36507 | protein_coding | deleterious(0) | probably_damaging(0.967) | TCGA-AD-6889-01 | Colorectum | colon adenocarcinoma | Male | >=65 | I/II | Chemotherapy | xeloda | PD |
| MAP2K2 | SNV | Missense_Mutation | c.712N>T | p.Arg238Trp | p.R238W | P36507 | protein_coding | deleterious(0) | probably_damaging(1) | TCGA-AY-A69D-01 | Colorectum | colon adenocarcinoma | Female | <65 | I/II | Unknown | Unknown | SD | |
| MAP2K2 | SNV | Missense_Mutation | rs371852537 | c.196N>A | p.Glu66Lys | p.E66K | P36507 | protein_coding | deleterious(0.01) | probably_damaging(0.997) | TCGA-AZ-4315-01 | Colorectum | colon adenocarcinoma | Male | <65 | I/II | Unknown | Unknown | SD |
| MAP2K2 | SNV | Missense_Mutation | c.95N>A | p.Ala32Glu | p.A32E | P36507 | protein_coding | tolerated(0.22) | possibly_damaging(0.632) | TCGA-QG-A5Z2-01 | Colorectum | colon adenocarcinoma | Male | <65 | I/II | Unknown | Unknown | SD | |
| MAP2K2 | SNV | Missense_Mutation | c.311N>G | p.His104Arg | p.H104R | P36507 | protein_coding | tolerated(0.16) | benign(0.029) | TCGA-AG-A02N-01 | Colorectum | rectum adenocarcinoma | Male | >=65 | I/II | Chemotherapy | folinic | CR | |
| MAP2K2 | deletion | Frame_Shift_Del | c.903delN | p.Arg303AlafsTer24 | p.R303Afs*24 | P36507 | protein_coding | TCGA-G4-6628-01 | Colorectum | colon adenocarcinoma | Male | >=65 | I/II | Unknown | Unknown | SD | |||
| MAP2K2 | deletion | Frame_Shift_Del | c.903delN | p.Arg303AlafsTer24 | p.R303Afs*24 | P36507 | protein_coding | TCGA-WS-AB45-01 | Colorectum | colon adenocarcinoma | Female | <65 | I/II | Unknown | Unknown | SD |
| Page: 1 2 3 4 5 |
Top |
Related drugs of malignant transformation related genes |
| Identification of chemicals and drugs interact with genes involved in malignant transfromation |
| (DGIdb 4.0) |
| Entrez ID | Symbol | Category | Interaction Types | Drug Claim Name | Drug Name | PMIDs |
| 5605 | MAP2K2 | KINASE, DRUGGABLE GENOME, DRUG RESISTANCE, CLINICALLY ACTIONABLE, SERINE THREONINE KINASE, TYROSINE KINASE, ENZYME | inhibitor | CHEMBL2138601 | REFAMETINIB | |
| 5605 | MAP2K2 | KINASE, DRUGGABLE GENOME, DRUG RESISTANCE, CLINICALLY ACTIONABLE, SERINE THREONINE KINASE, TYROSINE KINASE, ENZYME | allosteric modulator | 223365961 | COBIMETINIB | |
| 5605 | MAP2K2 | KINASE, DRUGGABLE GENOME, DRUG RESISTANCE, CLINICALLY ACTIONABLE, SERINE THREONINE KINASE, TYROSINE KINASE, ENZYME | inhibitor | 178102630 | ||
| 5605 | MAP2K2 | KINASE, DRUGGABLE GENOME, DRUG RESISTANCE, CLINICALLY ACTIONABLE, SERINE THREONINE KINASE, TYROSINE KINASE, ENZYME | TOZASERTIB | TOZASERTIB | ||
| 5605 | MAP2K2 | KINASE, DRUGGABLE GENOME, DRUG RESISTANCE, CLINICALLY ACTIONABLE, SERINE THREONINE KINASE, TYROSINE KINASE, ENZYME | inhibitor | SELUMETINIB | SELUMETINIB | |
| 5605 | MAP2K2 | KINASE, DRUGGABLE GENOME, DRUG RESISTANCE, CLINICALLY ACTIONABLE, SERINE THREONINE KINASE, TYROSINE KINASE, ENZYME | inhibitor | CHEMBL3545243 | AS-703988 | |
| 5605 | MAP2K2 | KINASE, DRUGGABLE GENOME, DRUG RESISTANCE, CLINICALLY ACTIONABLE, SERINE THREONINE KINASE, TYROSINE KINASE, ENZYME | inhibitor | CHEMBL2146883 | COBIMETINIB | |
| 5605 | MAP2K2 | KINASE, DRUGGABLE GENOME, DRUG RESISTANCE, CLINICALLY ACTIONABLE, SERINE THREONINE KINASE, TYROSINE KINASE, ENZYME | DASATINIB | DASATINIB | ||
| 5605 | MAP2K2 | KINASE, DRUGGABLE GENOME, DRUG RESISTANCE, CLINICALLY ACTIONABLE, SERINE THREONINE KINASE, TYROSINE KINASE, ENZYME | inhibitor | CHEMBL3545081 | RG-7304 | |
| 5605 | MAP2K2 | KINASE, DRUGGABLE GENOME, DRUG RESISTANCE, CLINICALLY ACTIONABLE, SERINE THREONINE KINASE, TYROSINE KINASE, ENZYME | inhibitor | SELUMETINIB | SELUMETINIB |
| Page: 1 2 3 4 5 6 7 8 9 |

Copyright 2023-Present -The University of Texas Health Science Center at Houston |