
|
|||||
|
 | |
| |
| |
| |
| |
| |
|
Gene: HSP90B1 |
Gene summary for HSP90B1 |
| Gene information | Species | Human | Gene symbol | HSP90B1 | Gene ID | 7184 |
| Gene name | heat shock protein 90 beta family member 1 | |
| Gene Alias | ECGP | |
| Cytomap | 12q23.3 | |
| Gene Type | protein-coding | GO ID | GO:0001666 | UniProtAcc | P14625 |
Top |
Malignant transformation analysis |
| Identification of the aberrant gene expression in precancerous and cancerous lesions by comparing the gene expression of stem-like cells in diseased tissues with normal stem cells |
| Entrez ID | Symbol | Replicates | Species | Organ | Tissue | Adj P-value | Log2FC | Malignancy |
| 7184 | HSP90B1 | GSM4909280 | Human | Breast | Precancer | 2.83e-03 | -5.65e-01 | 0.0305 |
| 7184 | HSP90B1 | GSM4909281 | Human | Breast | IDC | 8.41e-24 | 5.64e-01 | 0.21 |
| 7184 | HSP90B1 | GSM4909285 | Human | Breast | IDC | 1.29e-02 | 2.96e-01 | 0.21 |
| 7184 | HSP90B1 | GSM4909286 | Human | Breast | IDC | 2.28e-03 | -1.37e-01 | 0.1081 |
| 7184 | HSP90B1 | GSM4909287 | Human | Breast | IDC | 8.09e-05 | 2.20e-01 | 0.2057 |
| 7184 | HSP90B1 | GSM4909288 | Human | Breast | IDC | 4.67e-02 | 1.12e-01 | 0.0988 |
| 7184 | HSP90B1 | GSM4909294 | Human | Breast | IDC | 1.95e-13 | -4.72e-01 | 0.2022 |
| 7184 | HSP90B1 | GSM4909295 | Human | Breast | IDC | 1.12e-02 | -3.46e-01 | 0.0898 |
| 7184 | HSP90B1 | GSM4909296 | Human | Breast | IDC | 3.69e-13 | -3.06e-01 | 0.1524 |
| 7184 | HSP90B1 | GSM4909297 | Human | Breast | IDC | 2.78e-24 | -2.69e-01 | 0.1517 |
| 7184 | HSP90B1 | GSM4909302 | Human | Breast | IDC | 4.23e-05 | -2.86e-01 | 0.1545 |
| 7184 | HSP90B1 | GSM4909307 | Human | Breast | IDC | 1.51e-08 | -3.55e-01 | 0.1569 |
| 7184 | HSP90B1 | GSM4909308 | Human | Breast | IDC | 2.72e-03 | -2.24e-01 | 0.158 |
| 7184 | HSP90B1 | GSM4909311 | Human | Breast | IDC | 1.73e-50 | -5.74e-01 | 0.1534 |
| 7184 | HSP90B1 | GSM4909312 | Human | Breast | IDC | 8.56e-17 | -3.15e-01 | 0.1552 |
| 7184 | HSP90B1 | GSM4909313 | Human | Breast | IDC | 1.55e-04 | -2.64e-01 | 0.0391 |
| 7184 | HSP90B1 | GSM4909315 | Human | Breast | IDC | 2.31e-10 | -3.80e-01 | 0.21 |
| 7184 | HSP90B1 | GSM4909316 | Human | Breast | IDC | 3.80e-05 | -4.68e-01 | 0.21 |
| 7184 | HSP90B1 | GSM4909317 | Human | Breast | IDC | 1.28e-08 | 4.33e-01 | 0.1355 |
| 7184 | HSP90B1 | GSM4909318 | Human | Breast | IDC | 6.63e-04 | -2.26e-01 | 0.2031 |
| Page: 1 2 3 4 5 6 7 8 9 10 11 12 13 14 15 16 17 |
| Tissue | Expression Dynamics | Abbreviation |
| Breast |  | IDC: Invasive ductal carcinoma |
| DCIS: Ductal carcinoma in situ | ||
| Precancer(BRCA1-mut): Precancerous lesion from BRCA1 mutation carriers | ||
| Cervix | 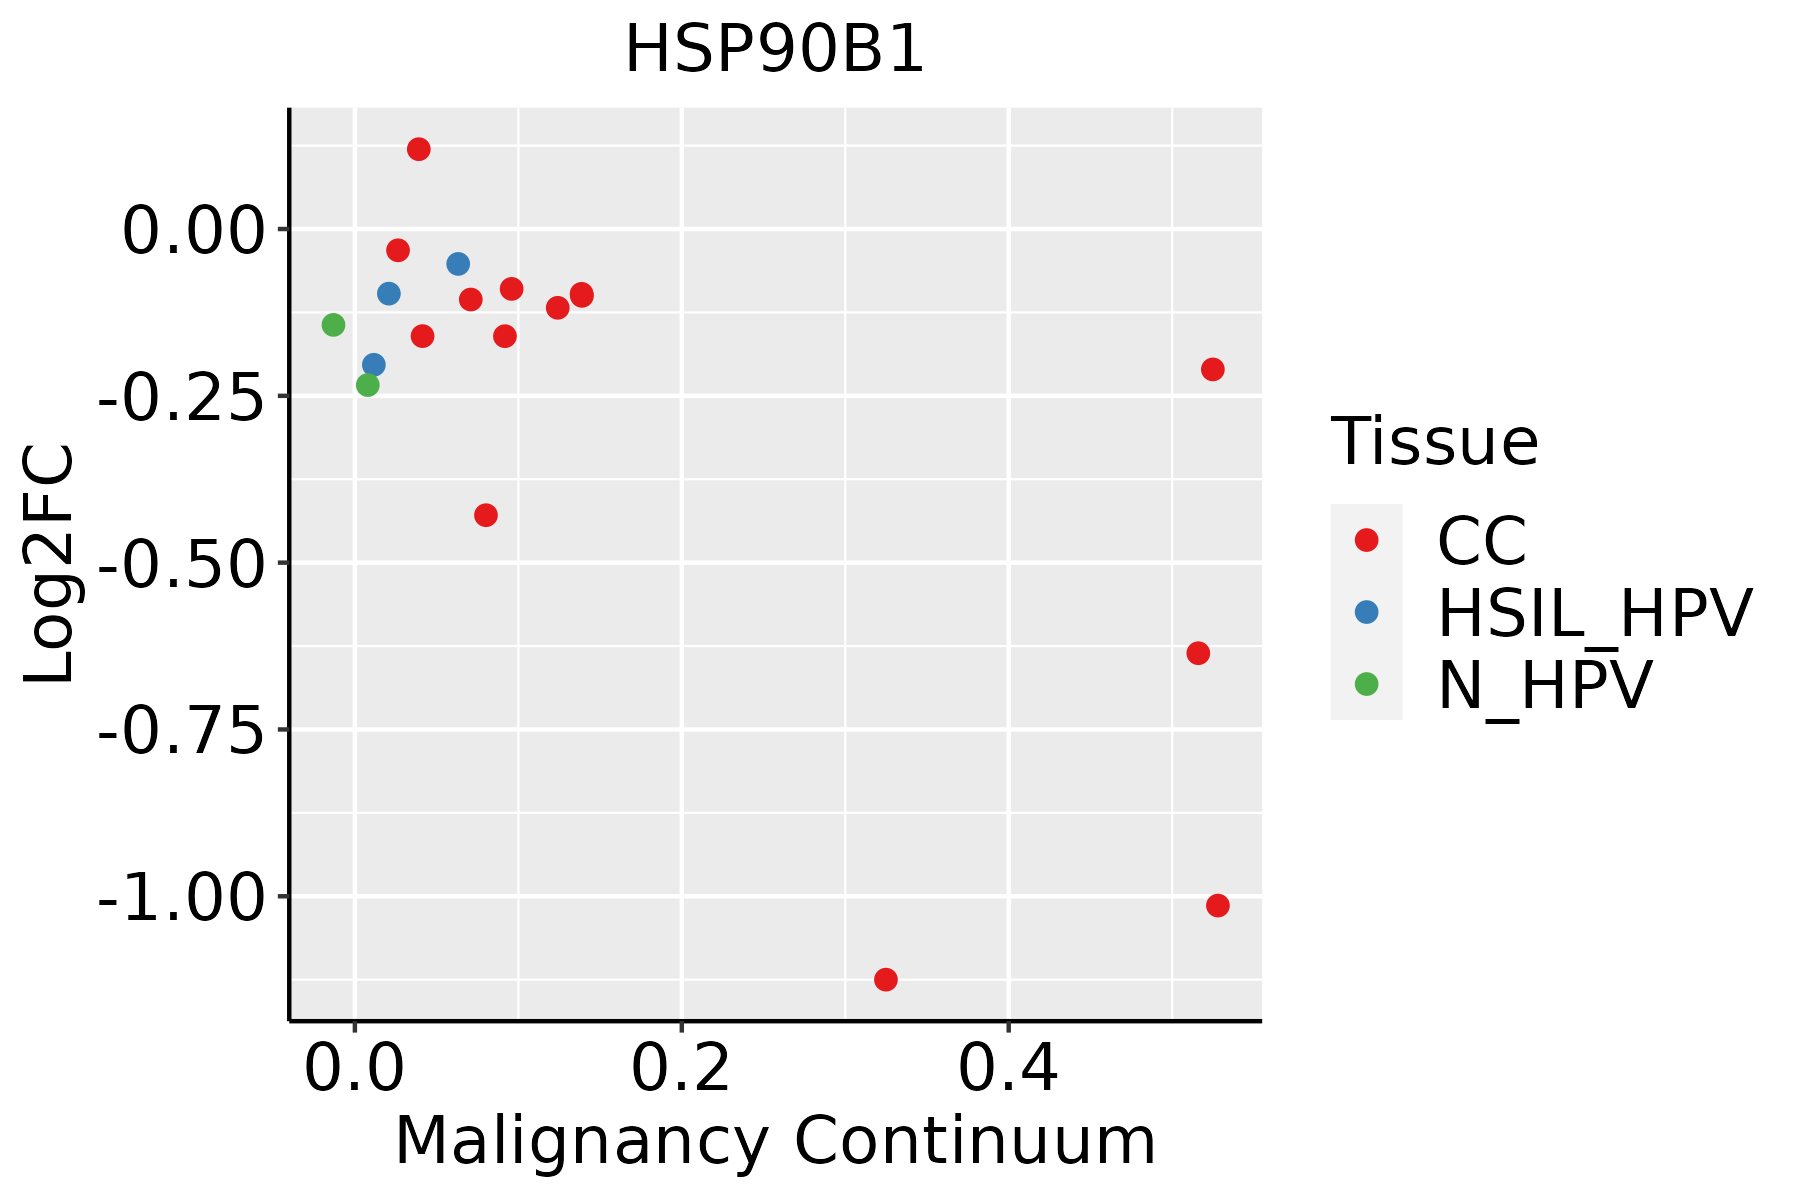 | CC: Cervix cancer |
| HSIL_HPV: HPV-infected high-grade squamous intraepithelial lesions | ||
| N_HPV: HPV-infected normal cervix | ||
| Colorectum (GSE201348) |  | FAP: Familial adenomatous polyposis |
| CRC: Colorectal cancer | ||
| Colorectum (HTA11) |  | AD: Adenomas |
| SER: Sessile serrated lesions | ||
| MSI-H: Microsatellite-high colorectal cancer | ||
| MSS: Microsatellite stable colorectal cancer | ||
| Endometrium | 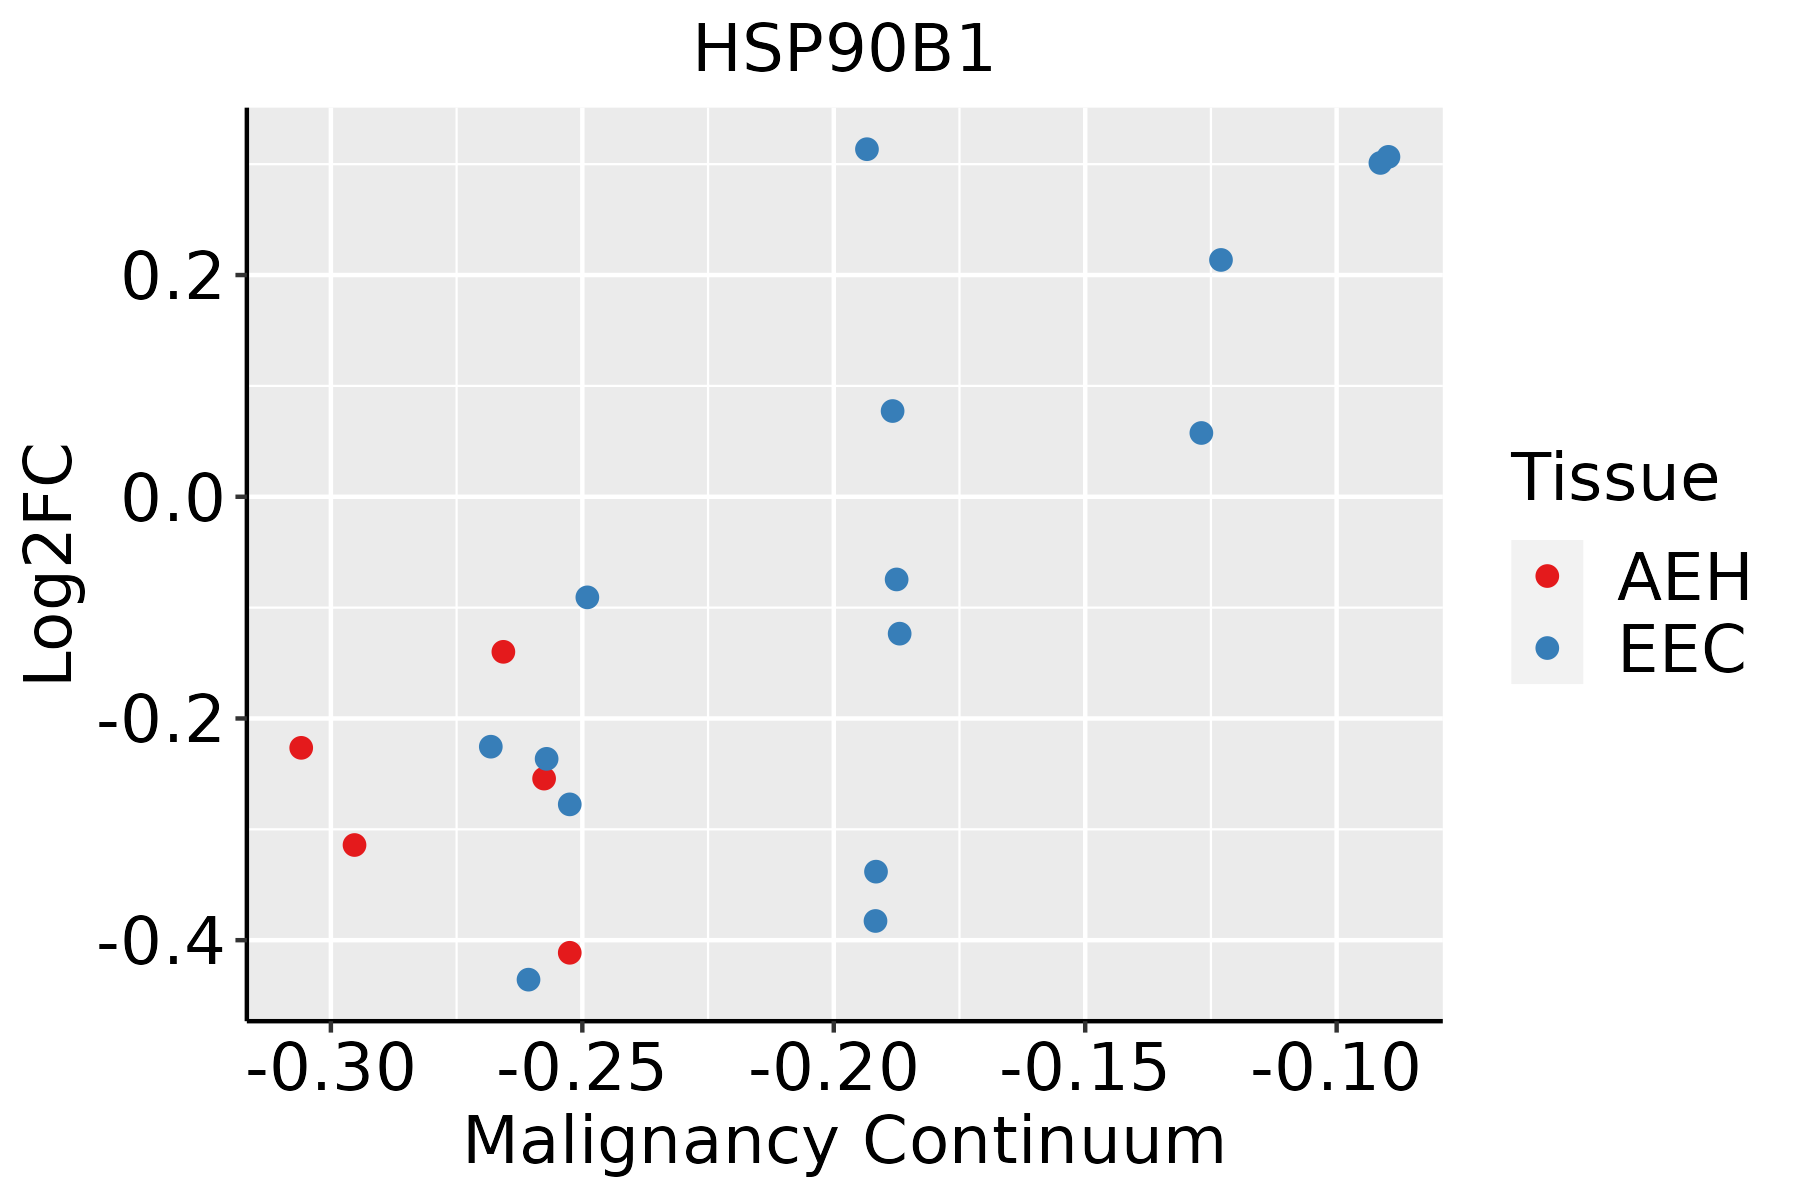 | AEH: Atypical endometrial hyperplasia |
| EEC: Endometrioid Cancer | ||
| Esophagus | 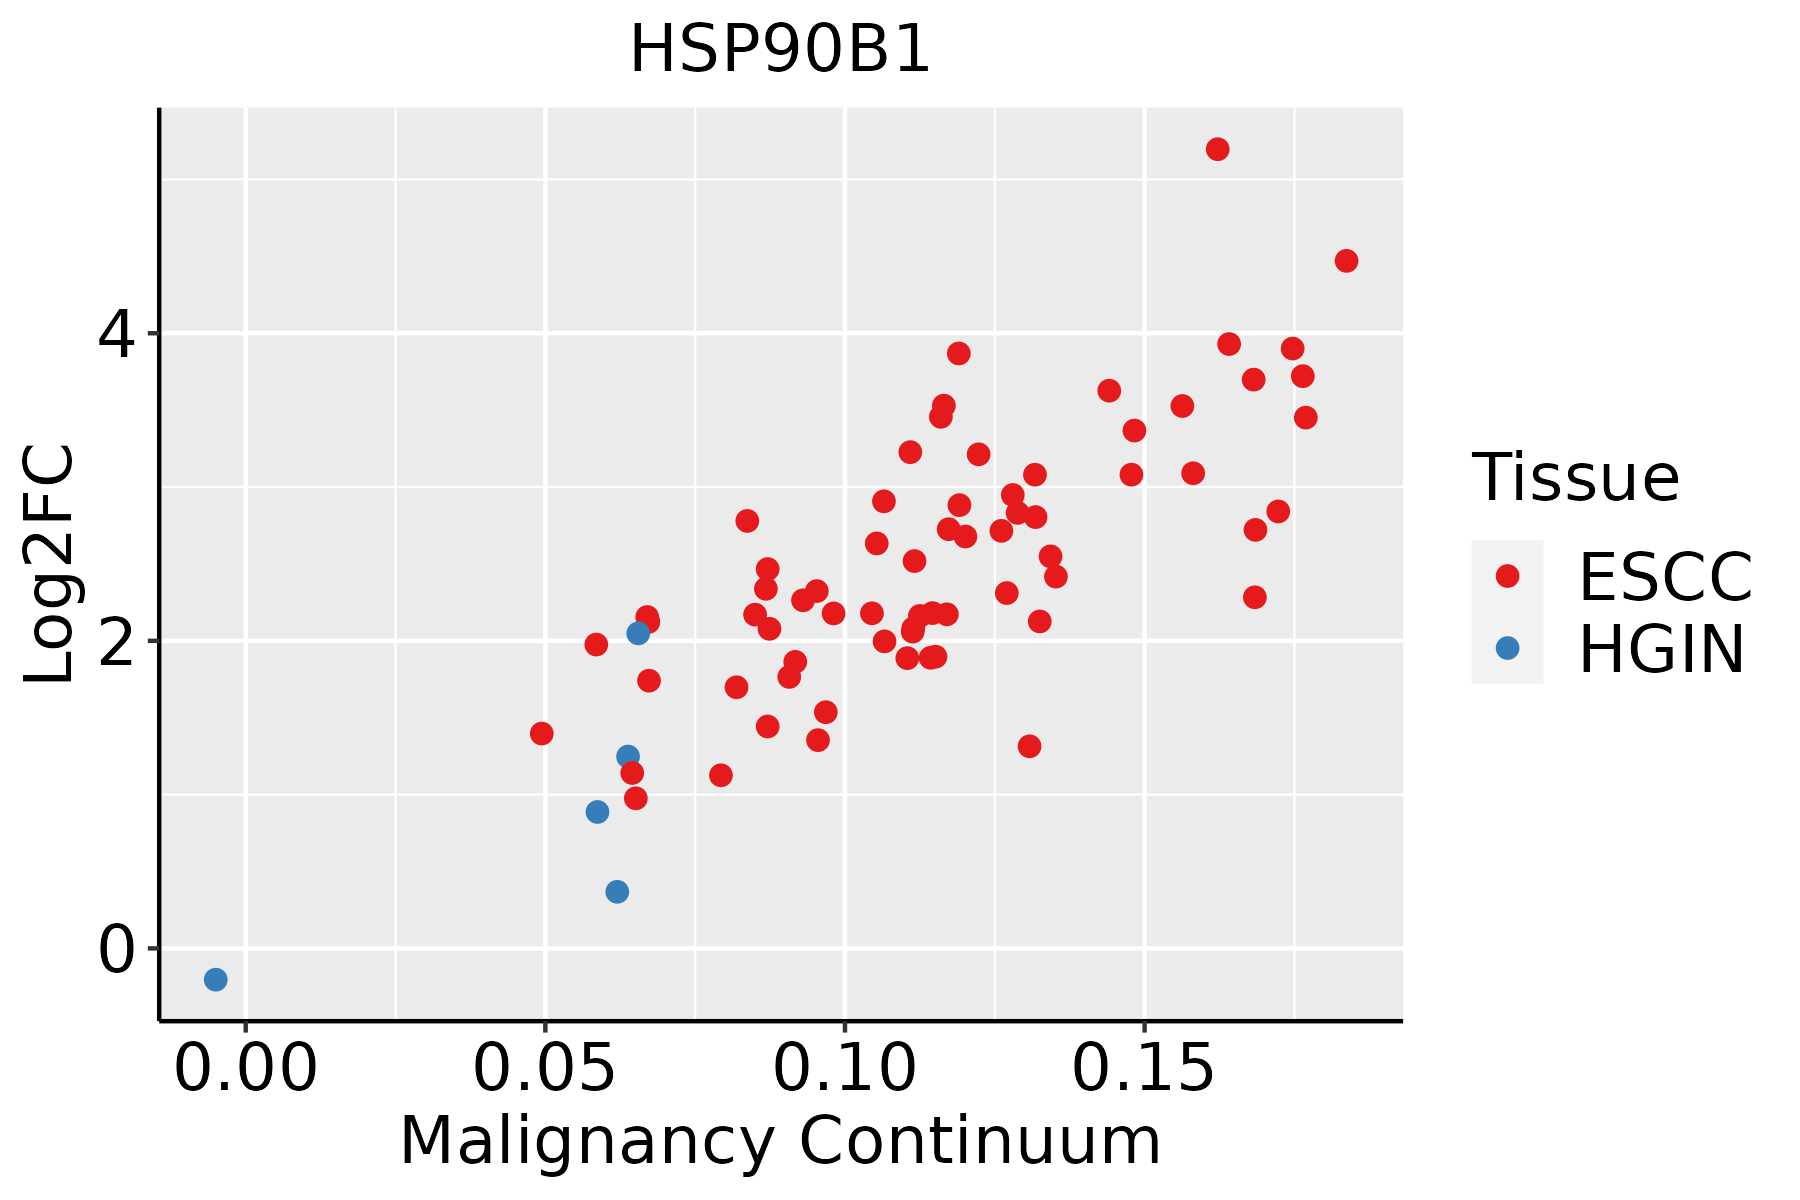 | ESCC: Esophageal squamous cell carcinoma |
| HGIN: High-grade intraepithelial neoplasias | ||
| LGIN: Low-grade intraepithelial neoplasias | ||
| GC |  | CAG: Chronic atrophic gastritis |
| CAG with IM: Chronic atrophic gastritis with intestinal metaplasia | ||
| CSG: Chronic superficial gastritis | ||
| GC: Gastric cancer | ||
| SIM: Severe intestinal metaplasia | ||
| WIM: Wild intestinal metaplasia | ||
| Liver | 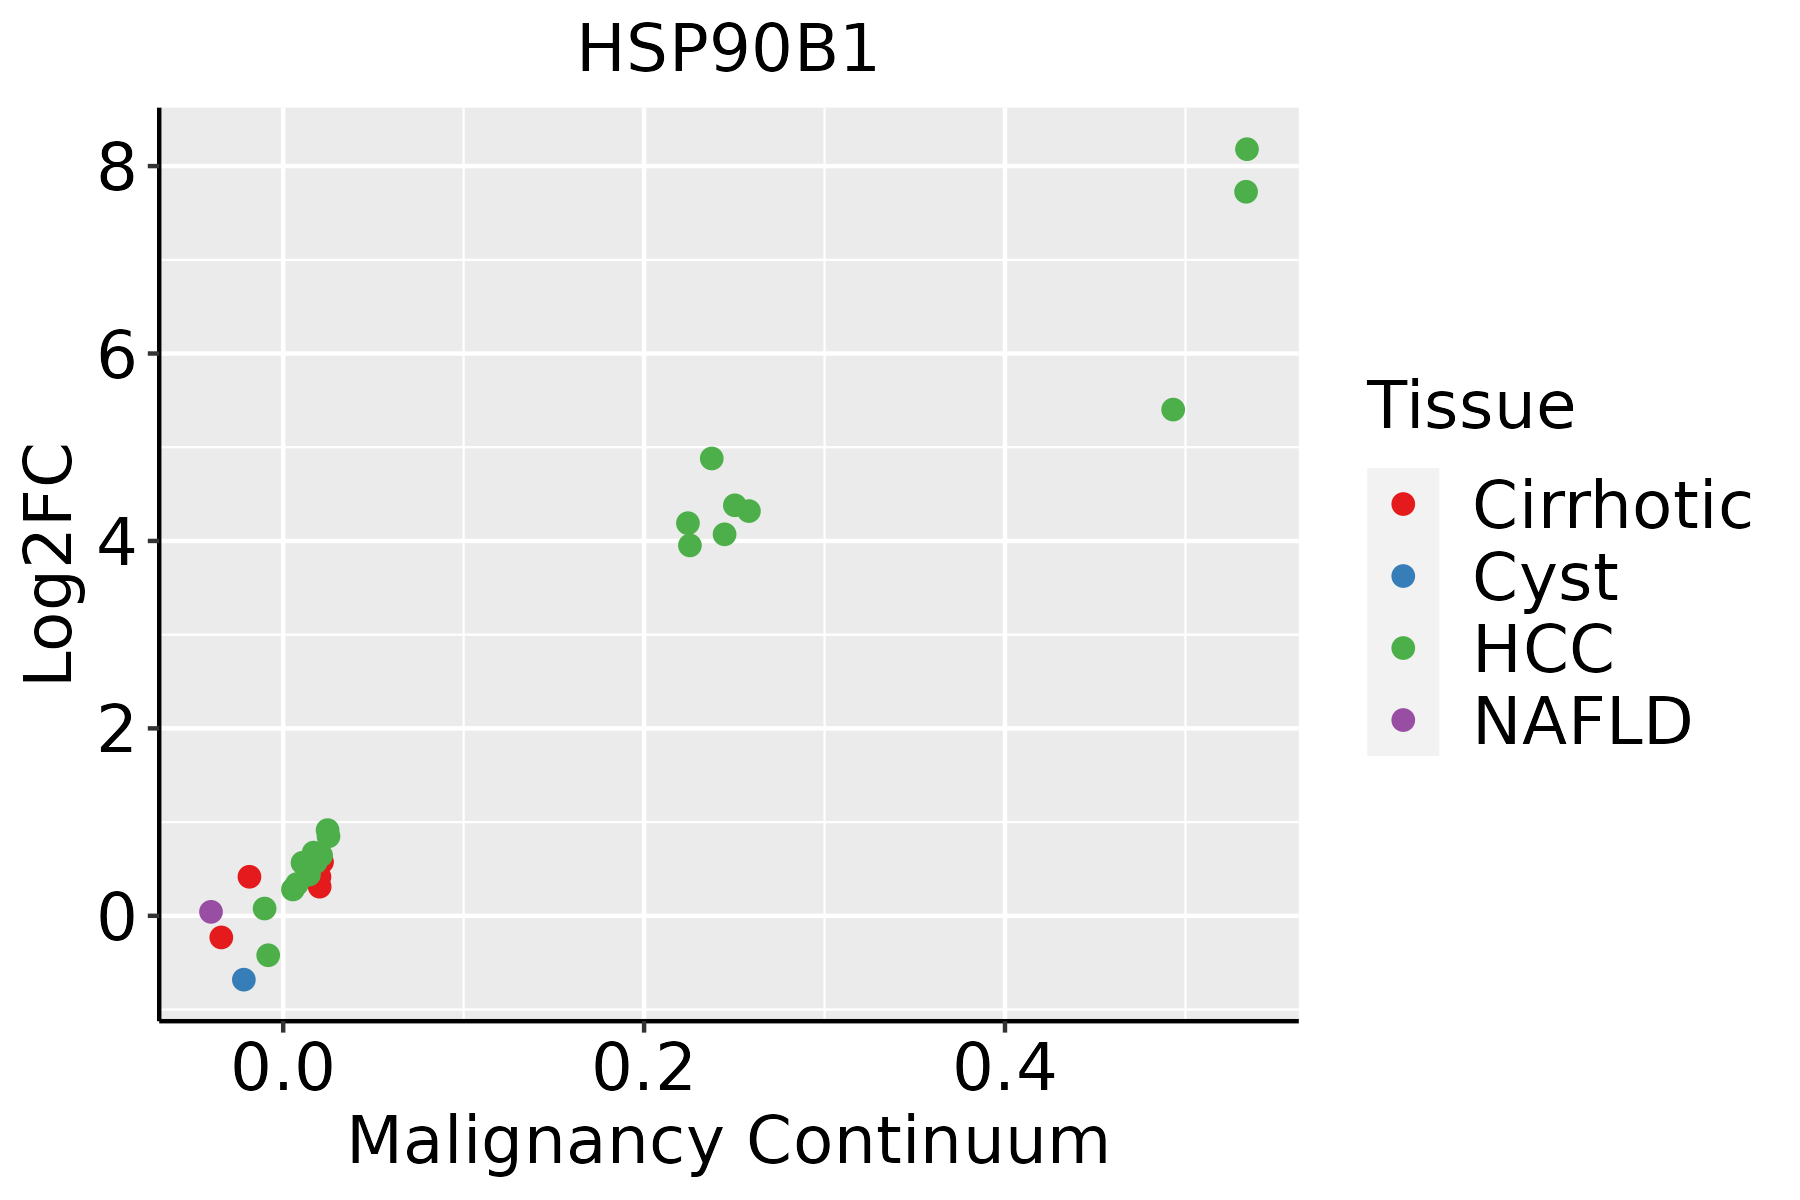 | HCC: Hepatocellular carcinoma |
| NAFLD: Non-alcoholic fatty liver disease | ||
| Oral Cavity | 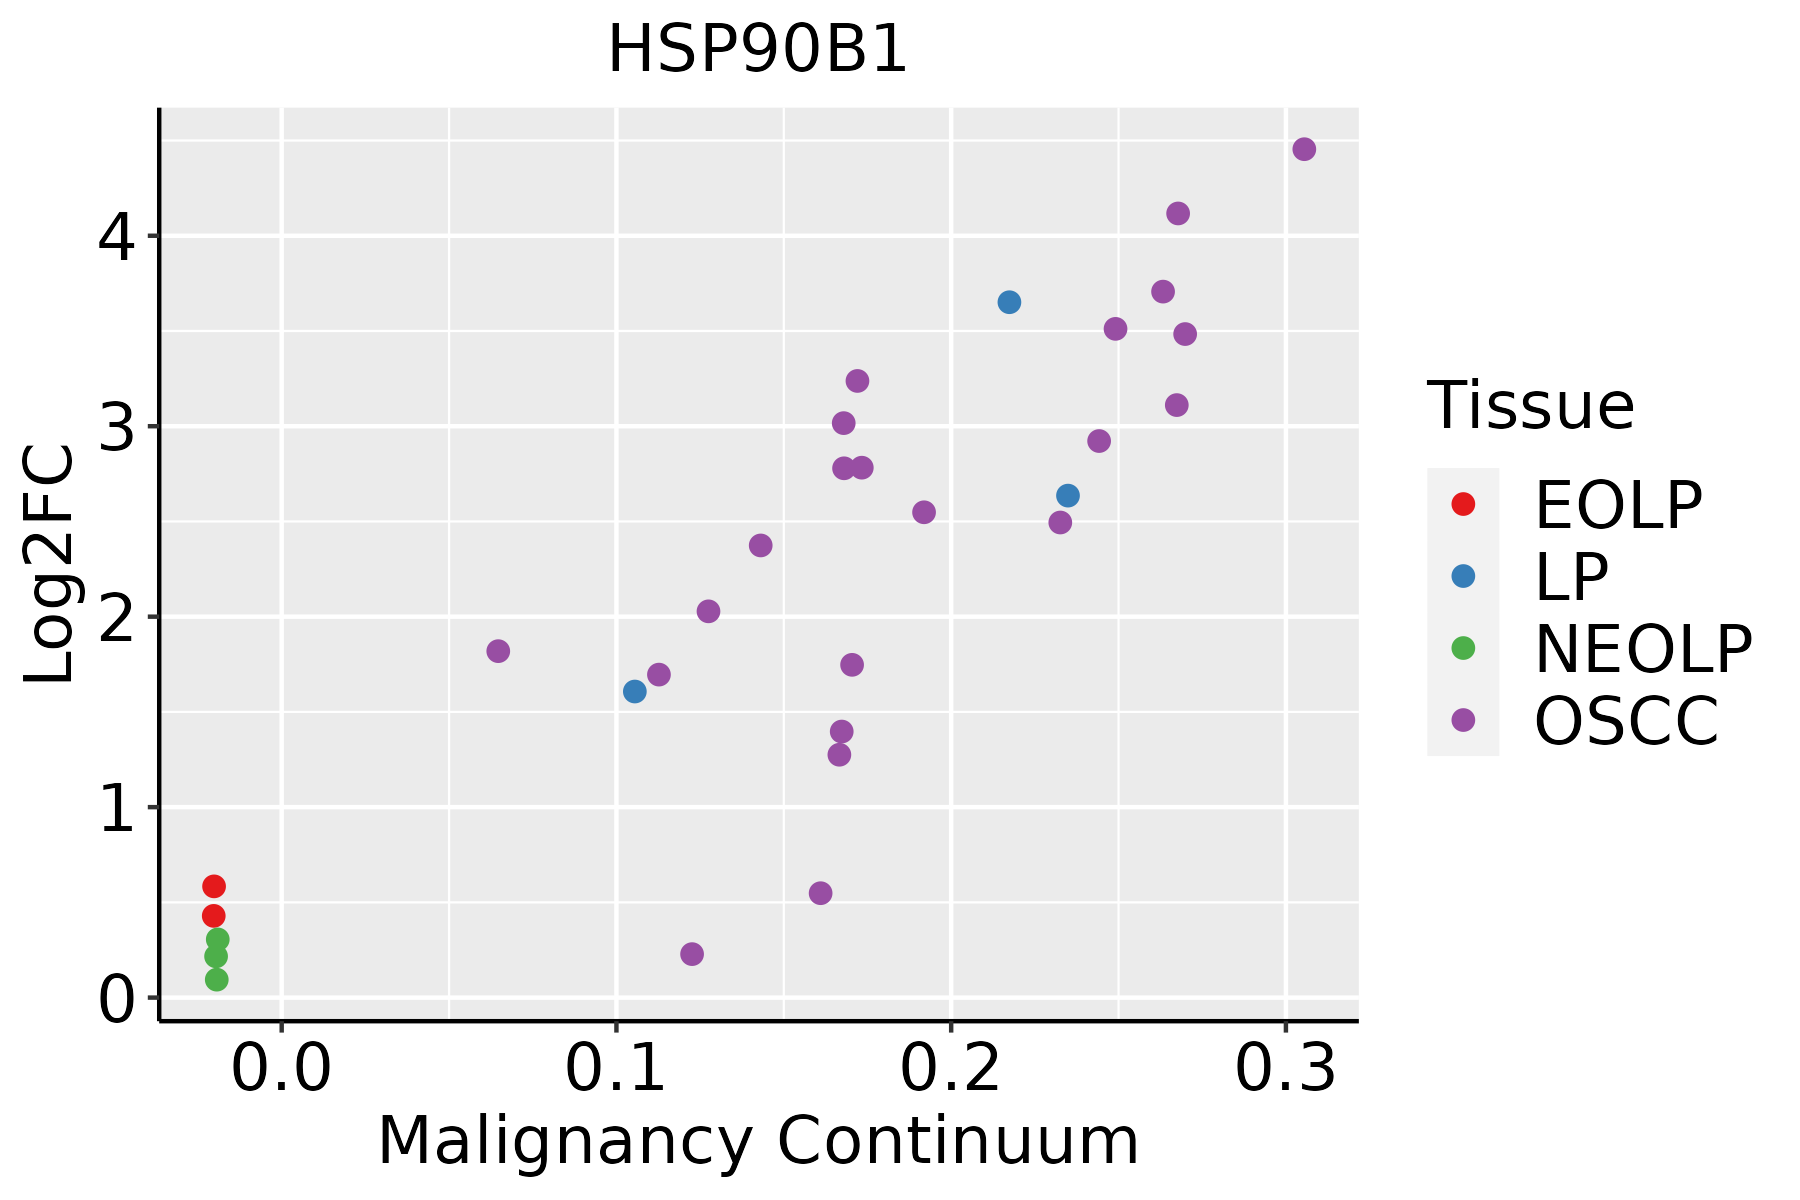 | EOLP: Erosive Oral lichen planus |
| LP: leukoplakia | ||
| NEOLP: Non-erosive oral lichen planus | ||
| OSCC: Oral squamous cell carcinoma | ||
| Prostate | 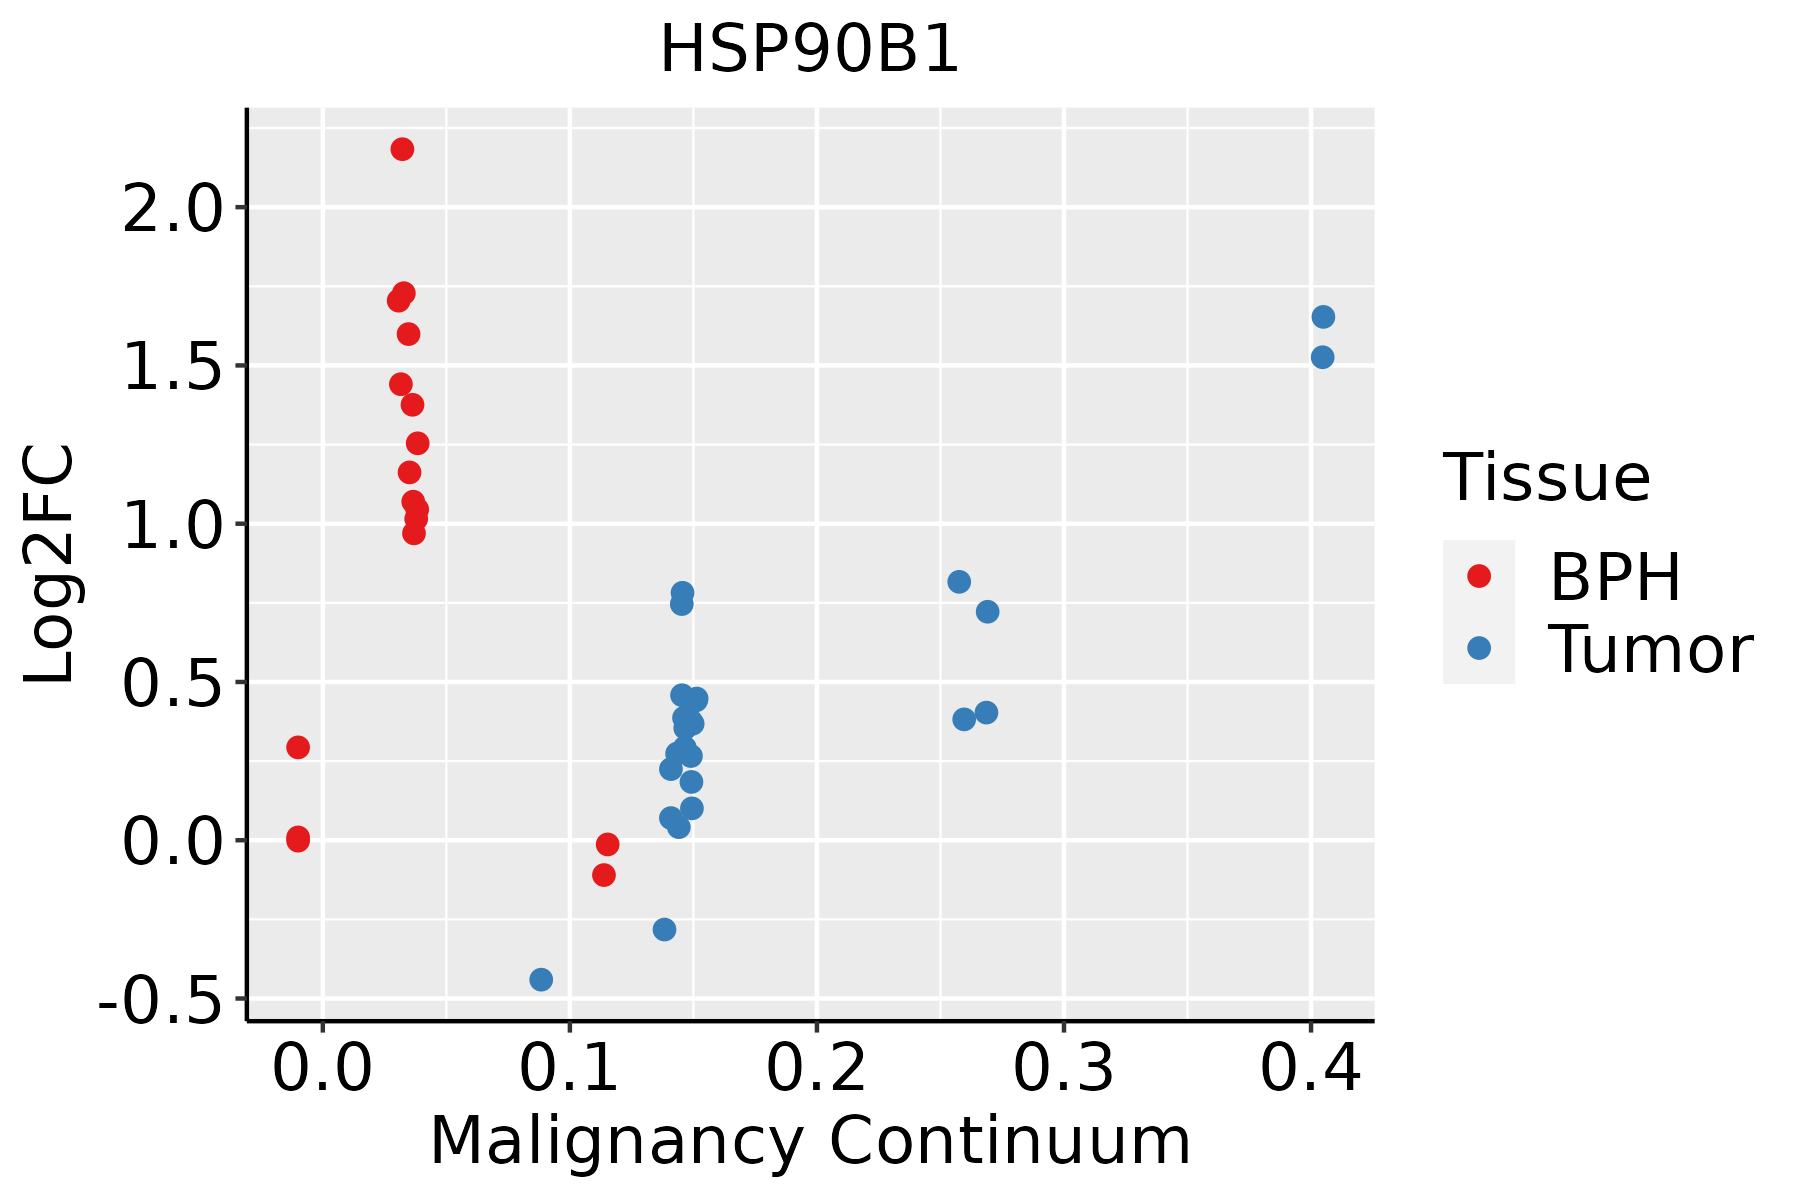 | BPH: Benign Prostatic Hyperplasia |
| Skin |  | AK: Actinic keratosis |
| cSCC: Cutaneous squamous cell carcinoma | ||
| SCCIS:squamous cell carcinoma in situ | ||
| Thyroid |  | ATC: Anaplastic thyroid cancer |
| HT: Hashimoto's thyroiditis | ||
| PTC: Papillary thyroid cancer |
| ∗log2FC in expression of this searched gene in stem-like cells from each diseased tissue sample relative to stem-like cells in normal samples in each tissue plotted against the malignancy continuum. Samples are colored based on if they are from different disease stage. |
Top |
Malignant transformation related pathway analysis |
| Find out the enriched GO biological processes and KEGG pathways involved in transition from healthy to precancer to cancer |
| Tissue | Disease Stage | Enriched GO biological Processes |
| Colorectum | AD |  |
| Colorectum | SER |  |
| Colorectum | MSS |  |
| Colorectum | MSI-H |  |
| Colorectum | FAP |  |
| ∗Top 15 enriched GO BP terms are showed in the bar plot of each disease state in each tissue. Each row represents a significant GO biological process which is colored according to the -log10(p.adjust). |
| Page: 1 2 3 4 5 6 7 8 9 |
| GO ID | Tissue | Disease Stage | Description | Gene Ratio | Bg Ratio | pvalue | p.adjust | Count |
| GO:00064578 | Breast | Precancer | protein folding | 43/1080 | 212/18723 | 3.48e-13 | 7.45e-11 | 43 |
| GO:00362939 | Breast | Precancer | response to decreased oxygen levels | 53/1080 | 322/18723 | 4.09e-12 | 6.84e-10 | 53 |
| GO:00016669 | Breast | Precancer | response to hypoxia | 51/1080 | 307/18723 | 7.33e-12 | 1.11e-09 | 51 |
| GO:00704829 | Breast | Precancer | response to oxygen levels | 55/1080 | 347/18723 | 7.47e-12 | 1.11e-09 | 55 |
| GO:00349769 | Breast | Precancer | response to endoplasmic reticulum stress | 38/1080 | 256/18723 | 7.89e-08 | 4.60e-06 | 38 |
| GO:00104989 | Breast | Precancer | proteasomal protein catabolic process | 58/1080 | 490/18723 | 1.54e-07 | 8.05e-06 | 58 |
| GO:00512358 | Breast | Precancer | maintenance of location | 40/1080 | 327/18723 | 5.85e-06 | 1.71e-04 | 40 |
| GO:00516519 | Breast | Precancer | maintenance of location in cell | 30/1080 | 214/18723 | 5.91e-06 | 1.71e-04 | 30 |
| GO:00349758 | Breast | Precancer | protein folding in endoplasmic reticulum | 6/1080 | 11/18723 | 1.31e-05 | 3.30e-04 | 6 |
| GO:00431619 | Breast | Precancer | proteasome-mediated ubiquitin-dependent protein catabolic process | 42/1080 | 412/18723 | 2.49e-04 | 3.72e-03 | 42 |
| GO:00070159 | Breast | Precancer | actin filament organization | 44/1080 | 442/18723 | 3.02e-04 | 4.35e-03 | 44 |
| GO:00353049 | Breast | Precancer | regulation of protein dephosphorylation | 14/1080 | 90/18723 | 6.16e-04 | 7.72e-03 | 14 |
| GO:00466839 | Breast | Precancer | response to organophosphorus | 16/1080 | 131/18723 | 3.60e-03 | 2.98e-02 | 16 |
| GO:00510179 | Breast | Precancer | actin filament bundle assembly | 18/1080 | 157/18723 | 4.17e-03 | 3.28e-02 | 18 |
| GO:00140749 | Breast | Precancer | response to purine-containing compound | 17/1080 | 148/18723 | 5.17e-03 | 3.86e-02 | 17 |
| GO:00615729 | Breast | Precancer | actin filament bundle organization | 18/1080 | 161/18723 | 5.43e-03 | 4.01e-02 | 18 |
| GO:00436667 | Breast | Precancer | regulation of phosphoprotein phosphatase activity | 9/1080 | 58/18723 | 5.67e-03 | 4.08e-02 | 9 |
| GO:0072503 | Breast | Precancer | cellular divalent inorganic cation homeostasis | 42/1080 | 486/18723 | 5.91e-03 | 4.21e-02 | 42 |
| GO:000645713 | Breast | IDC | protein folding | 47/1434 | 212/18723 | 2.31e-11 | 3.86e-09 | 47 |
| GO:007048214 | Breast | IDC | response to oxygen levels | 64/1434 | 347/18723 | 3.45e-11 | 5.57e-09 | 64 |
| Page: 1 2 3 4 5 6 7 8 9 10 11 12 13 14 15 16 17 18 19 20 21 22 23 24 25 26 27 28 29 30 31 32 33 |
| Pathway ID | Tissue | Disease Stage | Description | Gene Ratio | Bg Ratio | pvalue | p.adjust | qvalue | Count |
| hsa0414142 | Liver | Cyst | Protein processing in endoplasmic reticulum | 16/339 | 174/8465 | 1.61e-03 | 1.66e-02 | 1.37e-02 | 16 |
| hsa0541762 | Liver | Cyst | Lipid and atherosclerosis | 18/339 | 215/8465 | 2.43e-03 | 2.06e-02 | 1.70e-02 | 18 |
| hsa0513272 | Liver | Cyst | Salmonella infection | 27/339 | 249/8465 | 2.13e-06 | 3.61e-05 | 2.98e-05 | 27 |
| hsa0541872 | Liver | Cyst | Fluid shear stress and atherosclerosis | 17/339 | 139/8465 | 3.73e-05 | 5.65e-04 | 4.67e-04 | 17 |
| hsa0491515 | Liver | Cyst | Estrogen signaling pathway | 16/339 | 138/8465 | 1.20e-04 | 1.57e-03 | 1.30e-03 | 16 |
| hsa0465713 | Liver | Cyst | IL-17 signaling pathway | 11/339 | 94/8465 | 1.27e-03 | 1.36e-02 | 1.12e-02 | 11 |
| hsa0414152 | Liver | Cyst | Protein processing in endoplasmic reticulum | 16/339 | 174/8465 | 1.61e-03 | 1.66e-02 | 1.37e-02 | 16 |
| hsa0541772 | Liver | Cyst | Lipid and atherosclerosis | 18/339 | 215/8465 | 2.43e-03 | 2.06e-02 | 1.70e-02 | 18 |
| hsa0414130 | Oral cavity | OSCC | Protein processing in endoplasmic reticulum | 143/3704 | 174/8465 | 6.82e-26 | 2.28e-23 | 1.16e-23 | 143 |
| hsa0513230 | Oral cavity | OSCC | Salmonella infection | 174/3704 | 249/8465 | 2.67e-17 | 1.49e-15 | 7.58e-16 | 174 |
| hsa0541830 | Oral cavity | OSCC | Fluid shear stress and atherosclerosis | 92/3704 | 139/8465 | 6.51e-08 | 4.84e-07 | 2.47e-07 | 92 |
| hsa0541730 | Oral cavity | OSCC | Lipid and atherosclerosis | 131/3704 | 215/8465 | 2.20e-07 | 1.45e-06 | 7.37e-07 | 131 |
| hsa0521510 | Oral cavity | OSCC | Prostate cancer | 66/3704 | 97/8465 | 1.05e-06 | 5.89e-06 | 3.00e-06 | 66 |
| hsa0465724 | Oral cavity | OSCC | IL-17 signaling pathway | 64/3704 | 94/8465 | 1.48e-06 | 7.87e-06 | 4.01e-06 | 64 |
| hsa041516 | Oral cavity | OSCC | PI3K-Akt signaling pathway | 185/3704 | 354/8465 | 6.26e-04 | 1.86e-03 | 9.49e-04 | 185 |
| hsa04141113 | Oral cavity | OSCC | Protein processing in endoplasmic reticulum | 143/3704 | 174/8465 | 6.82e-26 | 2.28e-23 | 1.16e-23 | 143 |
| hsa05132114 | Oral cavity | OSCC | Salmonella infection | 174/3704 | 249/8465 | 2.67e-17 | 1.49e-15 | 7.58e-16 | 174 |
| hsa05418114 | Oral cavity | OSCC | Fluid shear stress and atherosclerosis | 92/3704 | 139/8465 | 6.51e-08 | 4.84e-07 | 2.47e-07 | 92 |
| hsa05417113 | Oral cavity | OSCC | Lipid and atherosclerosis | 131/3704 | 215/8465 | 2.20e-07 | 1.45e-06 | 7.37e-07 | 131 |
| hsa0521515 | Oral cavity | OSCC | Prostate cancer | 66/3704 | 97/8465 | 1.05e-06 | 5.89e-06 | 3.00e-06 | 66 |
| Page: 1 2 3 4 5 6 7 8 9 10 11 12 13 14 15 16 17 18 |
Top |
Cell-cell communication analysis |
| Identification of potential cell-cell interactions between two cell types and their ligand-receptor pairs for different disease states |
| Ligand | Receptor | LRpair | Pathway | Tissue | Disease Stage |
| Page: 1 |
Top |
Single-cell gene regulatory network inference analysis |
| Find out the significant the regulons (TFs) and the target genes of each regulon across cell types for different disease states |
| TF | Cell Type | Tissue | Disease Stage | Target Gene | RSS | Regulon Activity |
| ∗The dot plots of a searched regulon are shown for all cell subpopulations in each disease state of each tissue based on the regulon specific score inferred using pySCENIC and by calculating the average expression. |
| Page: 1 |
Top |
Somatic mutation of malignant transformation related genes |
| Annotation of somatic variants for genes involved in malignant transformation |
| Hugo Symbol | Variant Class | Variant Classification | dbSNP RS | HGVSc | HGVSp | HGVSp Short | SWISSPROT | BIOTYPE | SIFT | PolyPhen | Tumor Sample Barcode | Tissue | Histology | Sex | Age | Stage | Therapy Types | Drugs | Outcome |
| HSP90B1 | SNV | Missense_Mutation | c.275N>T | p.Ser92Leu | p.S92L | P14625 | protein_coding | deleterious(0) | probably_damaging(0.998) | TCGA-AC-A23H-01 | Breast | breast invasive carcinoma | Female | >=65 | I/II | Unknown | Unknown | PD | |
| HSP90B1 | SNV | Missense_Mutation | rs200904772 | c.937N>C | p.Glu313Gln | p.E313Q | P14625 | protein_coding | deleterious(0.03) | benign(0.249) | TCGA-C8-A132-01 | Breast | breast invasive carcinoma | Female | <65 | I/II | Unknown | Unknown | SD |
| HSP90B1 | deletion | Frame_Shift_Del | novel | c.1890delN | p.Ile631LeufsTer10 | p.I631Lfs*10 | P14625 | protein_coding | TCGA-EW-A2FV-01 | Breast | breast invasive carcinoma | Female | <65 | III/IV | Chemotherapy | docetaxel | SD | ||
| HSP90B1 | SNV | Missense_Mutation | novel | c.1180N>G | p.Pro394Ala | p.P394A | P14625 | protein_coding | deleterious(0.01) | possibly_damaging(0.82) | TCGA-HM-A4S6-01 | Cervix | cervical & endocervical cancer | Female | <65 | III/IV | Chemotherapy | cisplatin | CR |
| HSP90B1 | SNV | Missense_Mutation | novel | c.910N>A | p.Glu304Lys | p.E304K | P14625 | protein_coding | tolerated(0.69) | benign(0.011) | TCGA-IR-A3LK-01 | Cervix | cervical & endocervical cancer | Female | >=65 | I/II | Chemotherapy | cisplatin | PD |
| HSP90B1 | deletion | Frame_Shift_Del | novel | c.1214delA | p.Lys405ArgfsTer21 | p.K405Rfs*21 | P14625 | protein_coding | TCGA-VS-A94Z-01 | Cervix | cervical & endocervical cancer | Female | <65 | I/II | Chemotherapy | cisplatin | CR | ||
| HSP90B1 | SNV | Missense_Mutation | c.2201N>T | p.Ala734Val | p.A734V | P14625 | protein_coding | tolerated(0.27) | benign(0.071) | TCGA-A6-6140-01 | Colorectum | colon adenocarcinoma | Male | <65 | I/II | Chemotherapy | oxaliplatin | SD | |
| HSP90B1 | SNV | Missense_Mutation | c.339T>A | p.Asp113Glu | p.D113E | P14625 | protein_coding | deleterious(0.02) | probably_damaging(1) | TCGA-AA-3710-01 | Colorectum | colon adenocarcinoma | Female | >=65 | I/II | Unknown | Unknown | SD | |
| HSP90B1 | SNV | Missense_Mutation | rs368374645 | c.1240N>T | p.Arg414Cys | p.R414C | P14625 | protein_coding | deleterious(0) | probably_damaging(0.994) | TCGA-AA-3815-01 | Colorectum | colon adenocarcinoma | Female | >=65 | I/II | Unknown | Unknown | SD |
| HSP90B1 | SNV | Missense_Mutation | c.1034N>T | p.Arg345Ile | p.R345I | P14625 | protein_coding | deleterious(0.01) | probably_damaging(1) | TCGA-AA-A010-01 | Colorectum | colon adenocarcinoma | Female | <65 | I/II | Chemotherapy | folinic | CR |
| Page: 1 2 3 4 5 6 7 8 9 |
Top |
Related drugs of malignant transformation related genes |
| Identification of chemicals and drugs interact with genes involved in malignant transfromation |
| (DGIdb 4.0) |
| Entrez ID | Symbol | Category | Interaction Types | Drug Claim Name | Drug Name | PMIDs |
| 7184 | HSP90B1 | DRUGGABLE GENOME | inhibitor | 381118828 | ||
| 7184 | HSP90B1 | DRUGGABLE GENOME | inhibitor | 315661302 | ||
| 7184 | HSP90B1 | DRUGGABLE GENOME | HS-110 | VIAGENPUMATUCEL-L | ||
| 7184 | HSP90B1 | DRUGGABLE GENOME | inhibitor | 315661287 | SEMAPIMOD |
| Page: 1 |

Copyright 2023-Present -The University of Texas Health Science Center at Houston |