Schematic overview of the cellular and molecular mechanisms involved in the cancer progression, including the proposed cellular and molecular mechanisms in cancer cells trajectory. AT1: alveolar type 1 cells; AT2: alveolar type 2 cells; AAH: atypical adenomatous hyperplasia; AIS: adenocarcinoma in situ; MIA: minimally invasive adenocarcinoma; IA: invasive adenocarcinoma; EMT: epithelial-mesenchymal transition

Home

Download

Statistics

Help

Contact

Center for Computational Systems Medicine
leaf

Gene summary

leaf

Malignant transformation analysis

leaf

Malignant transformation related pathway analysis

leaf

Cell-cell communication analysis

leaf

Single-cell gene regulatory network inference analysis

leaf

Somatic mutation of malignant transformation related genes

leaf

Related drugs of malignant transformation related genes

Gene: USP1

Gene summary for USP1

check button Gene summary.

Gene informationSpeciesHuman
Gene symbol

USP1

Gene ID

7398

Gene nameubiquitin specific peptidase 1
Gene AliasUBP
Cytomap1p31.3
Gene Typeprotein-coding
GO ID

GO:0001501

UniProtAcc

O94782


Top

Malignant transformation analysis

check button Identification of the aberrant gene expression in precancerous and cancerous lesions by comparing the gene expression of stem-like cells in diseased tissues with normal stem cells
check button Malignant transformation involving gene list.
Entrez IDSymbolReplicatesSpeciesOrganTissueAdj P-valueLog2FCMalignancy
7398USP1GSM4909281HumanBreastIDC1.99e-155.59e-010.21
7398USP1GSM4909282HumanBreastIDC6.34e-114.95e-01-0.0288
7398USP1GSM4909285HumanBreastIDC4.08e-194.50e-010.21
7398USP1GSM4909286HumanBreastIDC1.90e-114.78e-010.1081
7398USP1GSM4909287HumanBreastIDC3.37e-105.37e-010.2057
7398USP1GSM4909293HumanBreastIDC4.70e-021.68e-010.1581
7398USP1GSM4909311HumanBreastIDC1.09e-07-1.44e-010.1534
7398USP1GSM4909319HumanBreastIDC2.99e-09-6.62e-020.1563
7398USP1DCIS2HumanBreastDCIS9.40e-422.07e-010.0085
7398USP1LZE2DHumanEsophagusHGIN8.33e-052.54e-010.0642
7398USP1LZE2THumanEsophagusESCC2.09e-067.14e-010.082
7398USP1LZE3DHumanEsophagusHGIN1.74e-024.99e-010.0668
7398USP1LZE4THumanEsophagusESCC1.36e-062.61e-010.0811
7398USP1LZE7THumanEsophagusESCC3.96e-106.55e-010.0667
7398USP1LZE20THumanEsophagusESCC2.62e-042.01e-010.0662
7398USP1LZE24THumanEsophagusESCC9.63e-185.05e-010.0596
7398USP1LZE6THumanEsophagusESCC4.43e-052.03e-010.0845
7398USP1P1T-EHumanEsophagusESCC5.22e-034.35e-010.0875
7398USP1P2T-EHumanEsophagusESCC1.80e-511.17e+000.1177
7398USP1P4T-EHumanEsophagusESCC2.36e-166.02e-010.1323
Page: 1 2 3 4 5 6 7 

check button Transcriptomic changes along malignancy continuum.
TissueExpression DynamicsAbbreviation
BreastThe image shows the transcriptomic changes along malignancy continuum.log2FC in expression of this searched gene in stem-like cells from each diseased tissue sample relative to stem-like cells in normal samples in each tissue plotted against the malignancy continuum. Samples are colored based on if they are from different disease stage.
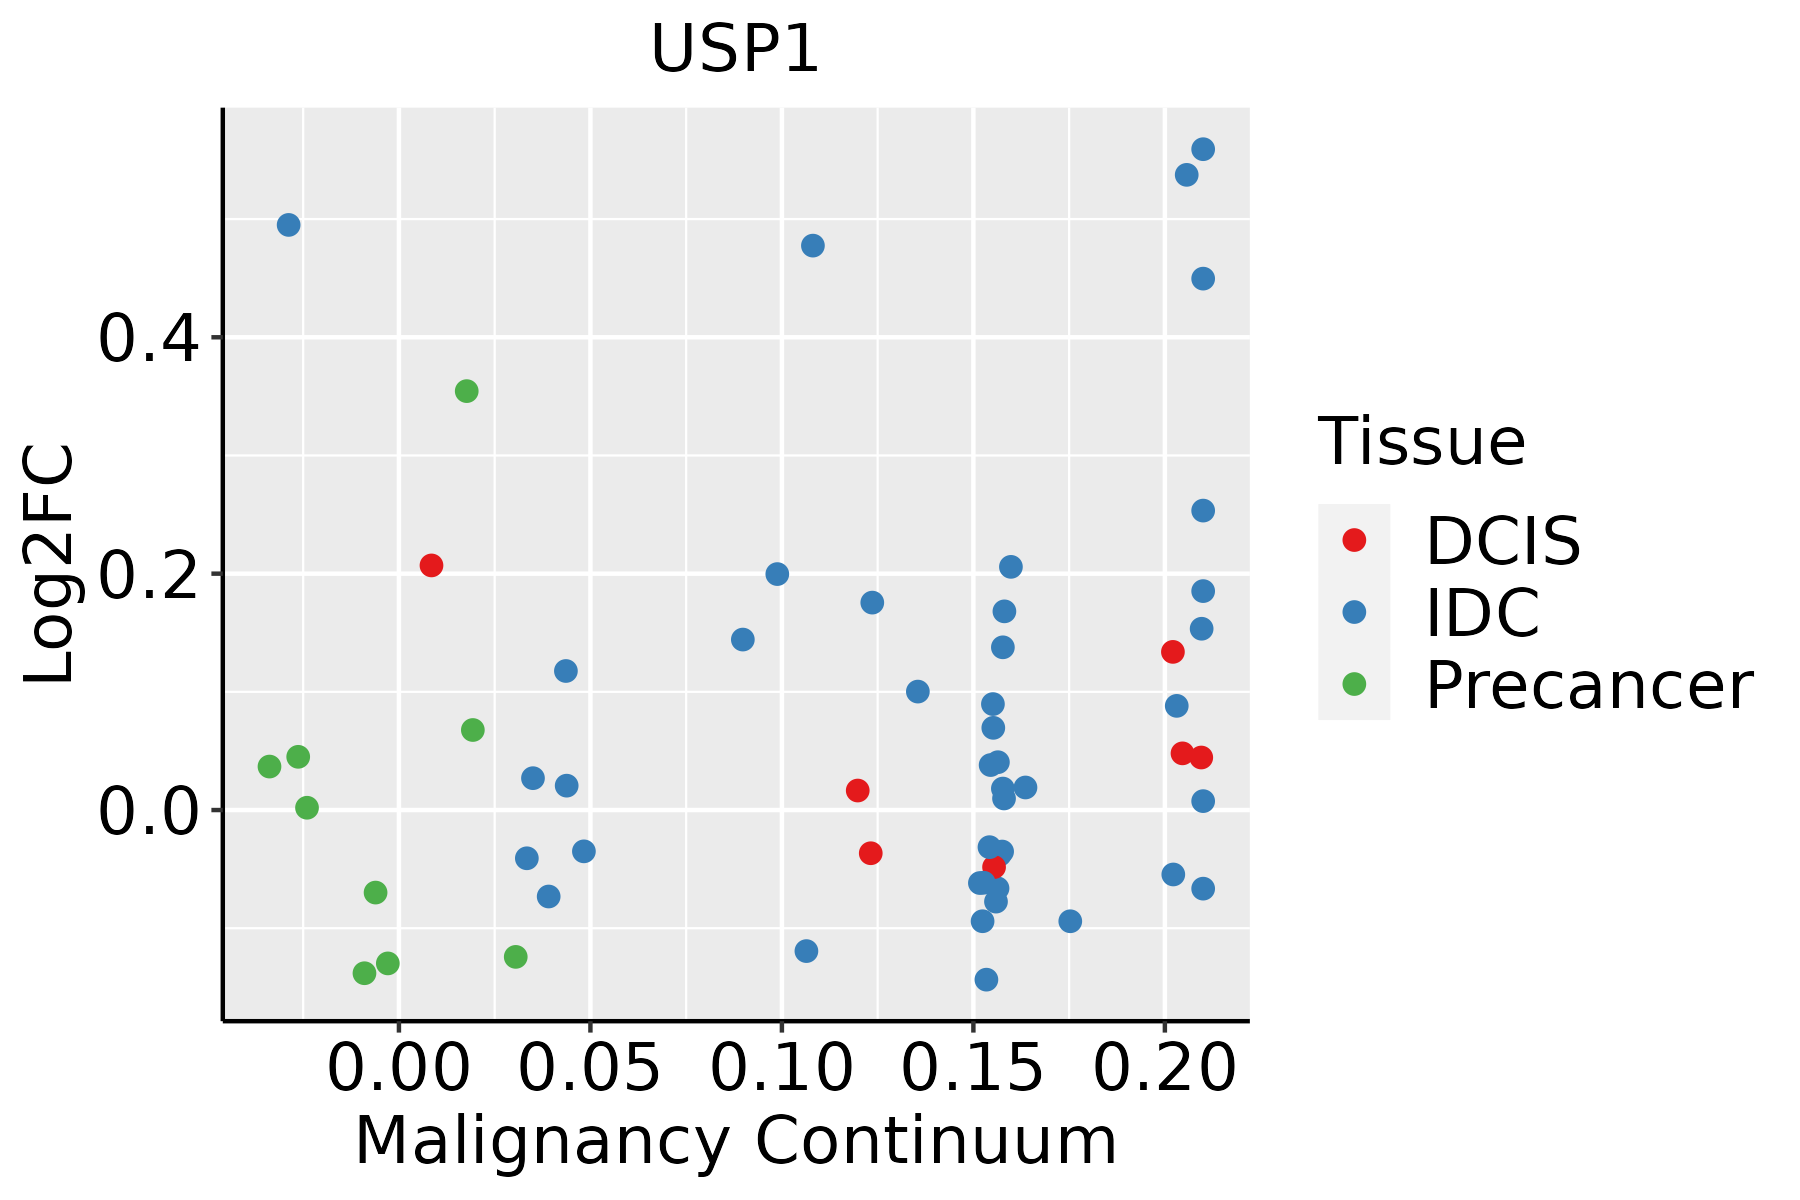
IDC: Invasive ductal carcinoma
DCIS: Ductal carcinoma in situ
Precancer(BRCA1-mut): Precancerous lesion from BRCA1 mutation carriers
EsophagusThe image shows the transcriptomic changes along malignancy continuum.log2FC in expression of this searched gene in stem-like cells from each diseased tissue sample relative to stem-like cells in normal samples in each tissue plotted against the malignancy continuum. Samples are colored based on if they are from different disease stage.
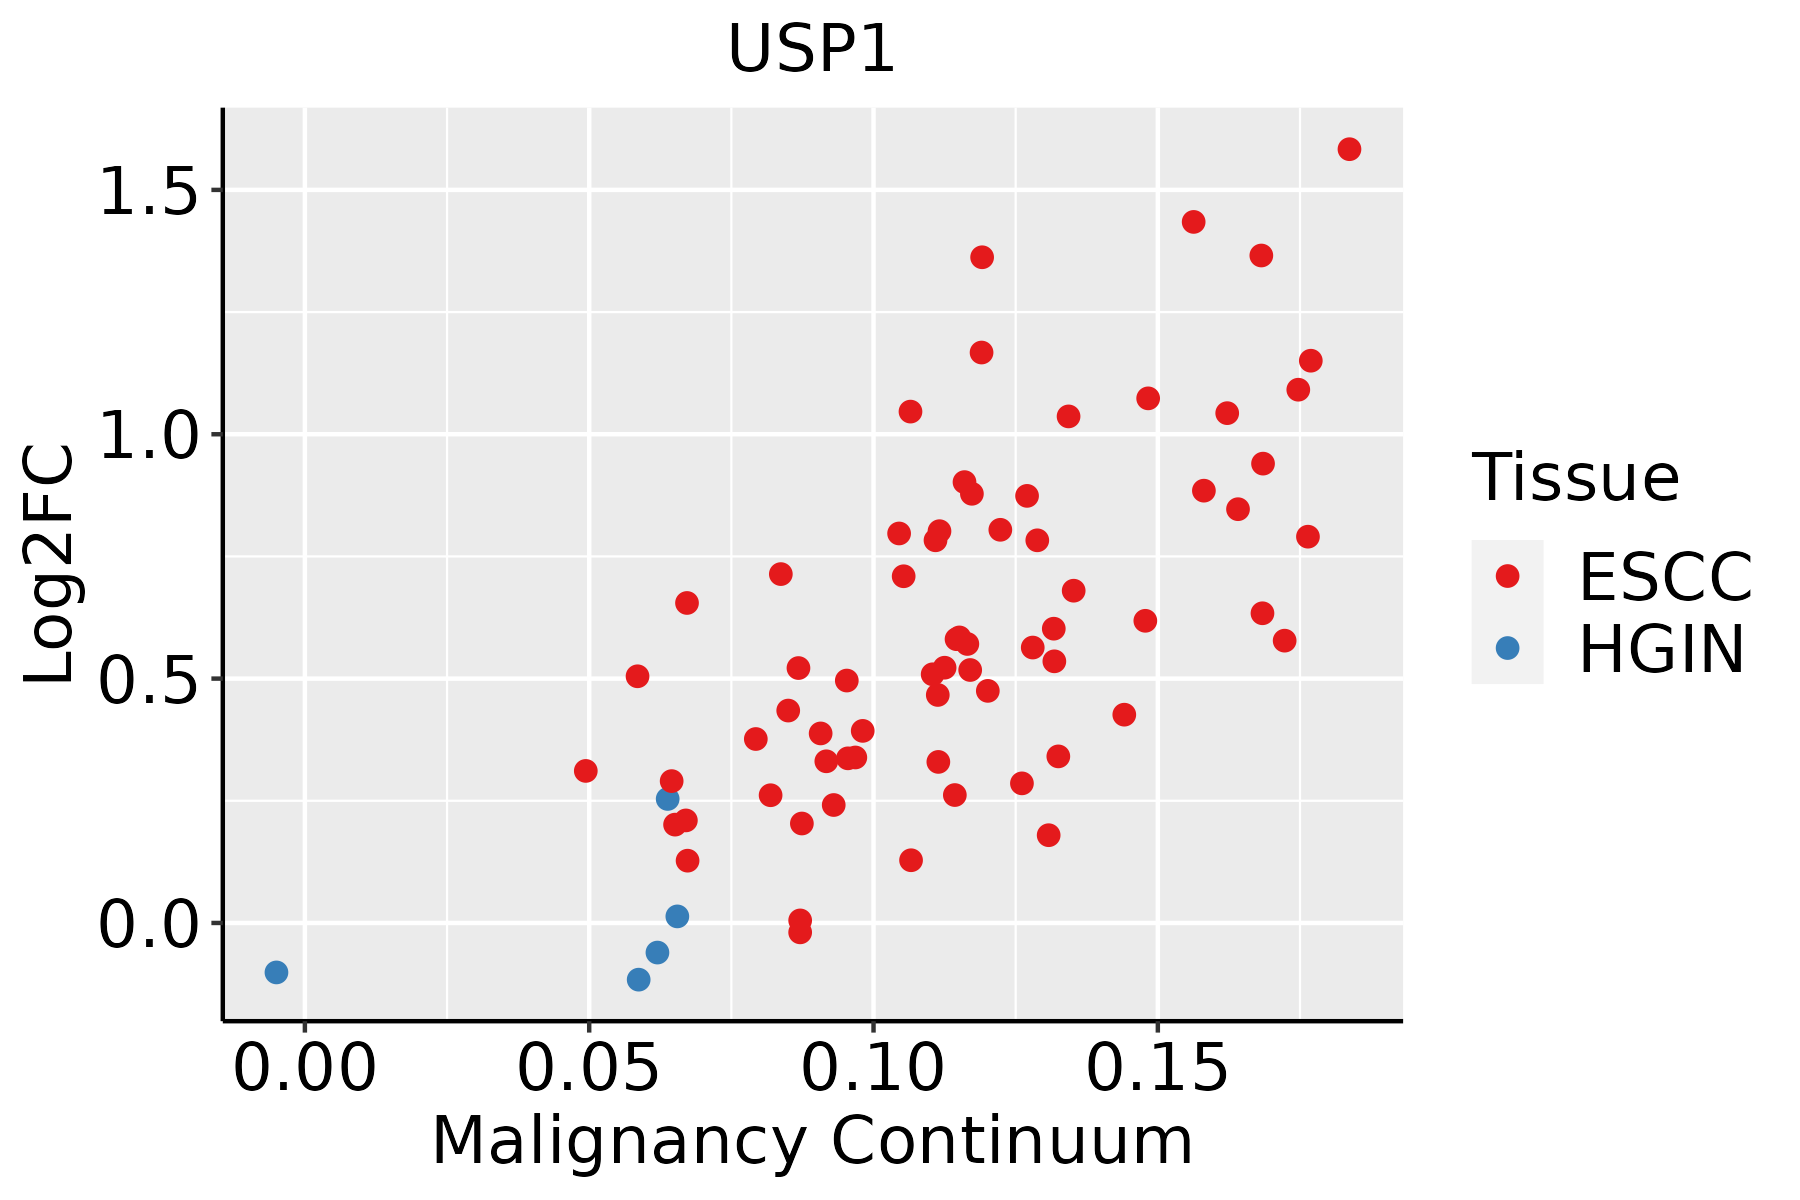
ESCC: Esophageal squamous cell carcinoma
HGIN: High-grade intraepithelial neoplasias
LGIN: Low-grade intraepithelial neoplasias
LiverThe image shows the transcriptomic changes along malignancy continuum.log2FC in expression of this searched gene in stem-like cells from each diseased tissue sample relative to stem-like cells in normal samples in each tissue plotted against the malignancy continuum. Samples are colored based on if they are from different disease stage.
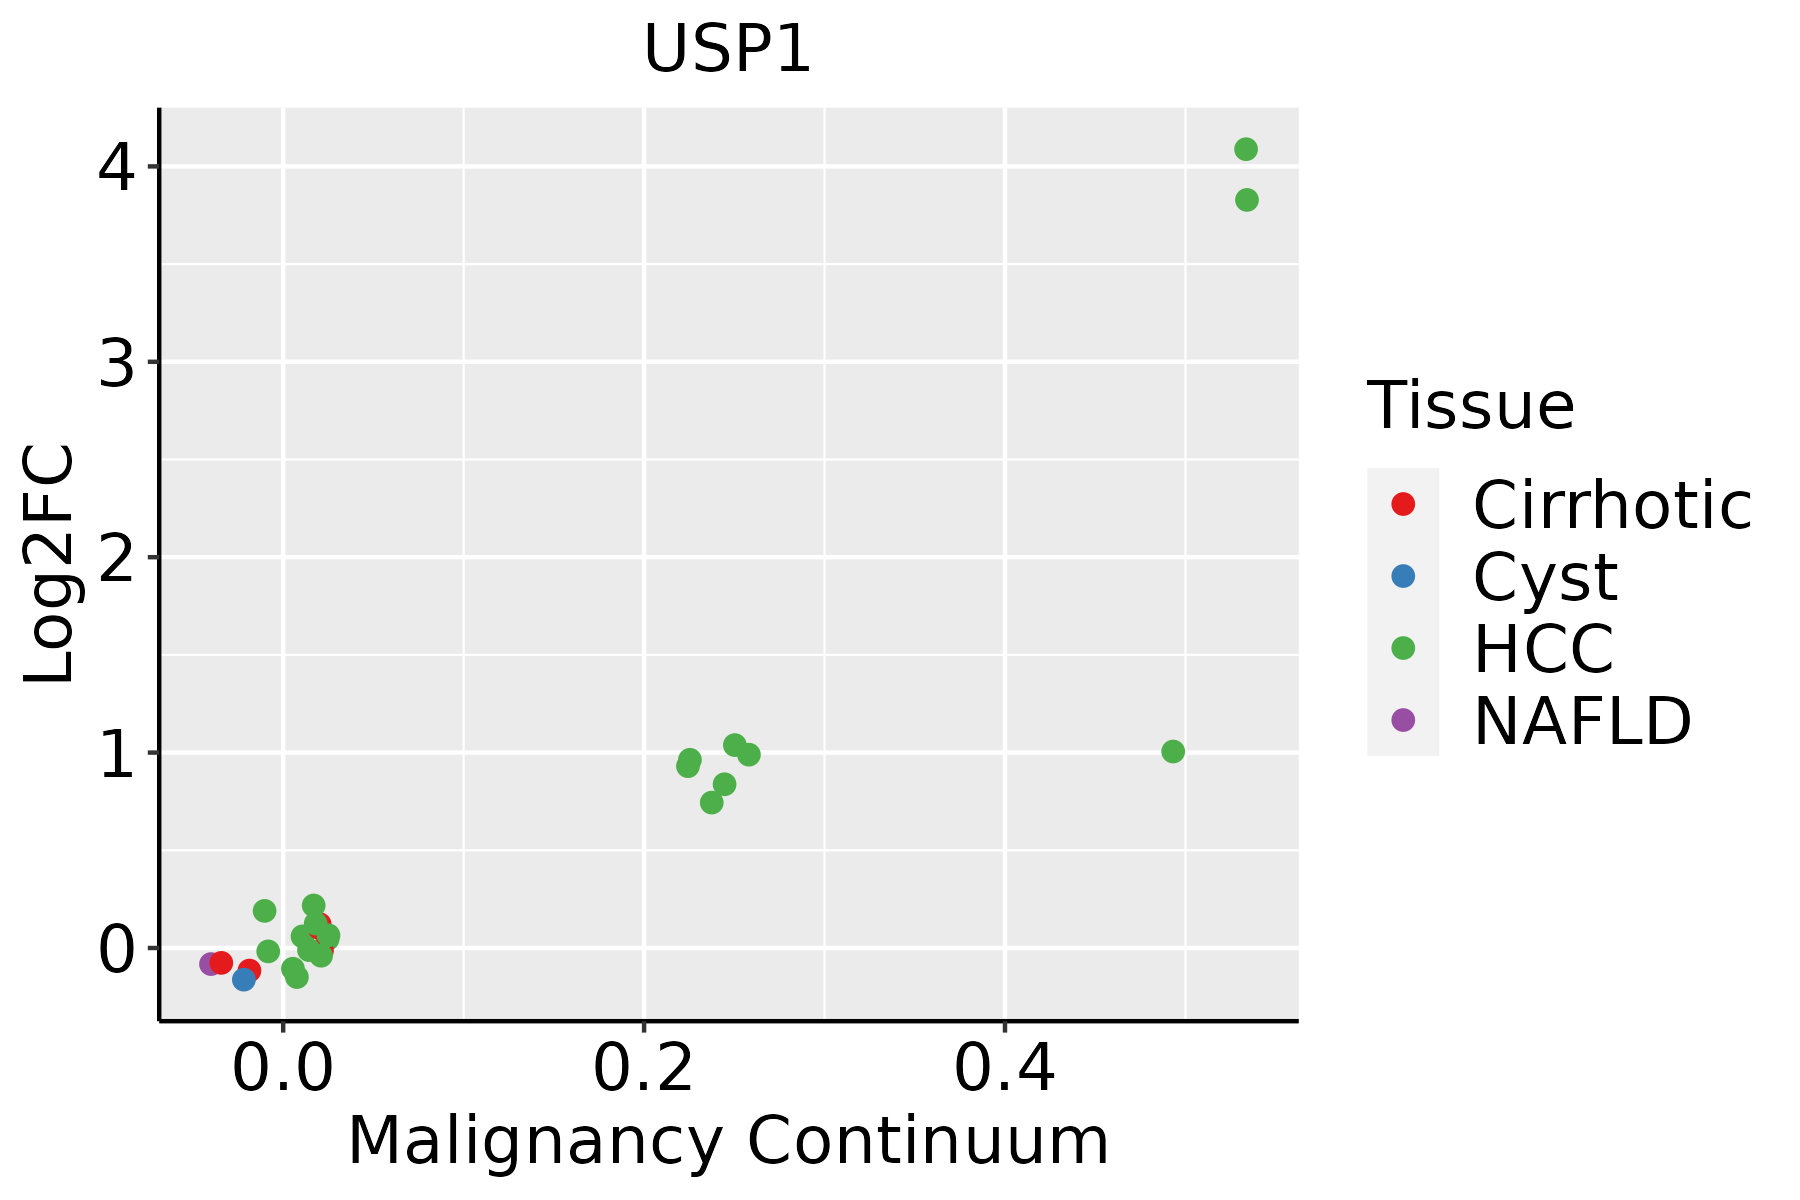
HCC: Hepatocellular carcinoma
NAFLD: Non-alcoholic fatty liver disease
Oral CavityThe image shows the transcriptomic changes along malignancy continuum.log2FC in expression of this searched gene in stem-like cells from each diseased tissue sample relative to stem-like cells in normal samples in each tissue plotted against the malignancy continuum. Samples are colored based on if they are from different disease stage.EOLP: Erosive Oral lichen planus
LP: leukoplakia
NEOLP: Non-erosive oral lichen planus
OSCC: Oral squamous cell carcinoma
SkinThe image shows the transcriptomic changes along malignancy continuum.log2FC in expression of this searched gene in stem-like cells from each diseased tissue sample relative to stem-like cells in normal samples in each tissue plotted against the malignancy continuum. Samples are colored based on if they are from different disease stage.
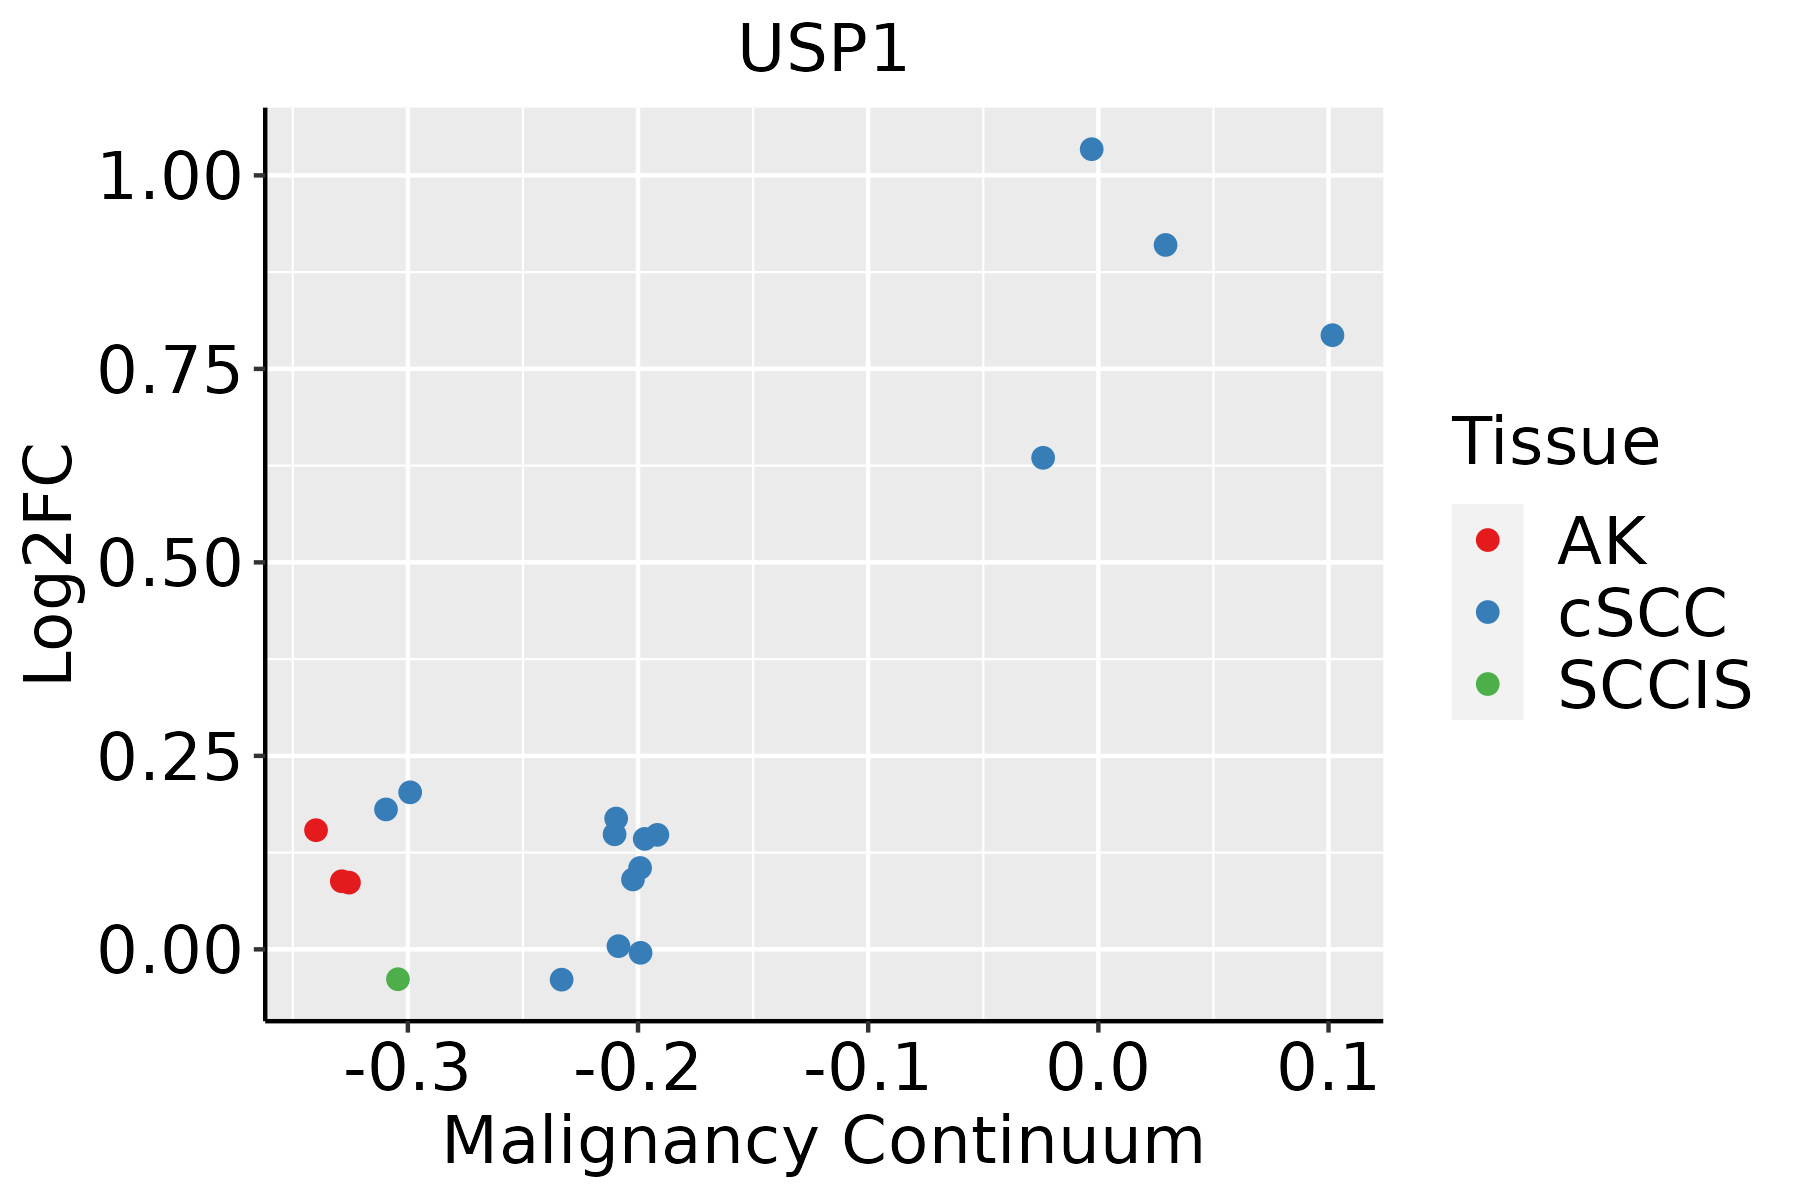
AK: Actinic keratosis
cSCC: Cutaneous squamous cell carcinoma
SCCIS:squamous cell carcinoma in situ
ThyroidThe image shows the transcriptomic changes along malignancy continuum.log2FC in expression of this searched gene in stem-like cells from each diseased tissue sample relative to stem-like cells in normal samples in each tissue plotted against the malignancy continuum. Samples are colored based on if they are from different disease stage.ATC: Anaplastic thyroid cancer
HT: Hashimoto's thyroiditis
PTC: Papillary thyroid cancer
∗log2FC in expression of this searched gene in stem-like cells from each diseased tissue sample relative to stem-like cells in normal samples in each tissue plotted against the malignancy continuum. Samples are colored based on if they are from different disease stage.

Top

Malignant transformation related pathway analysis

check buttonFind out the enriched GO biological processes and KEGG pathways involved in transition from healthy to precancer to cancer
check button Figure of enriched GO biological processes.
TissueDisease StageEnriched GO biological Processes
ColorectumADGO analysis - Figure of enriched GO biological processes: Top 15 enriched GO BP terms are showed in the bar plot of each disease state in each tissue. Each row represents a significant GO biological process which is colored according to the -log10(p.adjust).
ColorectumSERGO analysis - Figure of enriched GO biological processes: Top 15 enriched GO BP terms are showed in the bar plot of each disease state in each tissue. Each row represents a significant GO biological process which is colored according to the -log10(p.adjust).
ColorectumMSSGO analysis - Figure of enriched GO biological processes: Top 15 enriched GO BP terms are showed in the bar plot of each disease state in each tissue. Each row represents a significant GO biological process which is colored according to the -log10(p.adjust).
ColorectumMSI-HGO analysis - Figure of enriched GO biological processes: Top 15 enriched GO BP terms are showed in the bar plot of each disease state in each tissue. Each row represents a significant GO biological process which is colored according to the -log10(p.adjust).
ColorectumFAPGO analysis - Figure of enriched GO biological processes: Top 15 enriched GO BP terms are showed in the bar plot of each disease state in each tissue. Each row represents a significant GO biological process which is colored according to the -log10(p.adjust).
∗Top 15 enriched GO BP terms are showed in the bar plot of each disease state in each tissue. Each row represents a significant GO biological process which is colored according to the -log10(p.adjust).
Page: 1 2 3 4 5 6 7 8 9 

check button Enriched GO biological processes.
GO IDTissueDisease StageDescriptionGene RatioBg Ratiopvaluep.adjustCount
GO:000749211ProstateTumorendoderm development28/324677/187235.01e-055.55e-0428
GO:003043312ProstateTumorubiquitin-dependent ERAD pathway30/324685/187235.26e-055.75e-0430
GO:001095116ProstateTumornegative regulation of endopeptidase activity68/3246252/187237.91e-058.19e-0468
GO:003650313ProstateTumorERAD pathway35/3246107/187238.02e-058.19e-0435
GO:001046617ProstateTumornegative regulation of peptidase activity70/3246262/187238.76e-058.66e-0470
GO:005127114ProstateTumornegative regulation of cellular component movement92/3246367/187231.03e-049.99e-0492
GO:007189714ProstateTumorDNA biosynthetic process51/3246180/187231.63e-041.46e-0351
GO:001063917ProstateTumornegative regulation of organelle organization87/3246348/187231.73e-041.53e-0387
GO:000736912ProstateTumorgastrulation52/3246185/187231.76e-041.55e-0352
GO:000931415ProstateTumorresponse to radiation109/3246456/187231.94e-041.70e-03109
GO:200014614ProstateTumornegative regulation of cell motility89/3246359/187231.99e-041.74e-0389
GO:003287215ProstateTumorregulation of stress-activated MAPK cascade53/3246192/187232.51e-042.11e-0353
GO:005105212ProstateTumorregulation of DNA metabolic process88/3246359/187233.23e-042.59e-0388
GO:000661115ProstateTumorprotein export from nucleus21/324657/187233.44e-042.73e-0321
GO:003357413ProstateTumorresponse to testosterone17/324642/187233.45e-042.73e-0317
GO:004578611ProstateTumornegative regulation of cell cycle93/3246385/187233.79e-042.95e-0393
GO:007030215ProstateTumorregulation of stress-activated protein kinase signaling cascade53/3246195/187233.80e-042.95e-0353
GO:004001313ProstateTumornegative regulation of locomotion94/3246391/187234.20e-043.21e-0394
GO:003033613ProstateTumornegative regulation of cell migration84/3246344/187234.95e-043.66e-0384
GO:000170411ProstateTumorformation of primary germ layer36/3246121/187235.22e-043.82e-0336
Page: 1 2 3 4 5 6 7 8 9 10 11 12 13 14 15 16 17 18 19 20 21 22 23 24 25 26 27 28 29 30 31 32 33 34 35 36 37 38 39 40 41 42 43 44 45 46 47 48 49 50 51 52 53 54 55 56 57 58 59 60 61 62 63 64 65 66 67 68 69 70 71 72 73 74 75 76 77 78 79 80 81 82 83 84 85 86 87 88 89 90 91 92 93 94 95 96 97 98 99 100 101 102 103 104 105 106 107 108 109 110 111 112 113 114 115 116 117 118 119 120 121 122 123 124 125 126 127 128 129 130 131 132 133 134 135 136 137 138 139 140 141 142 143 144 145 146 147 

check button Enriched KEGG pathways.
Pathway IDTissueDisease StageDescriptionGene RatioBg Ratiopvaluep.adjustqvalueCount
Page: 1 

Top

Cell-cell communication analysis

check buttonIdentification of potential cell-cell interactions between two cell types and their ligand-receptor pairs for different disease states
LigandReceptorLRpairPathwayTissueDisease Stage
Page: 1 

Top

Single-cell gene regulatory network inference analysis

check buttonFind out the significant the regulons (TFs) and the target genes of each regulon across cell types for different disease states
TFCell TypeTissueDisease StageTarget GeneRSSRegulon Activity
∗The dot plots of a searched regulon are shown for all cell subpopulations in each disease state of each tissue based on the regulon specific score inferred using pySCENIC and by calculating the average expression.
Page: 1 

Top

Somatic mutation of malignant transformation related genes

check buttonAnnotation of somatic variants for genes involved in malignant transformation
Hugo SymbolVariant ClassVariant ClassificationdbSNP RSHGVScHGVSpHGVSp ShortSWISSPROTBIOTYPESIFTPolyPhenTumor Sample BarcodeTissueHistologySexAgeStageTherapy TypesDrugsOutcome
USP1SNVMissense_Mutationc.1516N>Ap.Cys506Serp.C506SO94782protein_codingdeleterious(0)probably_damaging(0.999)TCGA-A2-A04U-01Breastbreast invasive carcinomaFemale<65I/IIChemotherapyadriamycinSD
USP1SNVMissense_Mutationc.1058N>Tp.Ser353Phep.S353FO94782protein_codingdeleterious(0)probably_damaging(1)TCGA-A2-A0YK-01Breastbreast invasive carcinomaFemale<65I/IIChemotherapycytoxanSD
USP1SNVMissense_Mutationnovelc.127C>Gp.Gln43Glup.Q43EO94782protein_codingtolerated(0.18)benign(0.104)TCGA-AC-A3W6-01Breastbreast invasive carcinomaFemale>=65III/IVUnknownUnknownSD
USP1SNVMissense_Mutationrs772351967c.962N>Gp.Tyr321Cysp.Y321CO94782protein_codingtolerated(0.19)benign(0)TCGA-AC-A8OR-01Breastbreast invasive carcinomaFemale>=65I/IIUnknownUnknownSD
USP1SNVMissense_Mutationc.670N>Gp.Lys224Glup.K224EO94782protein_codingtolerated(0.82)benign(0.033)TCGA-AN-A0AL-01Breastbreast invasive carcinomaFemale<65III/IVUnknownUnknownSD
USP1SNVMissense_Mutationc.1881N>Tp.Leu627Phep.L627FO94782protein_codingdeleterious(0.04)benign(0.376)TCGA-BH-A0C0-01Breastbreast invasive carcinomaFemale<65I/IIChemotherapycarboplatinSD
USP1SNVMissense_Mutationnovelc.219G>Cp.Lys73Asnp.K73NO94782protein_codingdeleterious(0.01)probably_damaging(0.997)TCGA-BH-A0DX-01Breastbreast invasive carcinomaFemale<65I/IIChemotherapytaxotereCR
USP1insertionIn_Frame_Insnovelc.395_396insCGTTACTTCCAAp.Asp131_Lys132insAsnValThrSerp.D131_K132insNVTSO94782protein_codingTCGA-AR-A0TU-01Breastbreast invasive carcinomaFemale<65I/IIUnspecificDoxorubicinSD
USP1insertionFrame_Shift_Insnovelc.2072_2073insCTGCAGGTGCCCACCACCACGCCCGGCTAATTTTTTGTATTTTp.Ser692CysfsTer15p.S692Cfs*15O94782protein_codingTCGA-BH-A0HF-01Breastbreast invasive carcinomaFemale>=65I/IIHormone TherapyarimidexSD
USP1SNVMissense_Mutationnovelc.748G>Ap.Glu250Lysp.E250KO94782protein_codingtolerated(0.21)benign(0.341)TCGA-2W-A8YY-01Cervixcervical & endocervical cancerFemale<65I/IIChemotherapycisplatinCR
Page: 1 2 3 4 5 6 7 8 

Top

Related drugs of malignant transformation related genes

check buttonIdentification of chemicals and drugs interact with genes involved in malignant transfromation
(DGIdb 4.0)
Entrez IDSymbolCategoryInteraction TypesDrug Claim NameDrug NamePMIDs
7398USP1DNA REPAIR, PROTEASE, ENZYMEGNF-PF-5510CHEMBL578741
7398USP1DNA REPAIR, PROTEASE, ENZYMECLOFENOXYDECLOFENOXYDE
7398USP1DNA REPAIR, PROTEASE, ENZYMEGW7074CHEMBL72365
7398USP1DNA REPAIR, PROTEASE, ENZYMECETRIMIDECETRIMIDE
7398USP1DNA REPAIR, PROTEASE, ENZYMEBENZIODARONEBENZIODARONE
7398USP1DNA REPAIR, PROTEASE, ENZYMEGNF-PF-4579CHEMBL584626
7398USP1DNA REPAIR, PROTEASE, ENZYMEAMYLMETACRESOLAMYLMETACRESOL
7398USP1DNA REPAIR, PROTEASE, ENZYMEDIHYDROGAMBOGIC ACIDDIHYDROGAMBOGIC ACID
7398USP1DNA REPAIR, PROTEASE, ENZYMEBEXAROTENEBEXAROTENE
7398USP1DNA REPAIR, PROTEASE, ENZYMEDITHIAZANINEDITHIAZANINE
Page: 1 2 3 4 5 6 7 8 9 10 11 12 13 14 15 16 17 18 19 20 21