| Tissue | Expression Dynamics | Abbreviation |
| Breast | 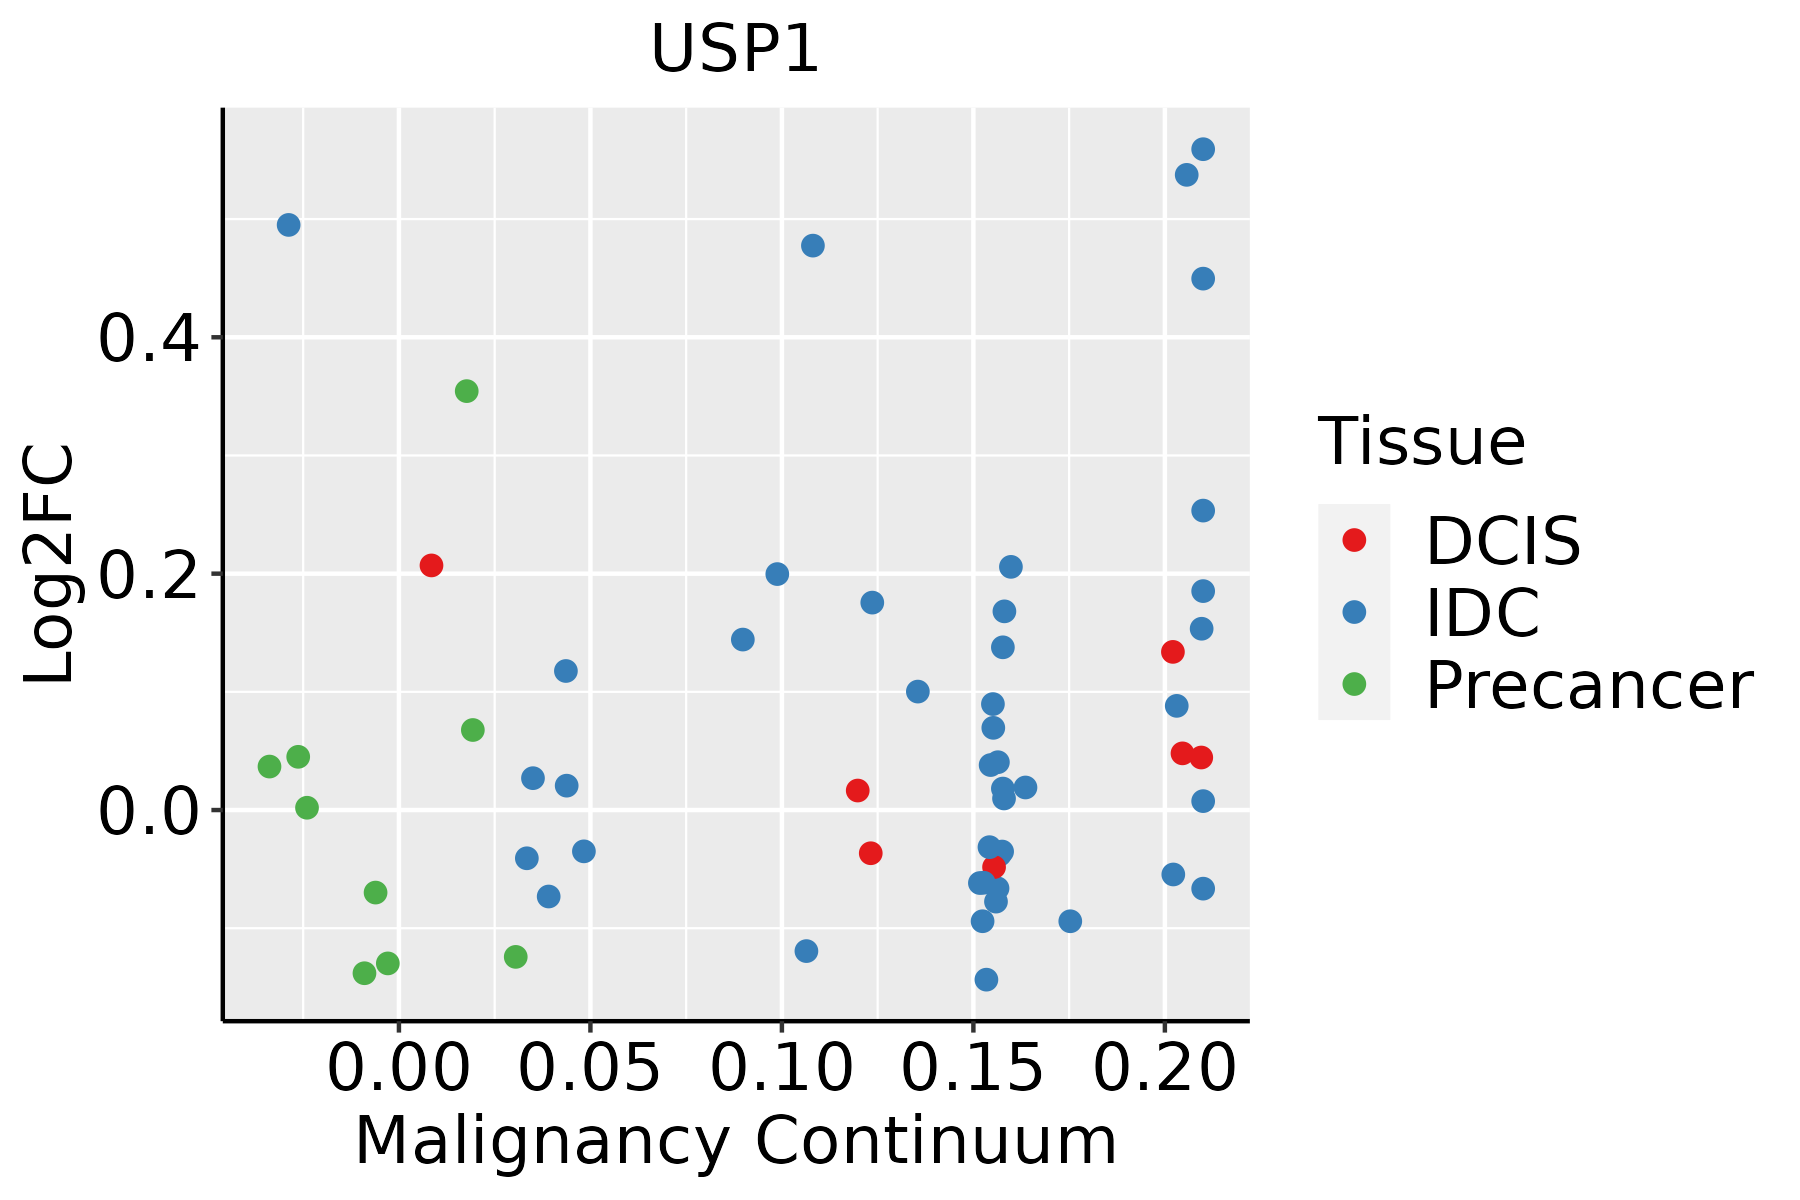 | IDC: Invasive ductal carcinoma |
| DCIS: Ductal carcinoma in situ |
| Precancer(BRCA1-mut): Precancerous lesion from BRCA1 mutation carriers |
| Esophagus | 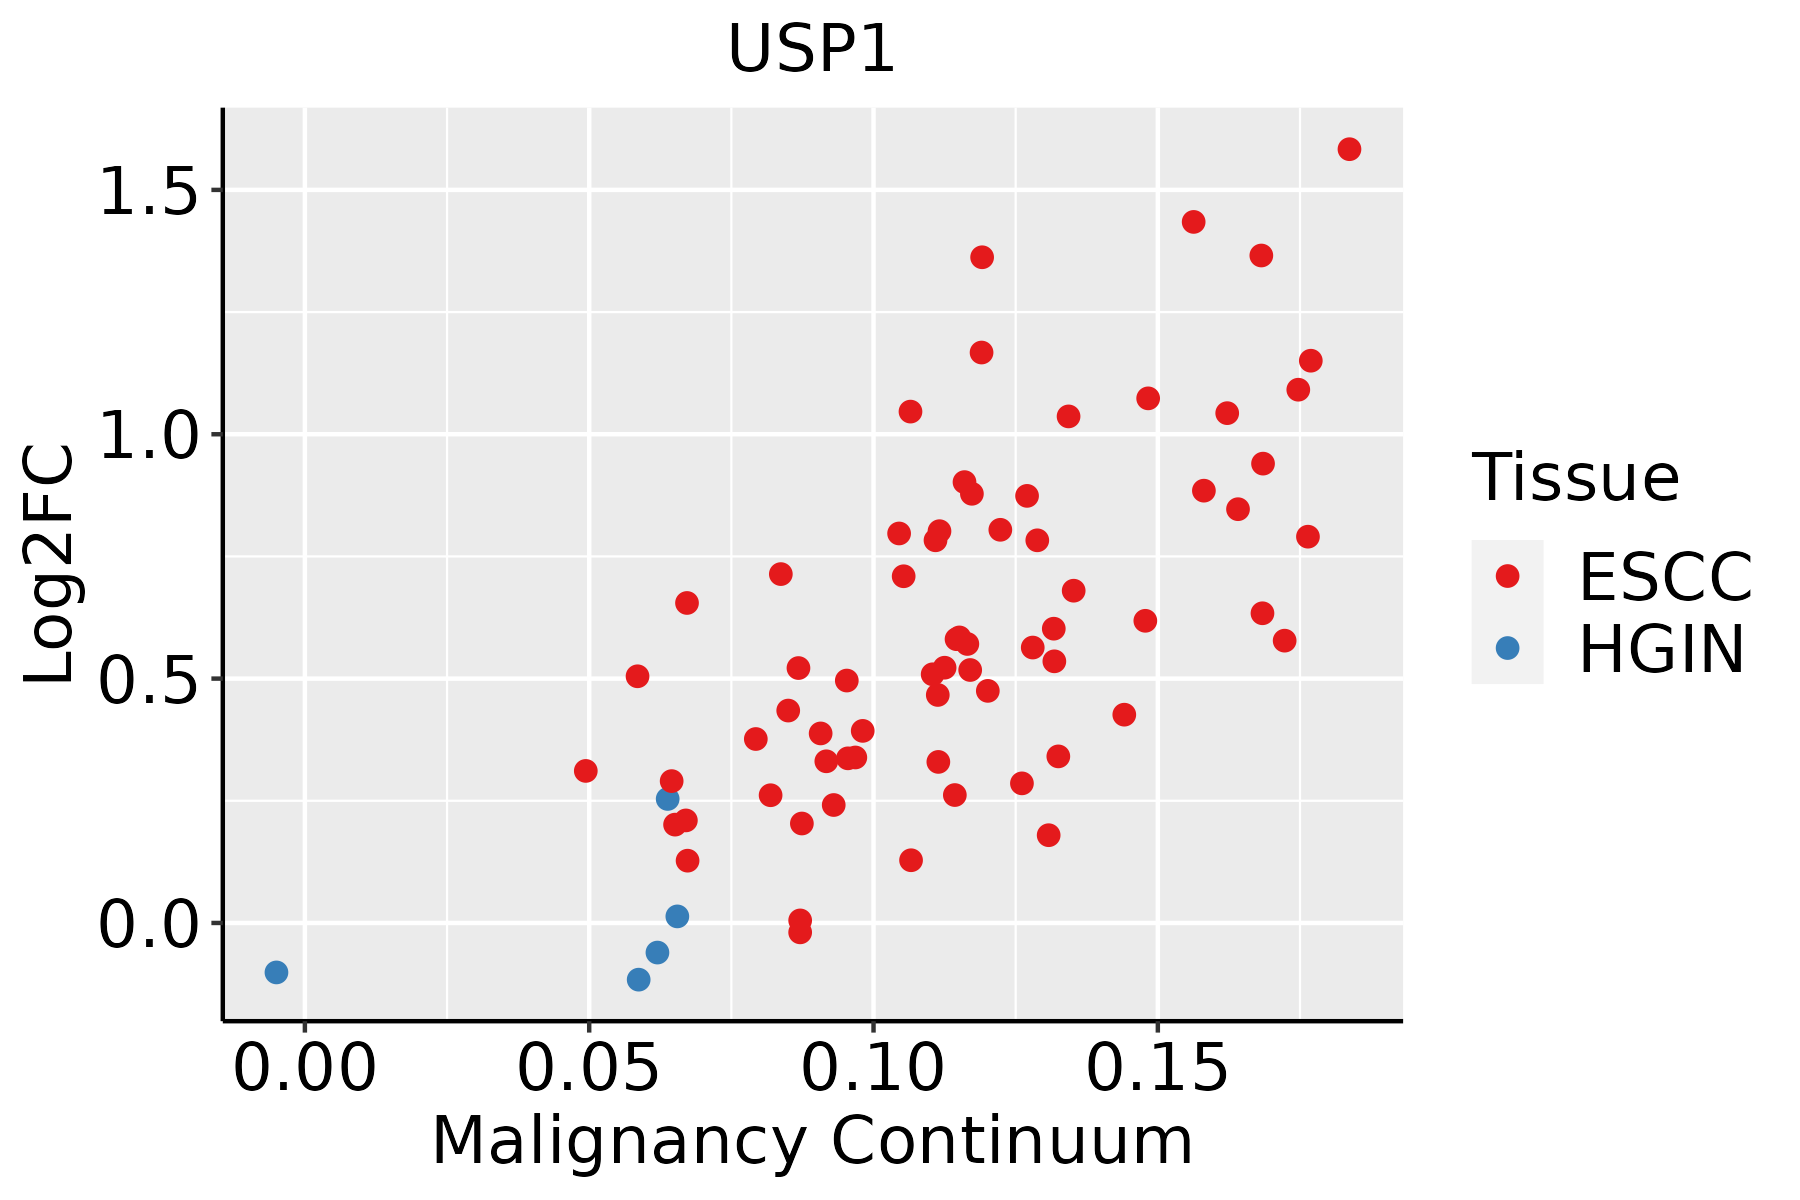 | ESCC: Esophageal squamous cell carcinoma |
| HGIN: High-grade intraepithelial neoplasias |
| LGIN: Low-grade intraepithelial neoplasias |
| Liver | 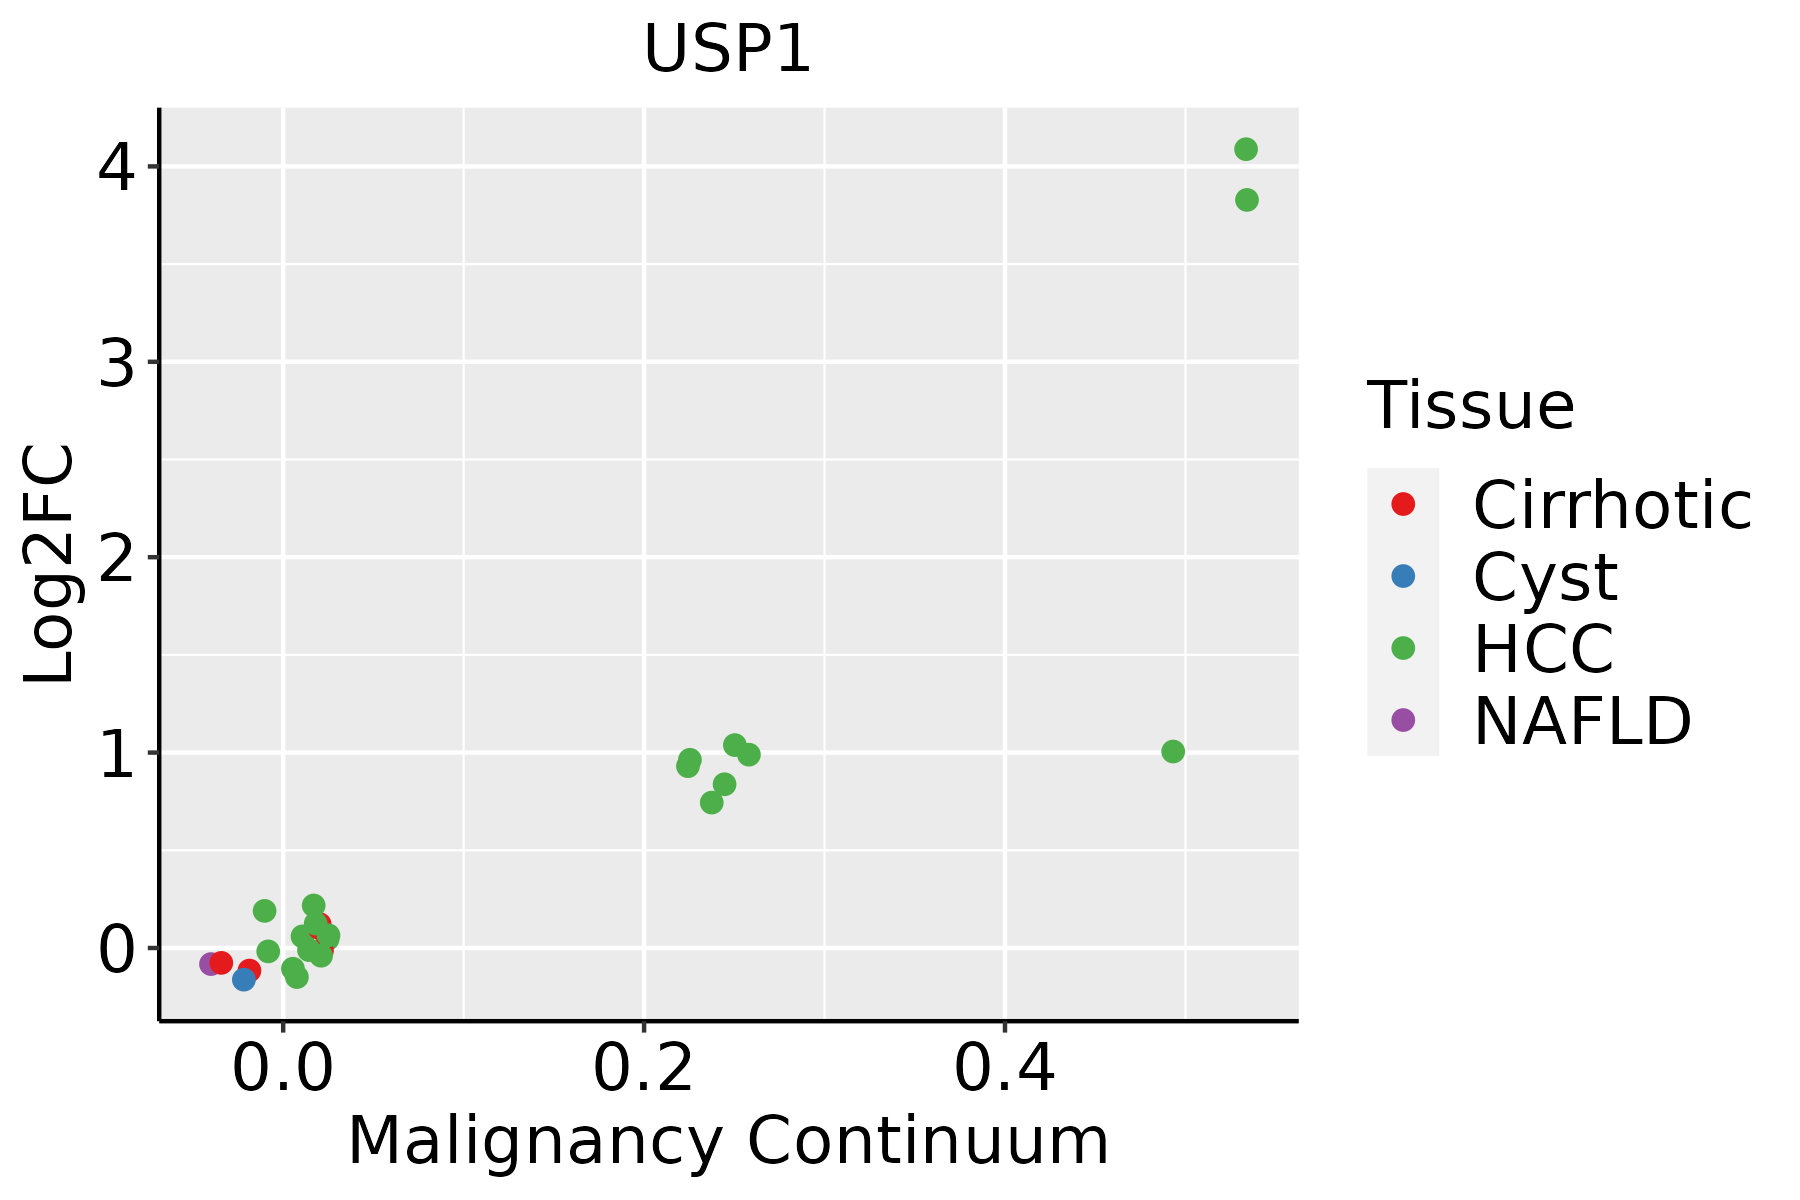 | HCC: Hepatocellular carcinoma |
| NAFLD: Non-alcoholic fatty liver disease |
| Oral Cavity |  | EOLP: Erosive Oral lichen planus |
| LP: leukoplakia |
| NEOLP: Non-erosive oral lichen planus |
| OSCC: Oral squamous cell carcinoma |
| Skin | 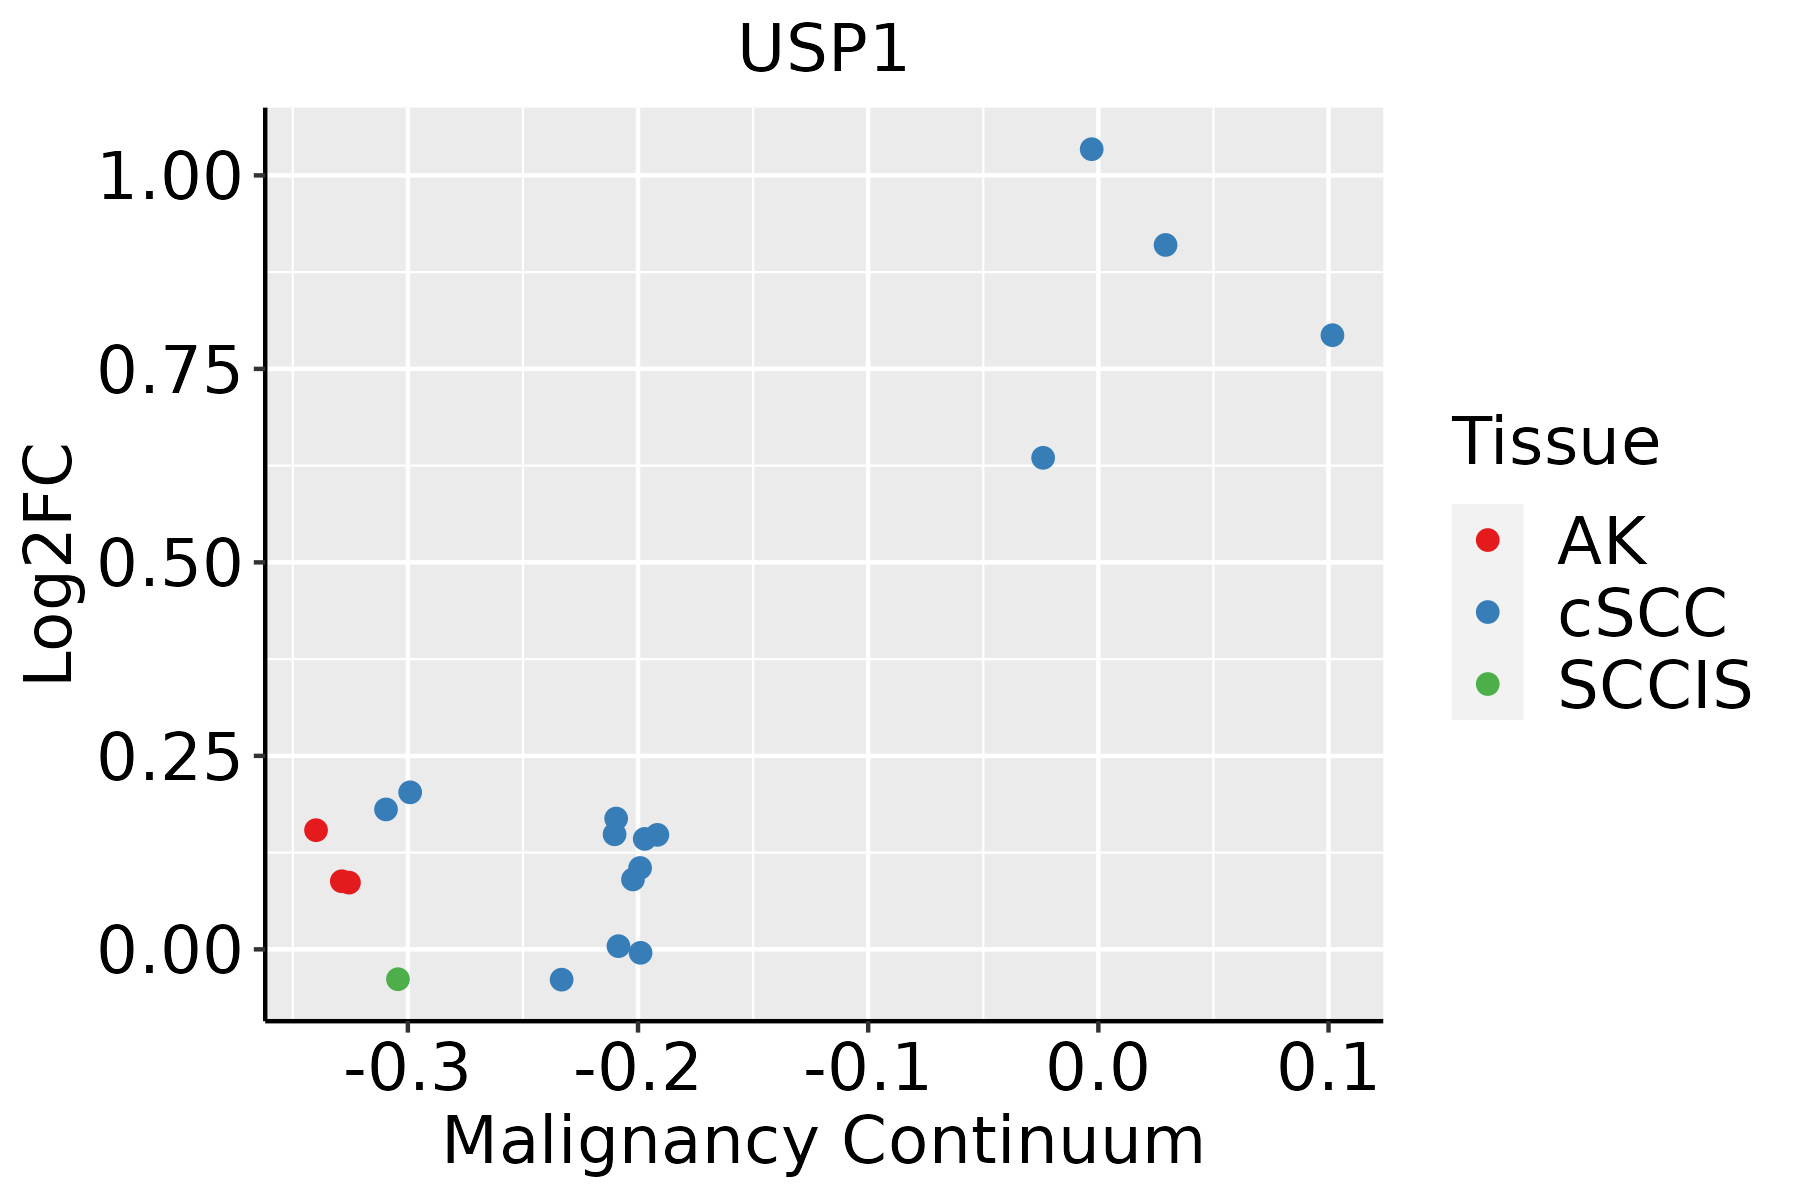 | AK: Actinic keratosis |
| cSCC: Cutaneous squamous cell carcinoma |
| SCCIS:squamous cell carcinoma in situ |
| Thyroid |  | ATC: Anaplastic thyroid cancer |
| HT: Hashimoto's thyroiditis |
| PTC: Papillary thyroid cancer |
| GO ID | Tissue | Disease Stage | Description | Gene Ratio | Bg Ratio | pvalue | p.adjust | Count |
| GO:000691316 | Prostate | Tumor | nucleocytoplasmic transport | 97/3246 | 301/18723 | 1.78e-10 | 1.05e-08 | 97 |
| GO:005116916 | Prostate | Tumor | nuclear transport | 97/3246 | 301/18723 | 1.78e-10 | 1.05e-08 | 97 |
| GO:190165418 | Prostate | Tumor | response to ketone | 70/3246 | 194/18723 | 2.69e-10 | 1.48e-08 | 70 |
| GO:004254218 | Prostate | Tumor | response to hydrogen peroxide | 57/3246 | 146/18723 | 3.91e-10 | 2.06e-08 | 57 |
| GO:005254819 | Prostate | Tumor | regulation of endopeptidase activity | 126/3246 | 432/18723 | 5.86e-10 | 3.01e-08 | 126 |
| GO:000030219 | Prostate | Tumor | response to reactive oxygen species | 76/3246 | 222/18723 | 7.85e-10 | 3.84e-08 | 76 |
| GO:004217718 | Prostate | Tumor | negative regulation of protein catabolic process | 49/3246 | 121/18723 | 1.53e-09 | 7.19e-08 | 49 |
| GO:004232618 | Prostate | Tumor | negative regulation of phosphorylation | 112/3246 | 385/18723 | 6.17e-09 | 2.42e-07 | 112 |
| GO:004593619 | Prostate | Tumor | negative regulation of phosphate metabolic process | 124/3246 | 441/18723 | 9.08e-09 | 3.44e-07 | 124 |
| GO:001056319 | Prostate | Tumor | negative regulation of phosphorus metabolic process | 124/3246 | 442/18723 | 1.05e-08 | 3.88e-07 | 124 |
| GO:000989518 | Prostate | Tumor | negative regulation of catabolic process | 96/3246 | 320/18723 | 1.40e-08 | 5.07e-07 | 96 |
| GO:001003819 | Prostate | Tumor | response to metal ion | 107/3246 | 373/18723 | 3.02e-08 | 9.77e-07 | 107 |
| GO:004586119 | Prostate | Tumor | negative regulation of proteolysis | 102/3246 | 351/18723 | 3.09e-08 | 9.94e-07 | 102 |
| GO:003133019 | Prostate | Tumor | negative regulation of cellular catabolic process | 81/3246 | 262/18723 | 4.42e-08 | 1.37e-06 | 81 |
| GO:001657013 | Prostate | Tumor | histone modification | 126/3246 | 463/18723 | 5.51e-08 | 1.65e-06 | 126 |
| GO:190589719 | Prostate | Tumor | regulation of response to endoplasmic reticulum stress | 35/3246 | 82/18723 | 6.76e-08 | 1.95e-06 | 35 |
| GO:003196017 | Prostate | Tumor | response to corticosteroid | 57/3246 | 167/18723 | 1.11e-07 | 2.94e-06 | 57 |
| GO:005134819 | Prostate | Tumor | negative regulation of transferase activity | 81/3246 | 268/18723 | 1.30e-07 | 3.35e-06 | 81 |
| GO:005138417 | Prostate | Tumor | response to glucocorticoid | 52/3246 | 148/18723 | 1.38e-07 | 3.50e-06 | 52 |
| GO:200005918 | Prostate | Tumor | negative regulation of ubiquitin-dependent protein catabolic process | 24/3246 | 48/18723 | 2.17e-07 | 5.26e-06 | 24 |
| Hugo Symbol | Variant Class | Variant Classification | dbSNP RS | HGVSc | HGVSp | HGVSp Short | SWISSPROT | BIOTYPE | SIFT | PolyPhen | Tumor Sample Barcode | Tissue | Histology | Sex | Age | Stage | Therapy Types | Drugs | Outcome |
| USP1 | SNV | Missense_Mutation | | c.1516N>A | p.Cys506Ser | p.C506S | O94782 | protein_coding | deleterious(0) | probably_damaging(0.999) | TCGA-A2-A04U-01 | Breast | breast invasive carcinoma | Female | <65 | I/II | Chemotherapy | adriamycin | SD |
| USP1 | SNV | Missense_Mutation | | c.1058N>T | p.Ser353Phe | p.S353F | O94782 | protein_coding | deleterious(0) | probably_damaging(1) | TCGA-A2-A0YK-01 | Breast | breast invasive carcinoma | Female | <65 | I/II | Chemotherapy | cytoxan | SD |
| USP1 | SNV | Missense_Mutation | novel | c.127C>G | p.Gln43Glu | p.Q43E | O94782 | protein_coding | tolerated(0.18) | benign(0.104) | TCGA-AC-A3W6-01 | Breast | breast invasive carcinoma | Female | >=65 | III/IV | Unknown | Unknown | SD |
| USP1 | SNV | Missense_Mutation | rs772351967 | c.962N>G | p.Tyr321Cys | p.Y321C | O94782 | protein_coding | tolerated(0.19) | benign(0) | TCGA-AC-A8OR-01 | Breast | breast invasive carcinoma | Female | >=65 | I/II | Unknown | Unknown | SD |
| USP1 | SNV | Missense_Mutation | | c.670N>G | p.Lys224Glu | p.K224E | O94782 | protein_coding | tolerated(0.82) | benign(0.033) | TCGA-AN-A0AL-01 | Breast | breast invasive carcinoma | Female | <65 | III/IV | Unknown | Unknown | SD |
| USP1 | SNV | Missense_Mutation | | c.1881N>T | p.Leu627Phe | p.L627F | O94782 | protein_coding | deleterious(0.04) | benign(0.376) | TCGA-BH-A0C0-01 | Breast | breast invasive carcinoma | Female | <65 | I/II | Chemotherapy | carboplatin | SD |
| USP1 | SNV | Missense_Mutation | novel | c.219G>C | p.Lys73Asn | p.K73N | O94782 | protein_coding | deleterious(0.01) | probably_damaging(0.997) | TCGA-BH-A0DX-01 | Breast | breast invasive carcinoma | Female | <65 | I/II | Chemotherapy | taxotere | CR |
| USP1 | insertion | In_Frame_Ins | novel | c.395_396insCGTTACTTCCAA | p.Asp131_Lys132insAsnValThrSer | p.D131_K132insNVTS | O94782 | protein_coding | | | TCGA-AR-A0TU-01 | Breast | breast invasive carcinoma | Female | <65 | I/II | Unspecific | Doxorubicin | SD |
| USP1 | insertion | Frame_Shift_Ins | novel | c.2072_2073insCTGCAGGTGCCCACCACCACGCCCGGCTAATTTTTTGTATTTT | p.Ser692CysfsTer15 | p.S692Cfs*15 | O94782 | protein_coding | | | TCGA-BH-A0HF-01 | Breast | breast invasive carcinoma | Female | >=65 | I/II | Hormone Therapy | arimidex | SD |
| USP1 | SNV | Missense_Mutation | novel | c.748G>A | p.Glu250Lys | p.E250K | O94782 | protein_coding | tolerated(0.21) | benign(0.341) | TCGA-2W-A8YY-01 | Cervix | cervical & endocervical cancer | Female | <65 | I/II | Chemotherapy | cisplatin | CR |
| Entrez ID | Symbol | Category | Interaction Types | Drug Claim Name | Drug Name | PMIDs |
| 7398 | USP1 | DNA REPAIR, PROTEASE, ENZYME | | GNF-PF-5510 | CHEMBL578741 | |
| 7398 | USP1 | DNA REPAIR, PROTEASE, ENZYME | | CLOFENOXYDE | CLOFENOXYDE | |
| 7398 | USP1 | DNA REPAIR, PROTEASE, ENZYME | | GW7074 | CHEMBL72365 | |
| 7398 | USP1 | DNA REPAIR, PROTEASE, ENZYME | | CETRIMIDE | CETRIMIDE | |
| 7398 | USP1 | DNA REPAIR, PROTEASE, ENZYME | | BENZIODARONE | BENZIODARONE | |
| 7398 | USP1 | DNA REPAIR, PROTEASE, ENZYME | | GNF-PF-4579 | CHEMBL584626 | |
| 7398 | USP1 | DNA REPAIR, PROTEASE, ENZYME | | AMYLMETACRESOL | AMYLMETACRESOL | |
| 7398 | USP1 | DNA REPAIR, PROTEASE, ENZYME | | DIHYDROGAMBOGIC ACID | DIHYDROGAMBOGIC ACID | |
| 7398 | USP1 | DNA REPAIR, PROTEASE, ENZYME | | BEXAROTENE | BEXAROTENE | |
| 7398 | USP1 | DNA REPAIR, PROTEASE, ENZYME | | DITHIAZANINE | DITHIAZANINE | |


