| Tissue | Expression Dynamics | Abbreviation |
| Breast | 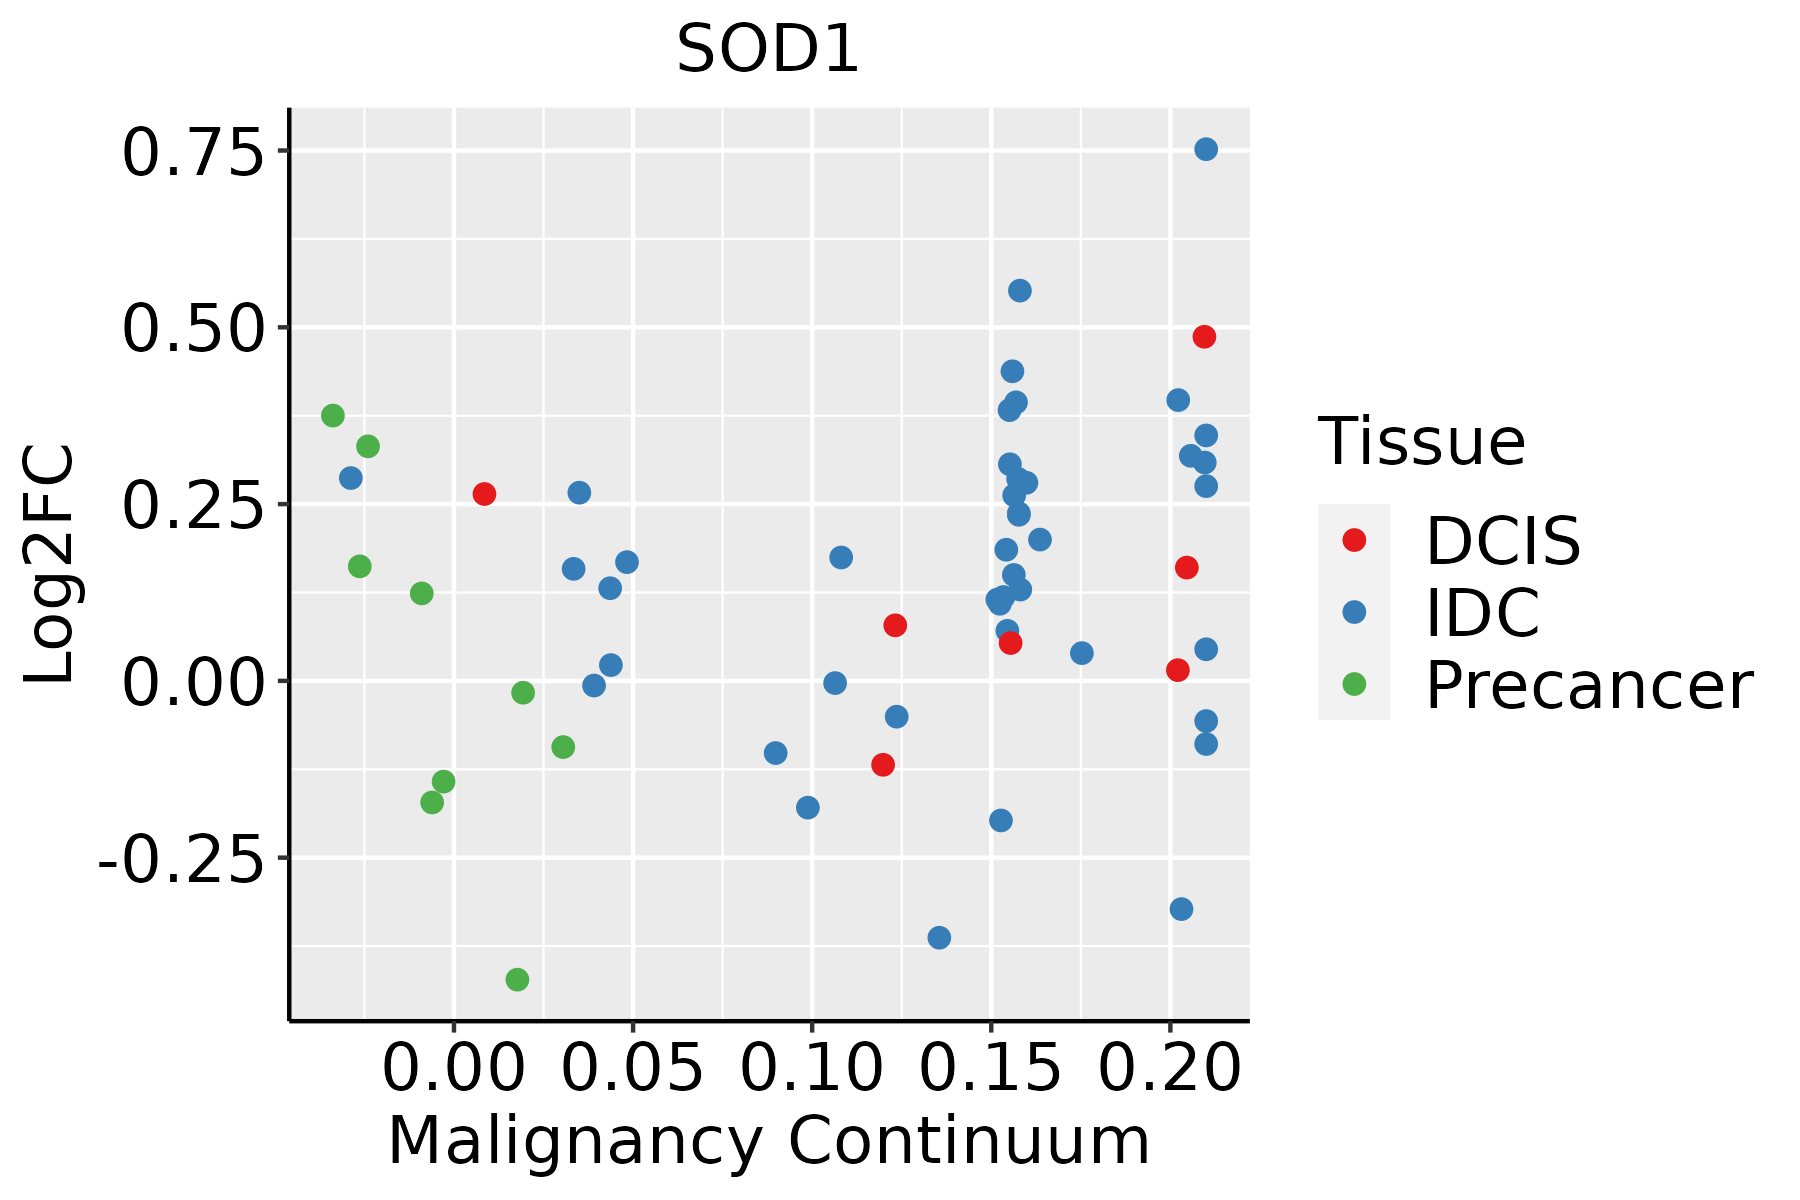 | IDC: Invasive ductal carcinoma |
| DCIS: Ductal carcinoma in situ |
| Precancer(BRCA1-mut): Precancerous lesion from BRCA1 mutation carriers |
| Cervix |  | CC: Cervix cancer |
| HSIL_HPV: HPV-infected high-grade squamous intraepithelial lesions |
| N_HPV: HPV-infected normal cervix |
| Colorectum (GSE201348) |  | FAP: Familial adenomatous polyposis |
| CRC: Colorectal cancer |
| Colorectum (HTA11) | 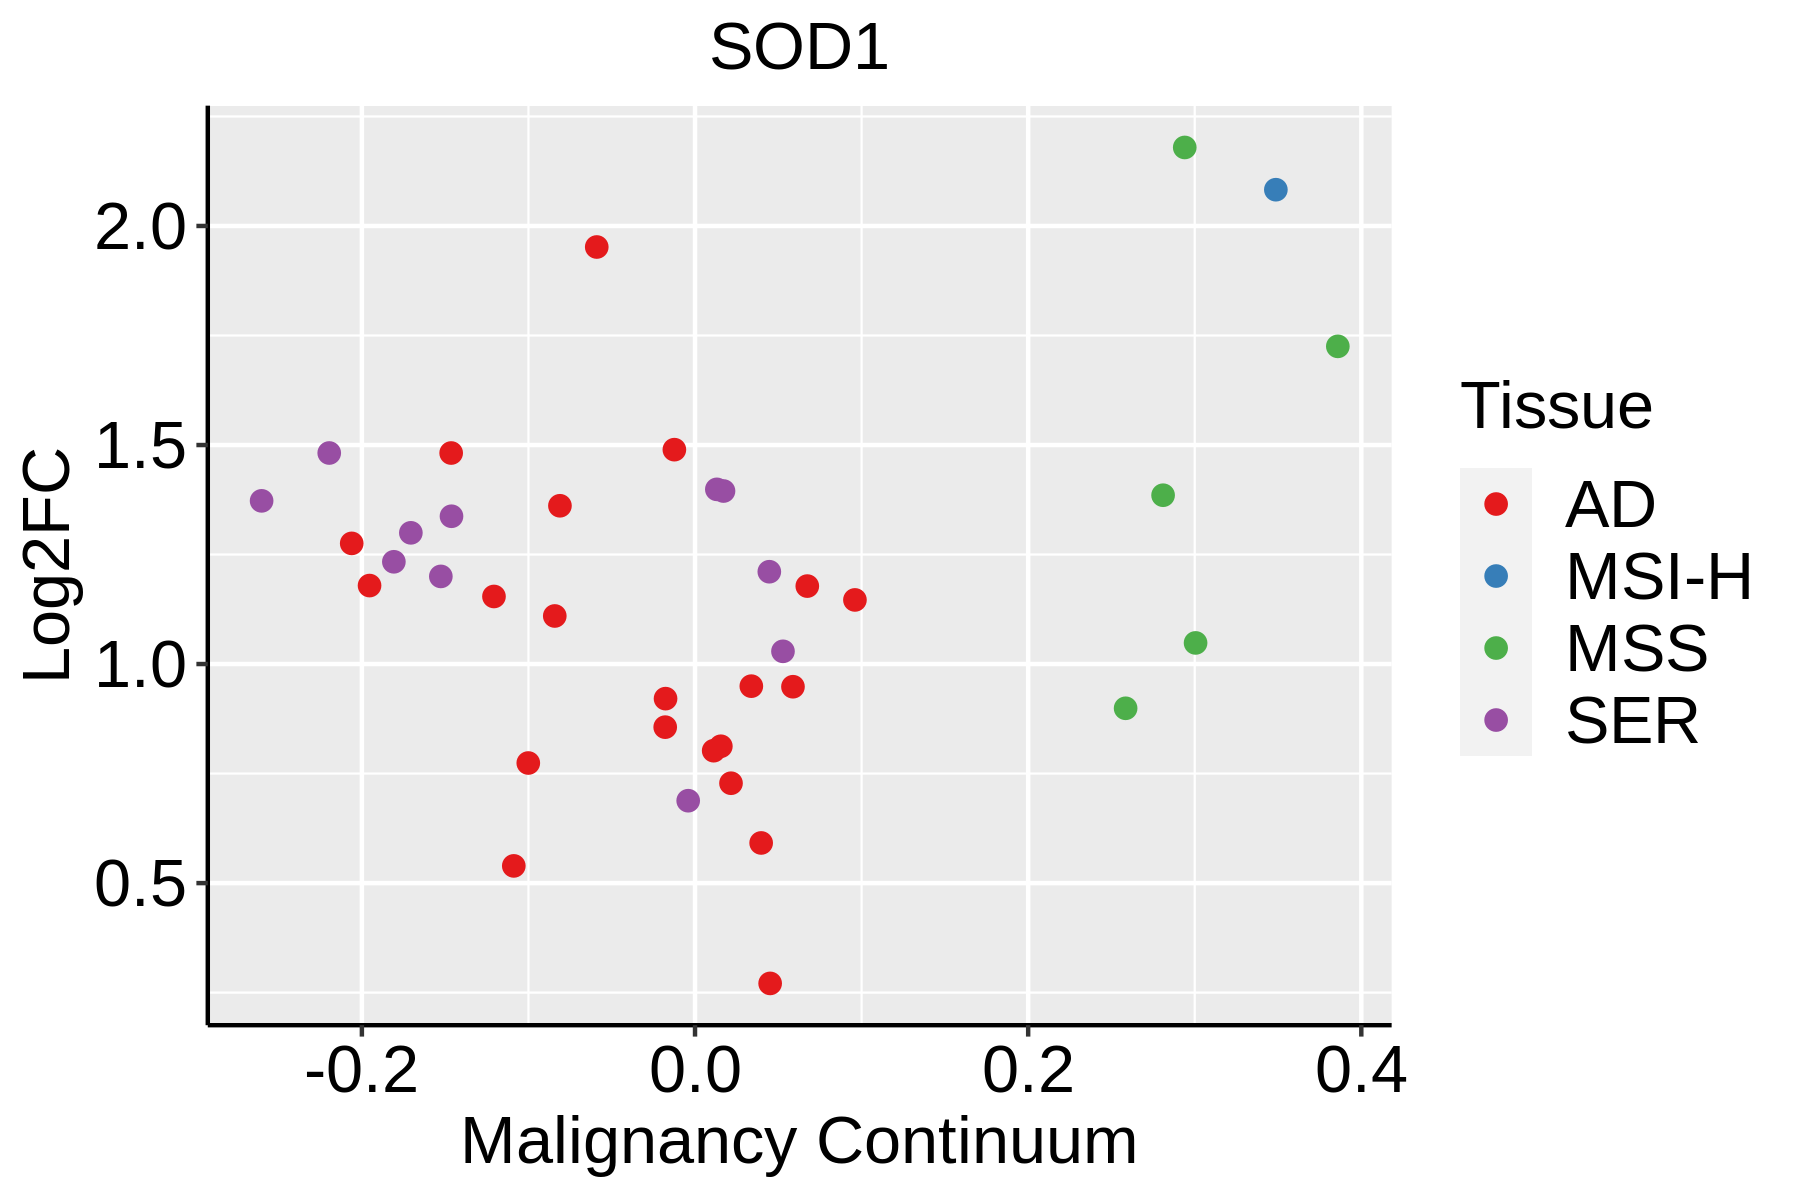 | AD: Adenomas |
| SER: Sessile serrated lesions |
| MSI-H: Microsatellite-high colorectal cancer |
| MSS: Microsatellite stable colorectal cancer |
| Endometrium | 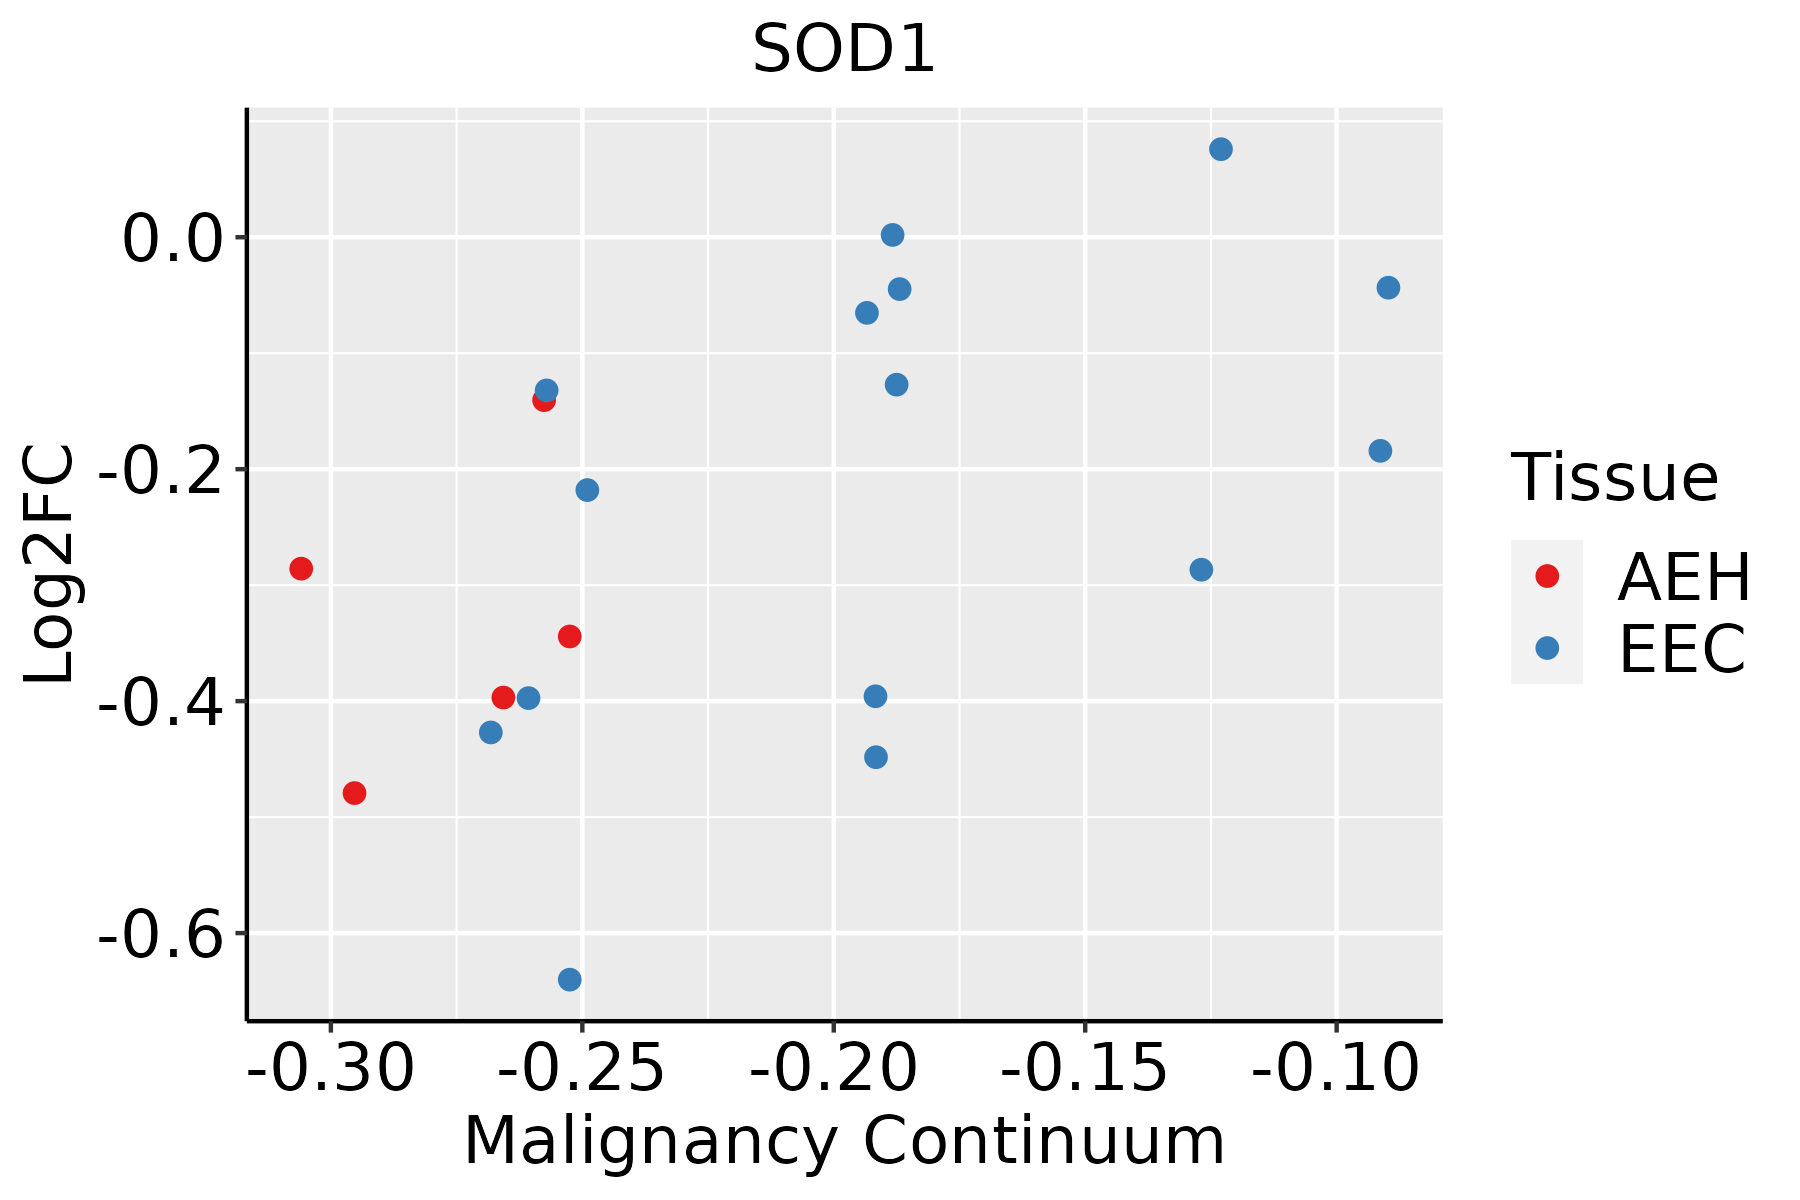 | AEH: Atypical endometrial hyperplasia |
| EEC: Endometrioid Cancer |
| Esophagus | 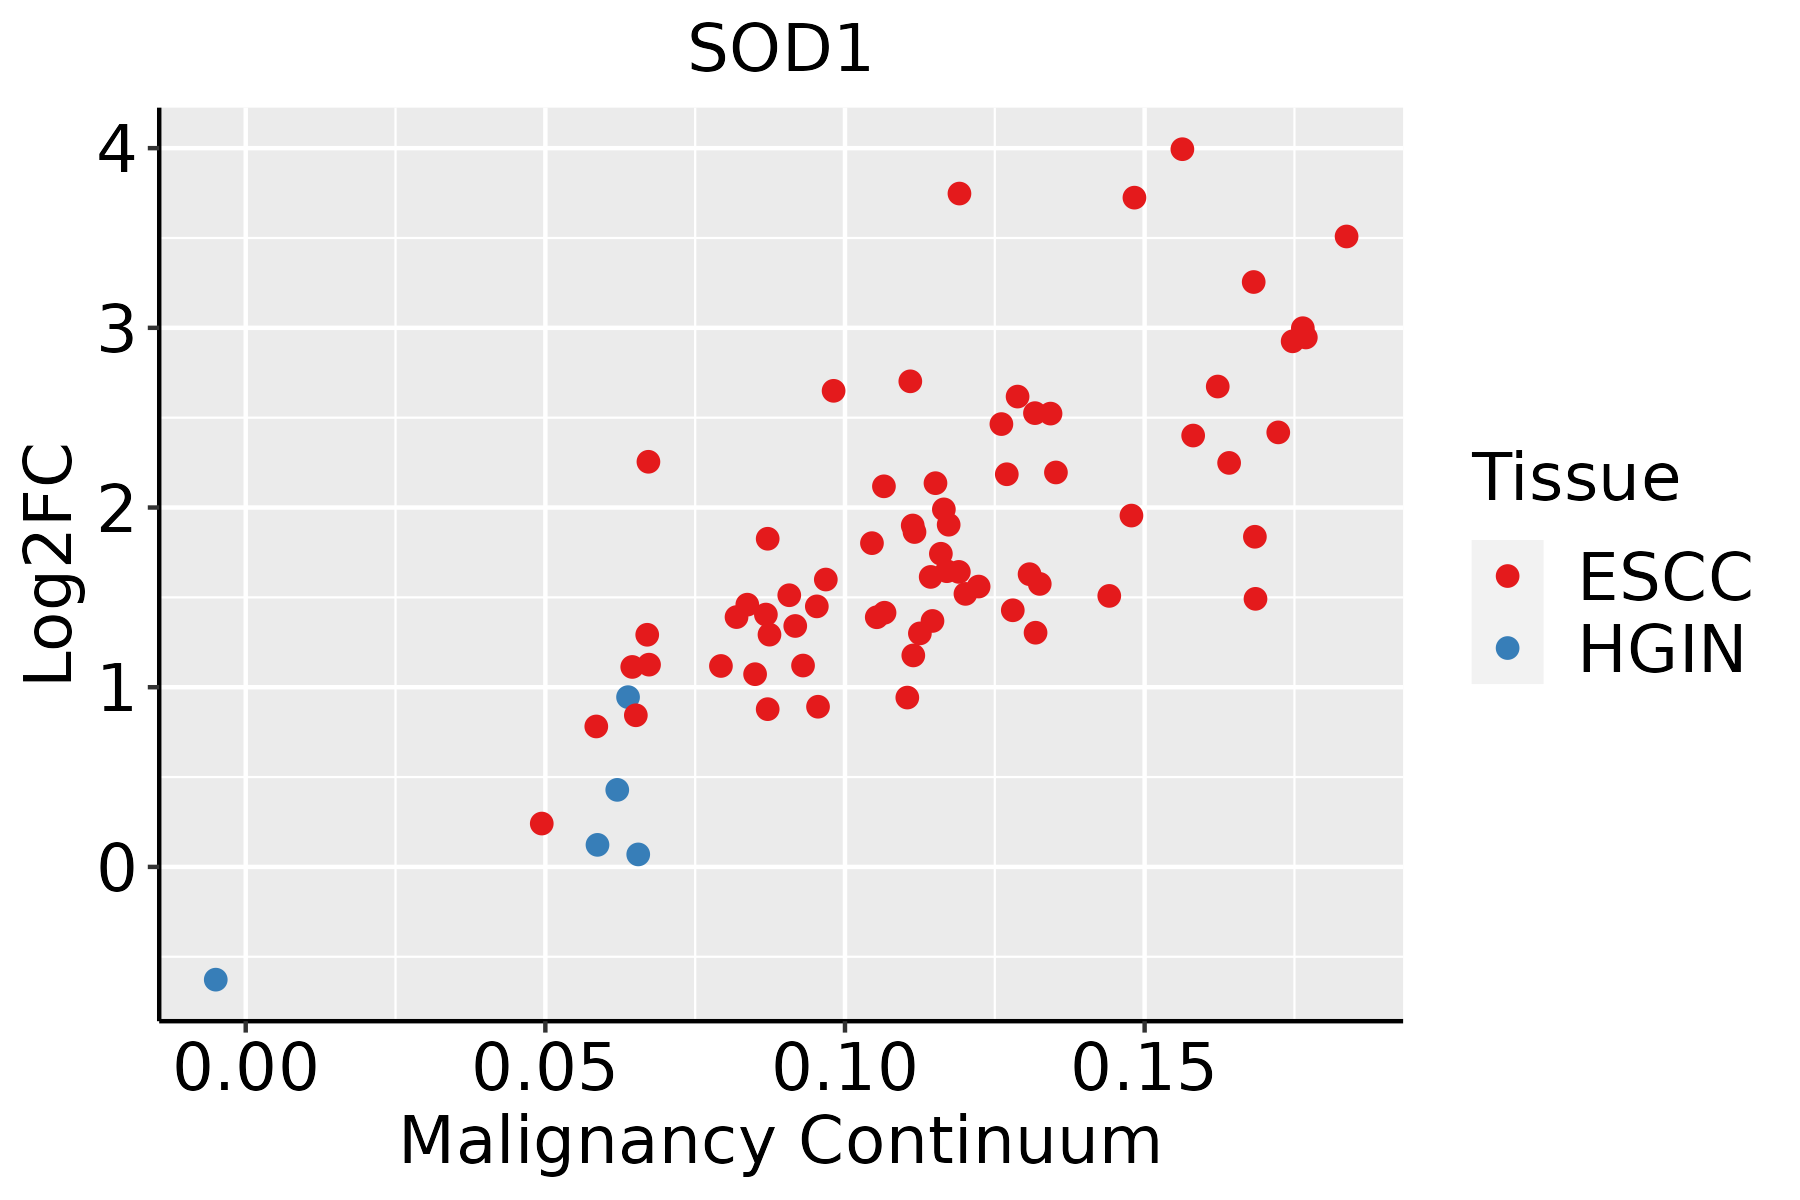 | ESCC: Esophageal squamous cell carcinoma |
| HGIN: High-grade intraepithelial neoplasias |
| LGIN: Low-grade intraepithelial neoplasias |
| Liver | 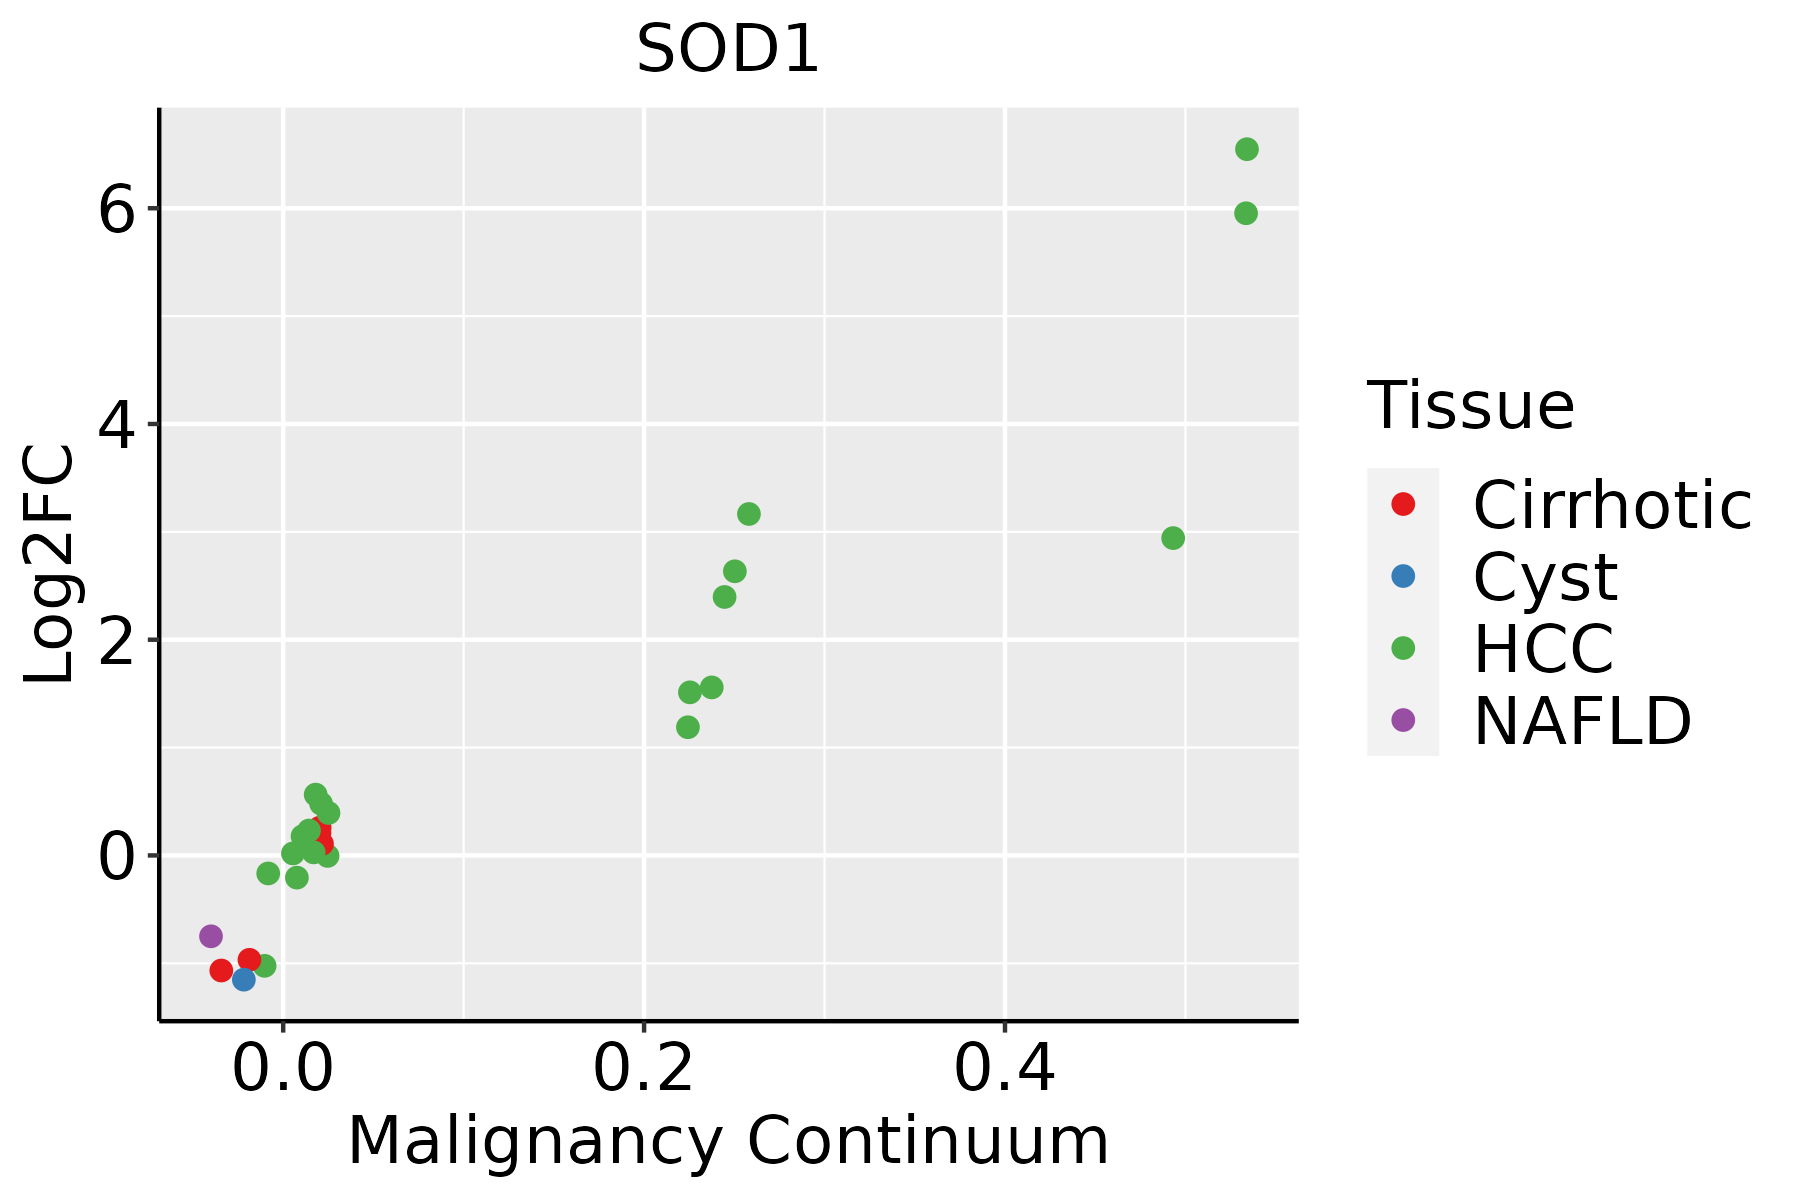 | HCC: Hepatocellular carcinoma |
| NAFLD: Non-alcoholic fatty liver disease |
| Oral Cavity | 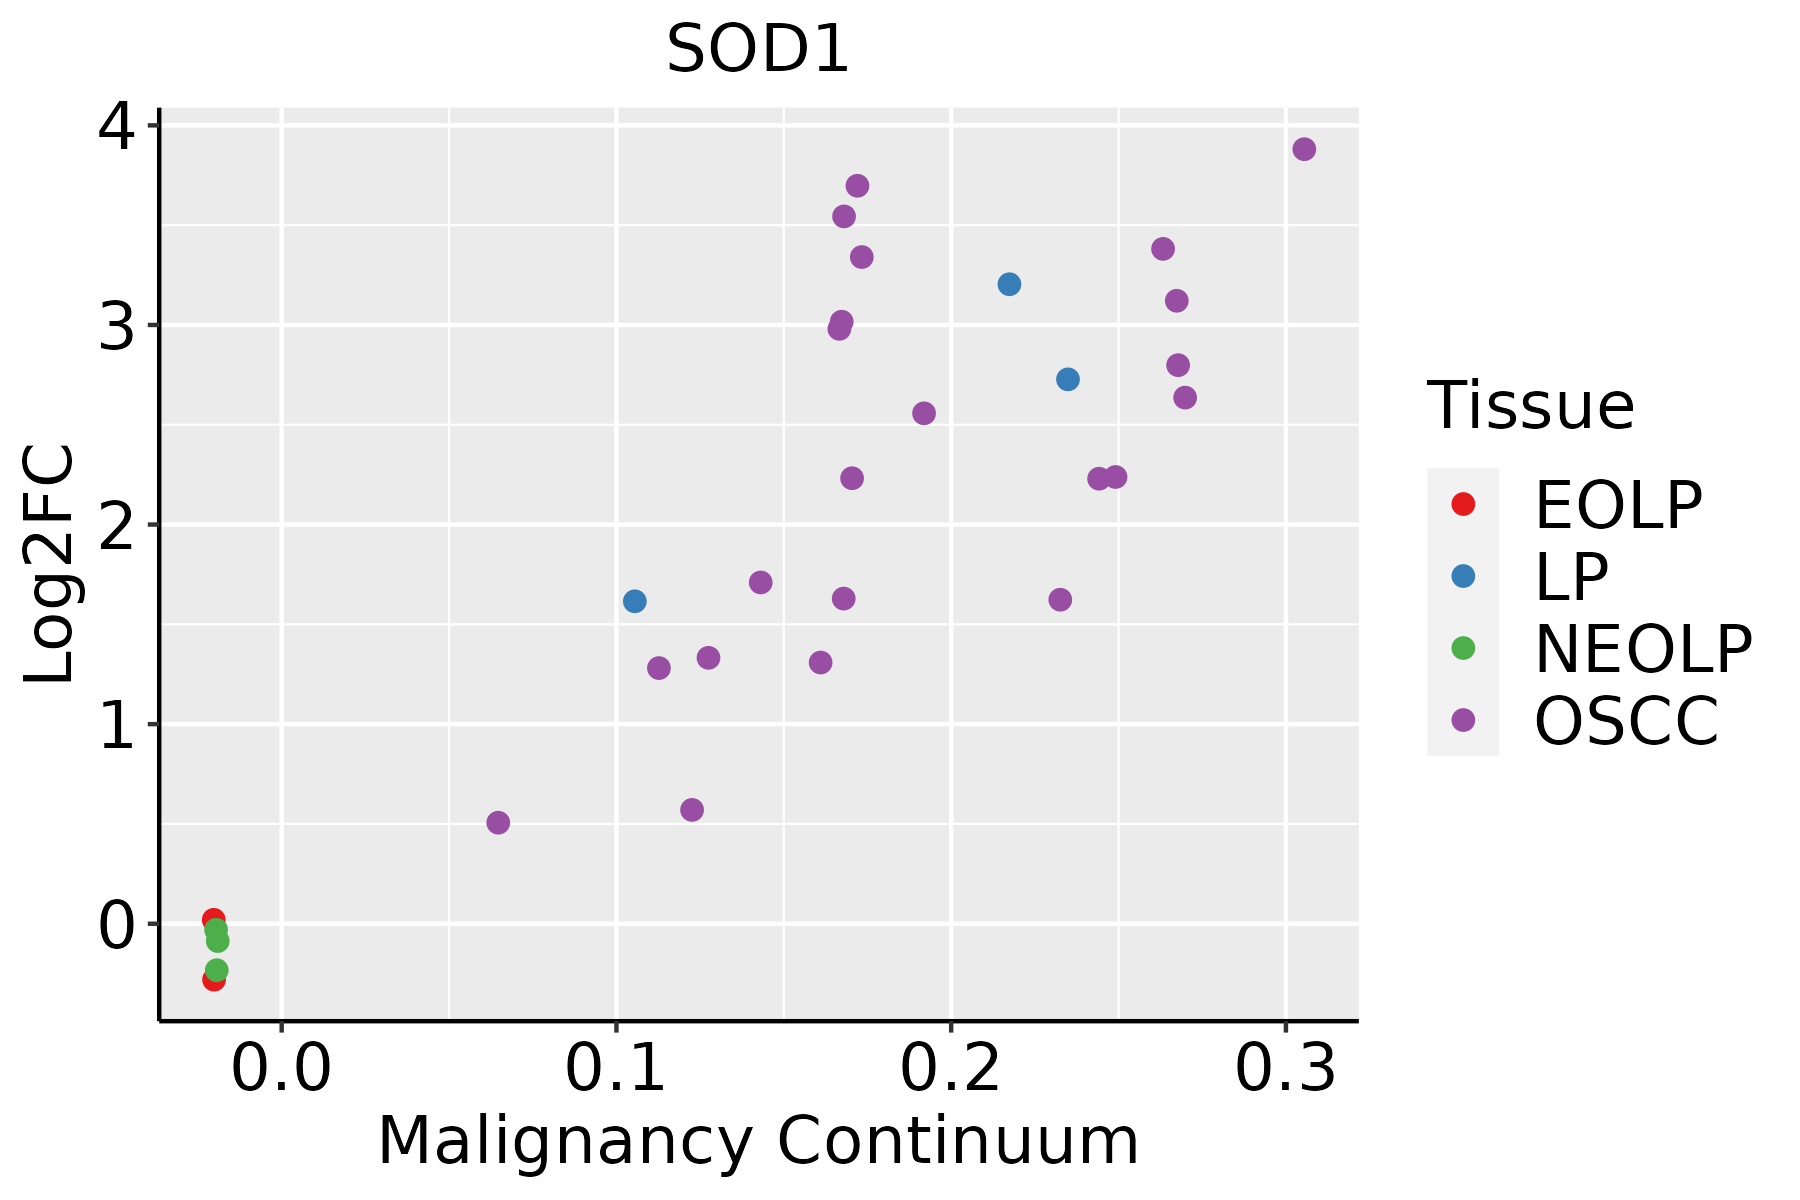 | EOLP: Erosive Oral lichen planus |
| LP: leukoplakia |
| NEOLP: Non-erosive oral lichen planus |
| OSCC: Oral squamous cell carcinoma |
| Prostate | 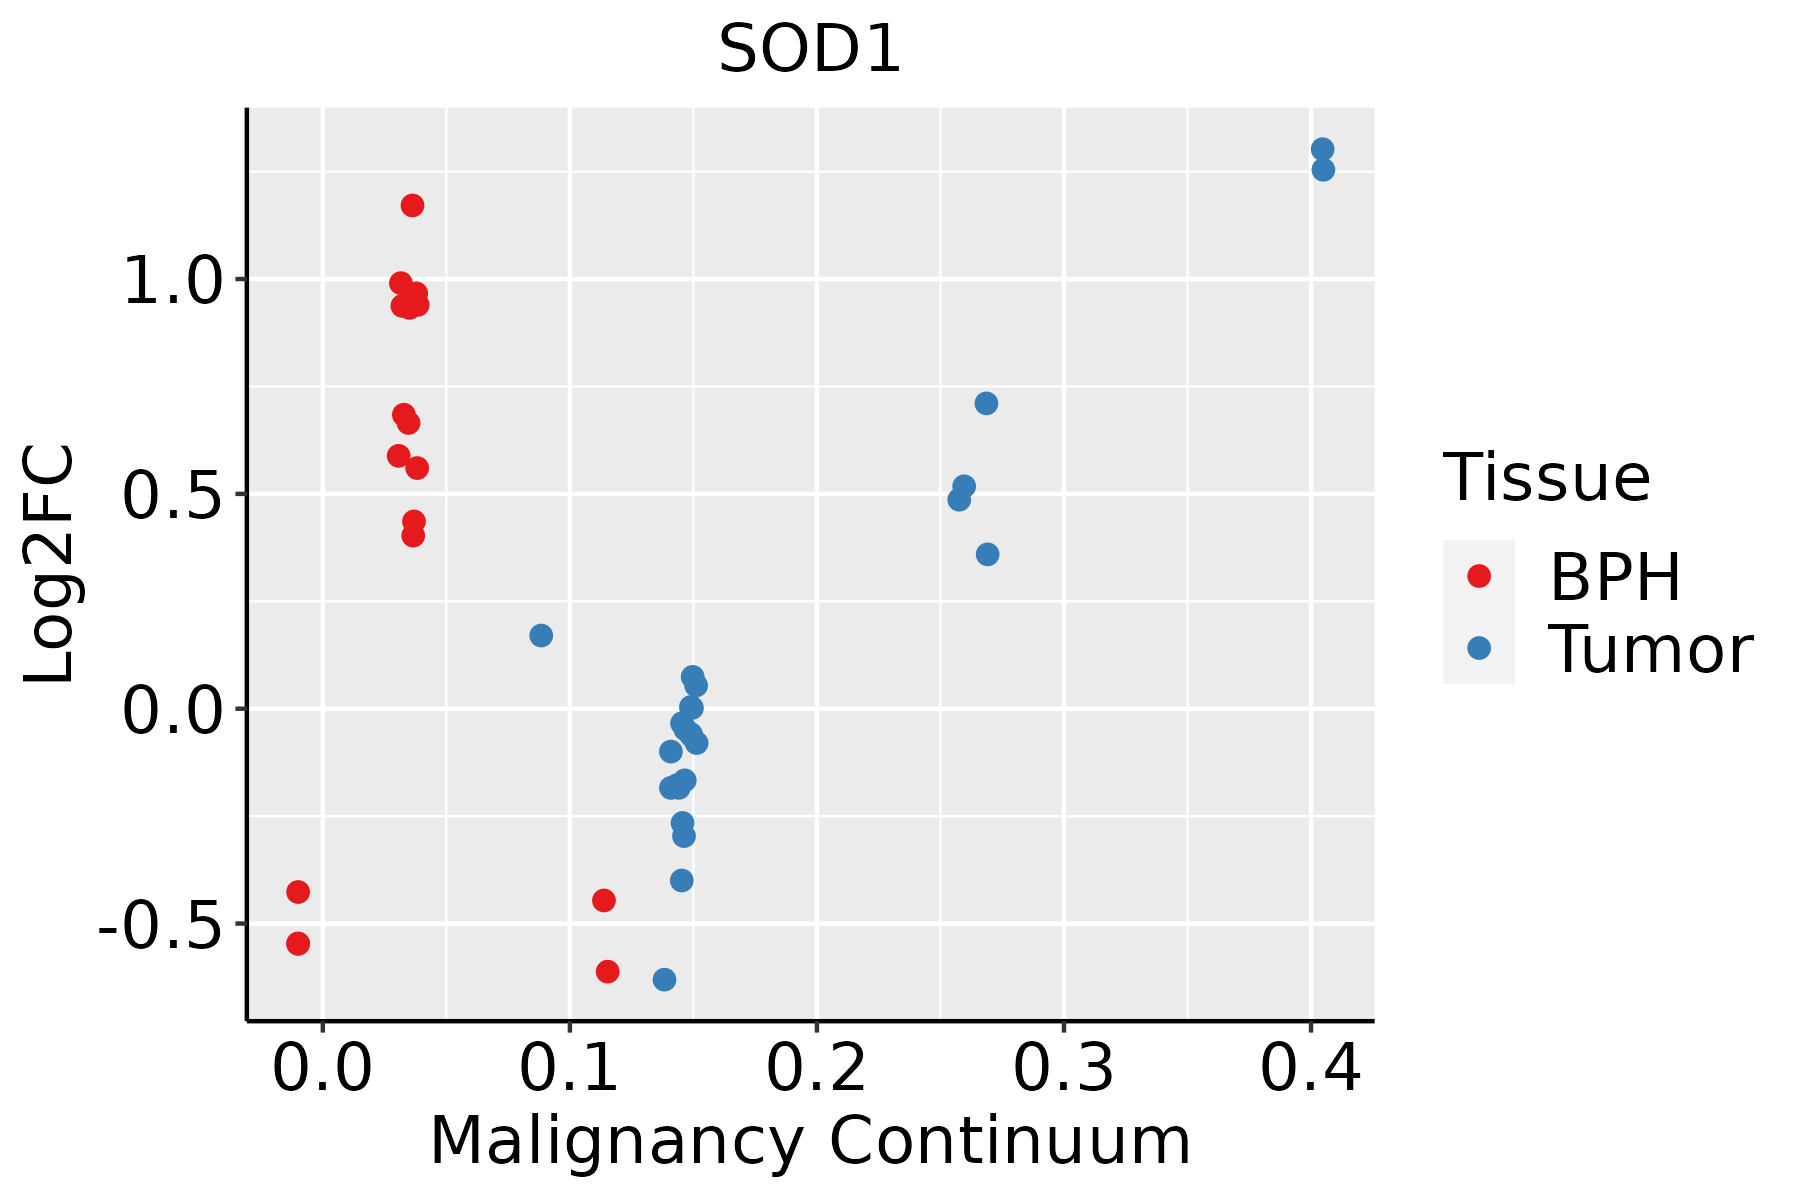 | BPH: Benign Prostatic Hyperplasia |
| Skin | 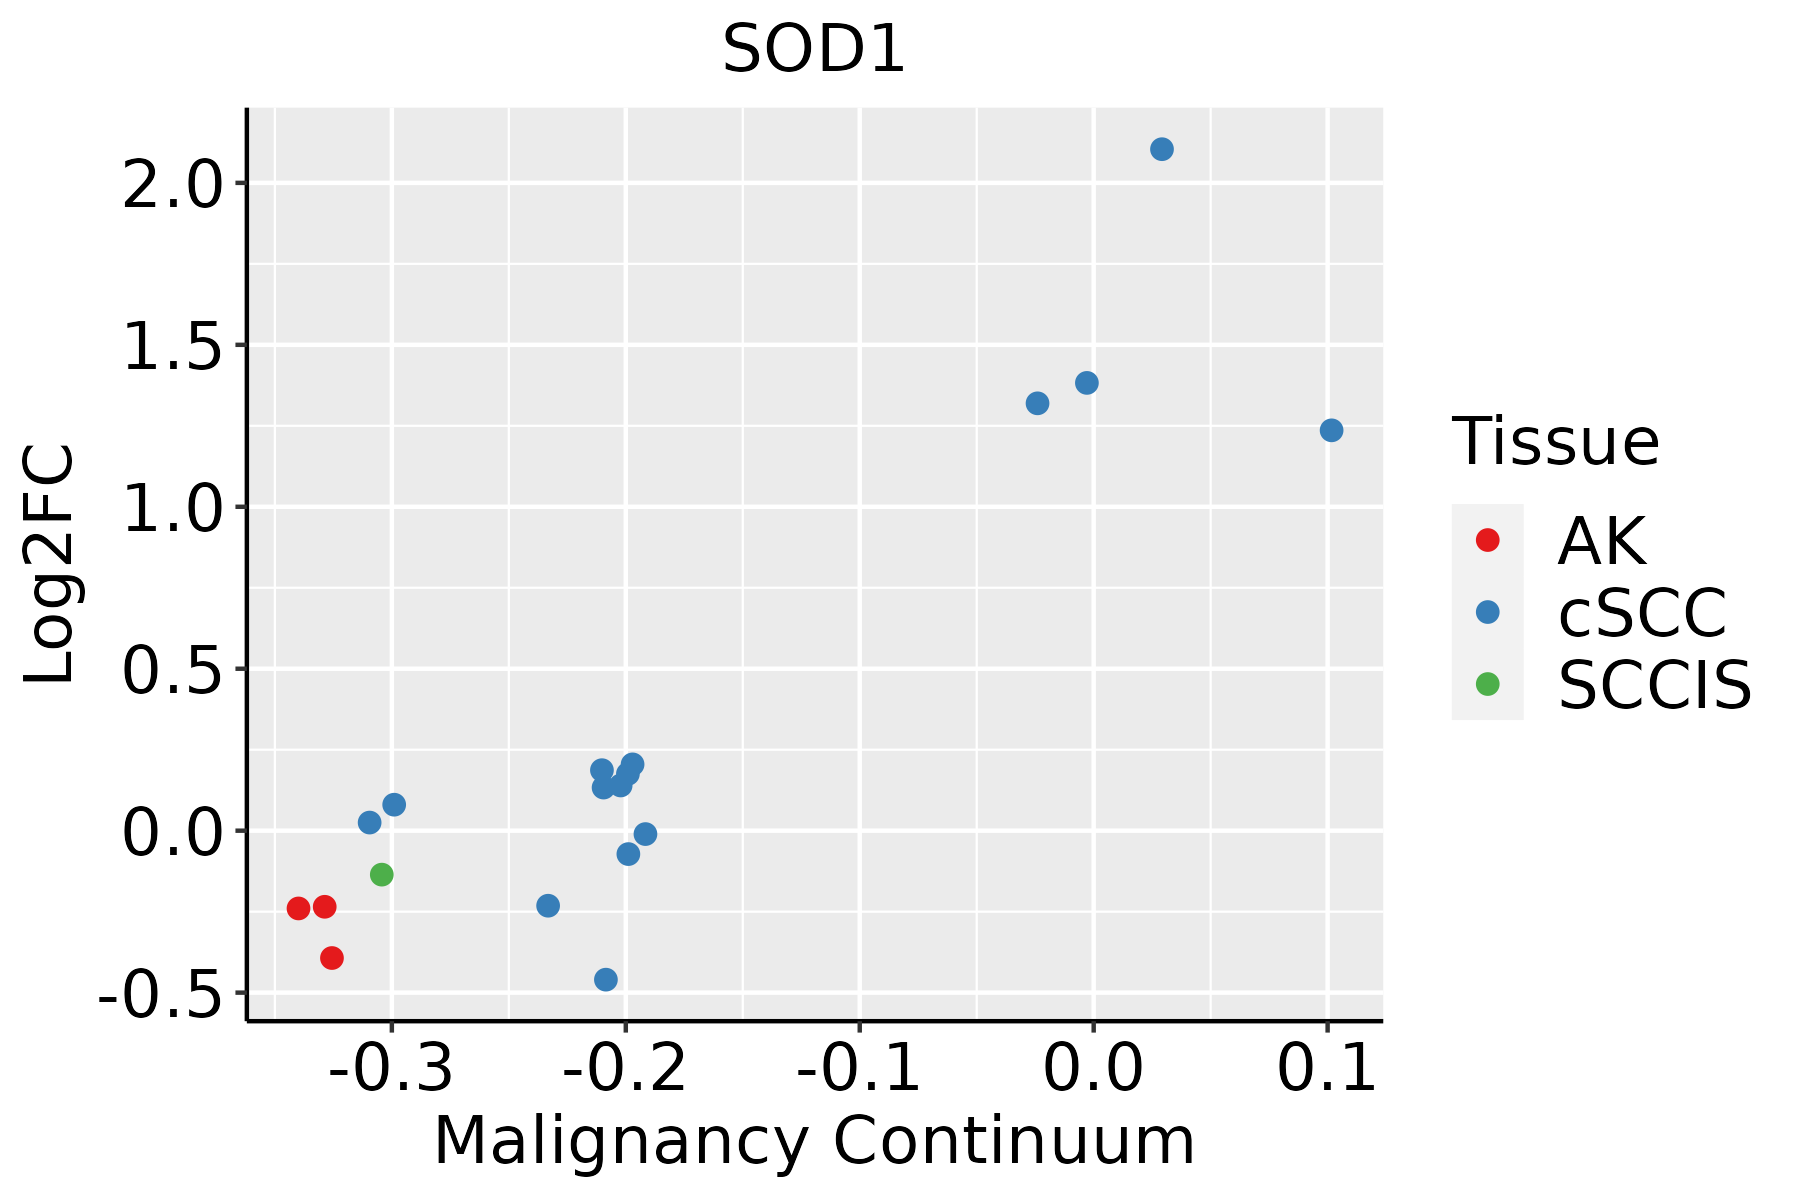 | AK: Actinic keratosis |
| cSCC: Cutaneous squamous cell carcinoma |
| SCCIS:squamous cell carcinoma in situ |
| Thyroid |  | ATC: Anaplastic thyroid cancer |
| HT: Hashimoto's thyroiditis |
| PTC: Papillary thyroid cancer |
| GO ID | Tissue | Disease Stage | Description | Gene Ratio | Bg Ratio | pvalue | p.adjust | Count |
| GO:009719330 | Thyroid | HT | intrinsic apoptotic signaling pathway | 52/1272 | 288/18723 | 7.65e-11 | 1.06e-08 | 52 |
| GO:009886926 | Thyroid | HT | cellular oxidant detoxification | 26/1272 | 101/18723 | 2.23e-09 | 2.26e-07 | 26 |
| GO:004254228 | Thyroid | HT | response to hydrogen peroxide | 32/1272 | 146/18723 | 2.66e-09 | 2.64e-07 | 32 |
| GO:006219730 | Thyroid | HT | cellular response to chemical stress | 54/1272 | 337/18723 | 3.07e-09 | 2.89e-07 | 54 |
| GO:005086319 | Thyroid | HT | regulation of T cell activation | 51/1272 | 329/18723 | 2.58e-08 | 1.97e-06 | 51 |
| GO:003459929 | Thyroid | HT | cellular response to oxidative stress | 46/1272 | 288/18723 | 4.97e-08 | 3.15e-06 | 46 |
| GO:004274315 | Thyroid | HT | hydrogen peroxide metabolic process | 17/1272 | 58/18723 | 1.73e-07 | 9.32e-06 | 17 |
| GO:007259320 | Thyroid | HT | reactive oxygen species metabolic process | 39/1272 | 239/18723 | 2.90e-07 | 1.38e-05 | 39 |
| GO:004211020 | Thyroid | HT | T cell activation | 63/1272 | 487/18723 | 5.95e-07 | 2.51e-05 | 63 |
| GO:000181919 | Thyroid | HT | positive regulation of cytokine production | 61/1272 | 467/18723 | 6.46e-07 | 2.68e-05 | 61 |
| GO:004668625 | Thyroid | HT | response to cadmium ion | 17/1272 | 68/18723 | 2.05e-06 | 7.51e-05 | 17 |
| GO:000206427 | Thyroid | HT | epithelial cell development | 35/1272 | 220/18723 | 2.12e-06 | 7.61e-05 | 35 |
| GO:001003830 | Thyroid | HT | response to metal ion | 50/1272 | 373/18723 | 3.12e-06 | 1.08e-04 | 50 |
| GO:000926623 | Thyroid | HT | response to temperature stimulus | 30/1272 | 178/18723 | 3.37e-06 | 1.13e-04 | 30 |
| GO:200124420 | Thyroid | HT | positive regulation of intrinsic apoptotic signaling pathway | 15/1272 | 58/18723 | 5.16e-06 | 1.61e-04 | 15 |
| GO:000756828 | Thyroid | HT | aging | 46/1272 | 339/18723 | 5.52e-06 | 1.68e-04 | 46 |
| GO:190040724 | Thyroid | HT | regulation of cellular response to oxidative stress | 19/1272 | 89/18723 | 6.62e-06 | 1.95e-04 | 19 |
| GO:19031319 | Thyroid | HT | mononuclear cell differentiation | 54/1272 | 426/18723 | 6.88e-06 | 2.00e-04 | 54 |
| GO:000226230 | Thyroid | HT | myeloid cell homeostasis | 27/1272 | 157/18723 | 6.97e-06 | 2.01e-04 | 27 |
| GO:190320124 | Thyroid | HT | regulation of oxidative stress-induced cell death | 17/1272 | 74/18723 | 7.10e-06 | 2.04e-04 | 17 |
| Pathway ID | Tissue | Disease Stage | Description | Gene Ratio | Bg Ratio | pvalue | p.adjust | qvalue | Count |
| hsa0501218 | Breast | Precancer | Parkinson disease | 99/684 | 266/8465 | 3.58e-42 | 5.65e-40 | 4.33e-40 | 99 |
| hsa0502016 | Breast | Precancer | Prion disease | 95/684 | 273/8465 | 1.39e-37 | 1.46e-35 | 1.12e-35 | 95 |
| hsa0501616 | Breast | Precancer | Huntington disease | 98/684 | 306/8465 | 2.85e-35 | 2.25e-33 | 1.72e-33 | 98 |
| hsa0501416 | Breast | Precancer | Amyotrophic lateral sclerosis | 98/684 | 364/8465 | 2.13e-28 | 8.41e-27 | 6.44e-27 | 98 |
| hsa0502216 | Breast | Precancer | Pathways of neurodegeneration - multiple diseases | 112/684 | 476/8465 | 6.96e-27 | 2.44e-25 | 1.87e-25 | 112 |
| hsa0520818 | Breast | Precancer | Chemical carcinogenesis - reactive oxygen species | 68/684 | 223/8465 | 3.61e-23 | 1.14e-21 | 8.73e-22 | 68 |
| hsa0501219 | Breast | Precancer | Parkinson disease | 99/684 | 266/8465 | 3.58e-42 | 5.65e-40 | 4.33e-40 | 99 |
| hsa0502017 | Breast | Precancer | Prion disease | 95/684 | 273/8465 | 1.39e-37 | 1.46e-35 | 1.12e-35 | 95 |
| hsa0501617 | Breast | Precancer | Huntington disease | 98/684 | 306/8465 | 2.85e-35 | 2.25e-33 | 1.72e-33 | 98 |
| hsa0501417 | Breast | Precancer | Amyotrophic lateral sclerosis | 98/684 | 364/8465 | 2.13e-28 | 8.41e-27 | 6.44e-27 | 98 |
| hsa0502217 | Breast | Precancer | Pathways of neurodegeneration - multiple diseases | 112/684 | 476/8465 | 6.96e-27 | 2.44e-25 | 1.87e-25 | 112 |
| hsa0520819 | Breast | Precancer | Chemical carcinogenesis - reactive oxygen species | 68/684 | 223/8465 | 3.61e-23 | 1.14e-21 | 8.73e-22 | 68 |
| hsa0501224 | Breast | IDC | Parkinson disease | 107/867 | 266/8465 | 2.57e-39 | 8.36e-37 | 6.26e-37 | 107 |
| hsa0502023 | Breast | IDC | Prion disease | 102/867 | 273/8465 | 3.70e-34 | 4.01e-32 | 3.00e-32 | 102 |
| hsa0501623 | Breast | IDC | Huntington disease | 103/867 | 306/8465 | 5.14e-30 | 4.17e-28 | 3.12e-28 | 103 |
| hsa0501423 | Breast | IDC | Amyotrophic lateral sclerosis | 102/867 | 364/8465 | 1.29e-22 | 5.22e-21 | 3.91e-21 | 102 |
| hsa0502223 | Breast | IDC | Pathways of neurodegeneration - multiple diseases | 116/867 | 476/8465 | 3.63e-20 | 1.18e-18 | 8.82e-19 | 116 |
| hsa0520824 | Breast | IDC | Chemical carcinogenesis - reactive oxygen species | 71/867 | 223/8465 | 2.55e-19 | 7.53e-18 | 5.63e-18 | 71 |
| hsa0501234 | Breast | IDC | Parkinson disease | 107/867 | 266/8465 | 2.57e-39 | 8.36e-37 | 6.26e-37 | 107 |
| hsa0502033 | Breast | IDC | Prion disease | 102/867 | 273/8465 | 3.70e-34 | 4.01e-32 | 3.00e-32 | 102 |
| Hugo Symbol | Variant Class | Variant Classification | dbSNP RS | HGVSc | HGVSp | HGVSp Short | SWISSPROT | BIOTYPE | SIFT | PolyPhen | Tumor Sample Barcode | Tissue | Histology | Sex | Age | Stage | Therapy Types | Drugs | Outcome |
| SOD1 | SNV | Missense_Mutation | | c.315N>G | p.Ile105Met | p.I105M | P00441 | protein_coding | deleterious(0.02) | probably_damaging(0.969) | TCGA-A2-A04W-01 | Breast | breast invasive carcinoma | Female | <65 | I/II | Chemotherapy | cytoxan | SD |
| SOD1 | SNV | Missense_Mutation | | c.224N>T | p.Pro75Leu | p.P75L | P00441 | protein_coding | deleterious(0) | probably_damaging(1) | TCGA-BH-A18J-01 | Breast | breast invasive carcinoma | Female | <65 | III/IV | Unknown | Unknown | PD |
| SOD1 | SNV | Missense_Mutation | novel | c.109N>C | p.Lys37Gln | p.K37Q | P00441 | protein_coding | tolerated(0.08) | benign(0) | TCGA-CA-6717-01 | Colorectum | colon adenocarcinoma | Male | <65 | I/II | Chemotherapy | oxaliplatin | CR |
| SOD1 | SNV | Missense_Mutation | | c.32N>T | p.Gly11Val | p.G11V | P00441 | protein_coding | deleterious(0) | probably_damaging(0.982) | TCGA-A5-A0G1-01 | Endometrium | uterine corpus endometrioid carcinoma | Female | >=65 | I/II | Unknown | Unknown | SD |
| SOD1 | SNV | Missense_Mutation | | c.446N>C | p.Val149Ala | p.V149A | P00441 | protein_coding | deleterious(0) | probably_damaging(1) | TCGA-AP-A051-01 | Endometrium | uterine corpus endometrioid carcinoma | Female | >=65 | I/II | Unknown | Unknown | SD |
| SOD1 | SNV | Missense_Mutation | | c.331N>A | p.His111Asn | p.H111N | P00441 | protein_coding | tolerated(0.7) | benign(0.005) | TCGA-AP-A059-01 | Endometrium | uterine corpus endometrioid carcinoma | Female | >=65 | I/II | Unknown | Unknown | SD |
| SOD1 | SNV | Missense_Mutation | rs121912459 | c.289N>A | p.Asp97Asn | p.D97N | P00441 | protein_coding | tolerated(0.29) | benign(0) | TCGA-AP-A1DV-01 | Endometrium | uterine corpus endometrioid carcinoma | Female | <65 | I/II | Unknown | Unknown | SD |
| SOD1 | SNV | Missense_Mutation | novel | c.239G>T | p.Arg80Met | p.R80M | P00441 | protein_coding | deleterious(0) | probably_damaging(1) | TCGA-AX-A1CE-01 | Endometrium | uterine corpus endometrioid carcinoma | Female | <65 | I/II | Unspecific | Paclitaxel | SD |
| SOD1 | SNV | Missense_Mutation | novel | c.8C>T | p.Thr3Met | p.T3M | P00441 | protein_coding | tolerated(0.31) | benign(0) | TCGA-AX-A3FX-01 | Endometrium | uterine corpus endometrioid carcinoma | Female | >=65 | I/II | Chemotherapy | carboplatin | PD |
| SOD1 | SNV | Missense_Mutation | | c.268N>A | p.Ala90Thr | p.A90T | P00441 | protein_coding | tolerated(0.17) | probably_damaging(0.976) | TCGA-BG-A0MG-01 | Endometrium | uterine corpus endometrioid carcinoma | Female | >=65 | I/II | Unknown | Unknown | SD |


