| Tissue | Expression Dynamics | Abbreviation |
| Breast | 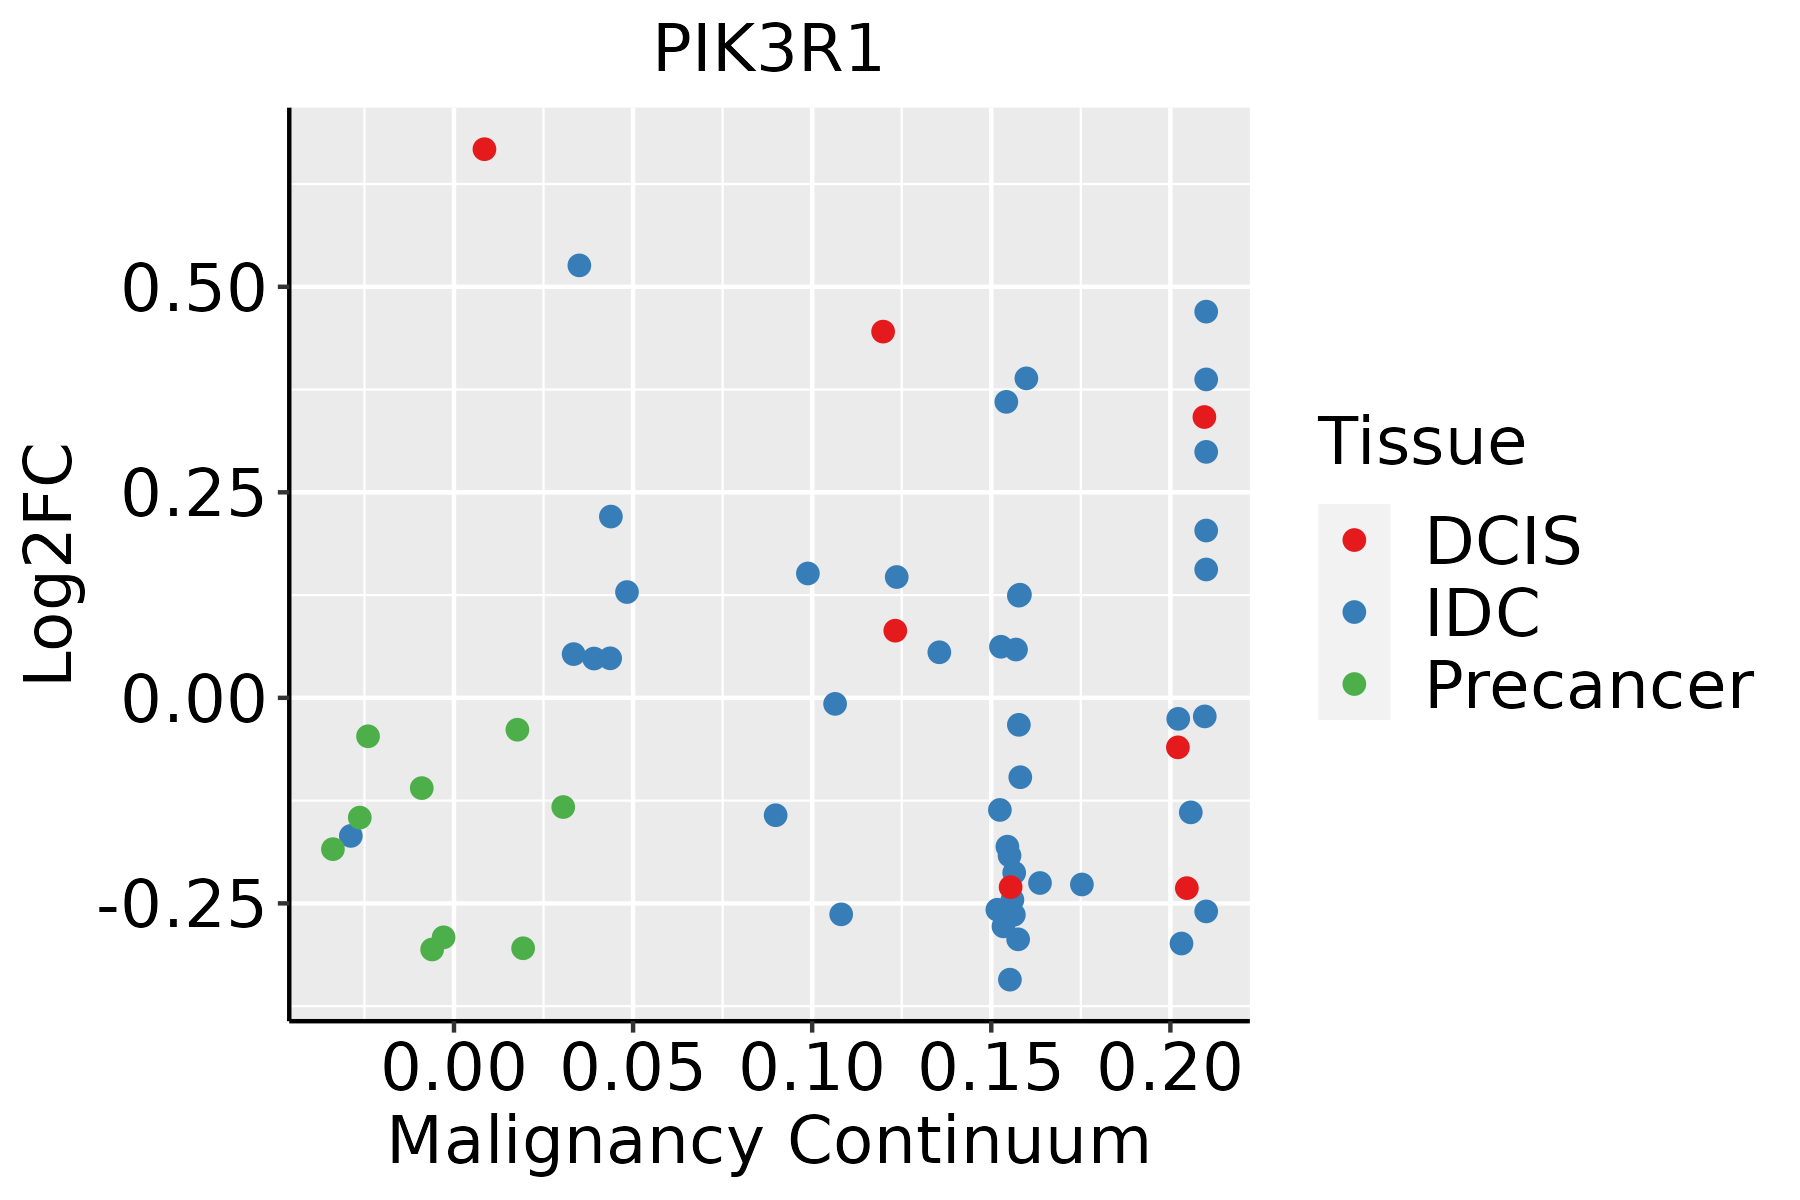 | IDC: Invasive ductal carcinoma |
| DCIS: Ductal carcinoma in situ |
| Precancer(BRCA1-mut): Precancerous lesion from BRCA1 mutation carriers |
| Cervix |  | CC: Cervix cancer |
| HSIL_HPV: HPV-infected high-grade squamous intraepithelial lesions |
| N_HPV: HPV-infected normal cervix |
| Colorectum (GSE201348) |  | FAP: Familial adenomatous polyposis |
| CRC: Colorectal cancer |
| Colorectum (HTA11) |  | AD: Adenomas |
| SER: Sessile serrated lesions |
| MSI-H: Microsatellite-high colorectal cancer |
| MSS: Microsatellite stable colorectal cancer |
| Endometrium | 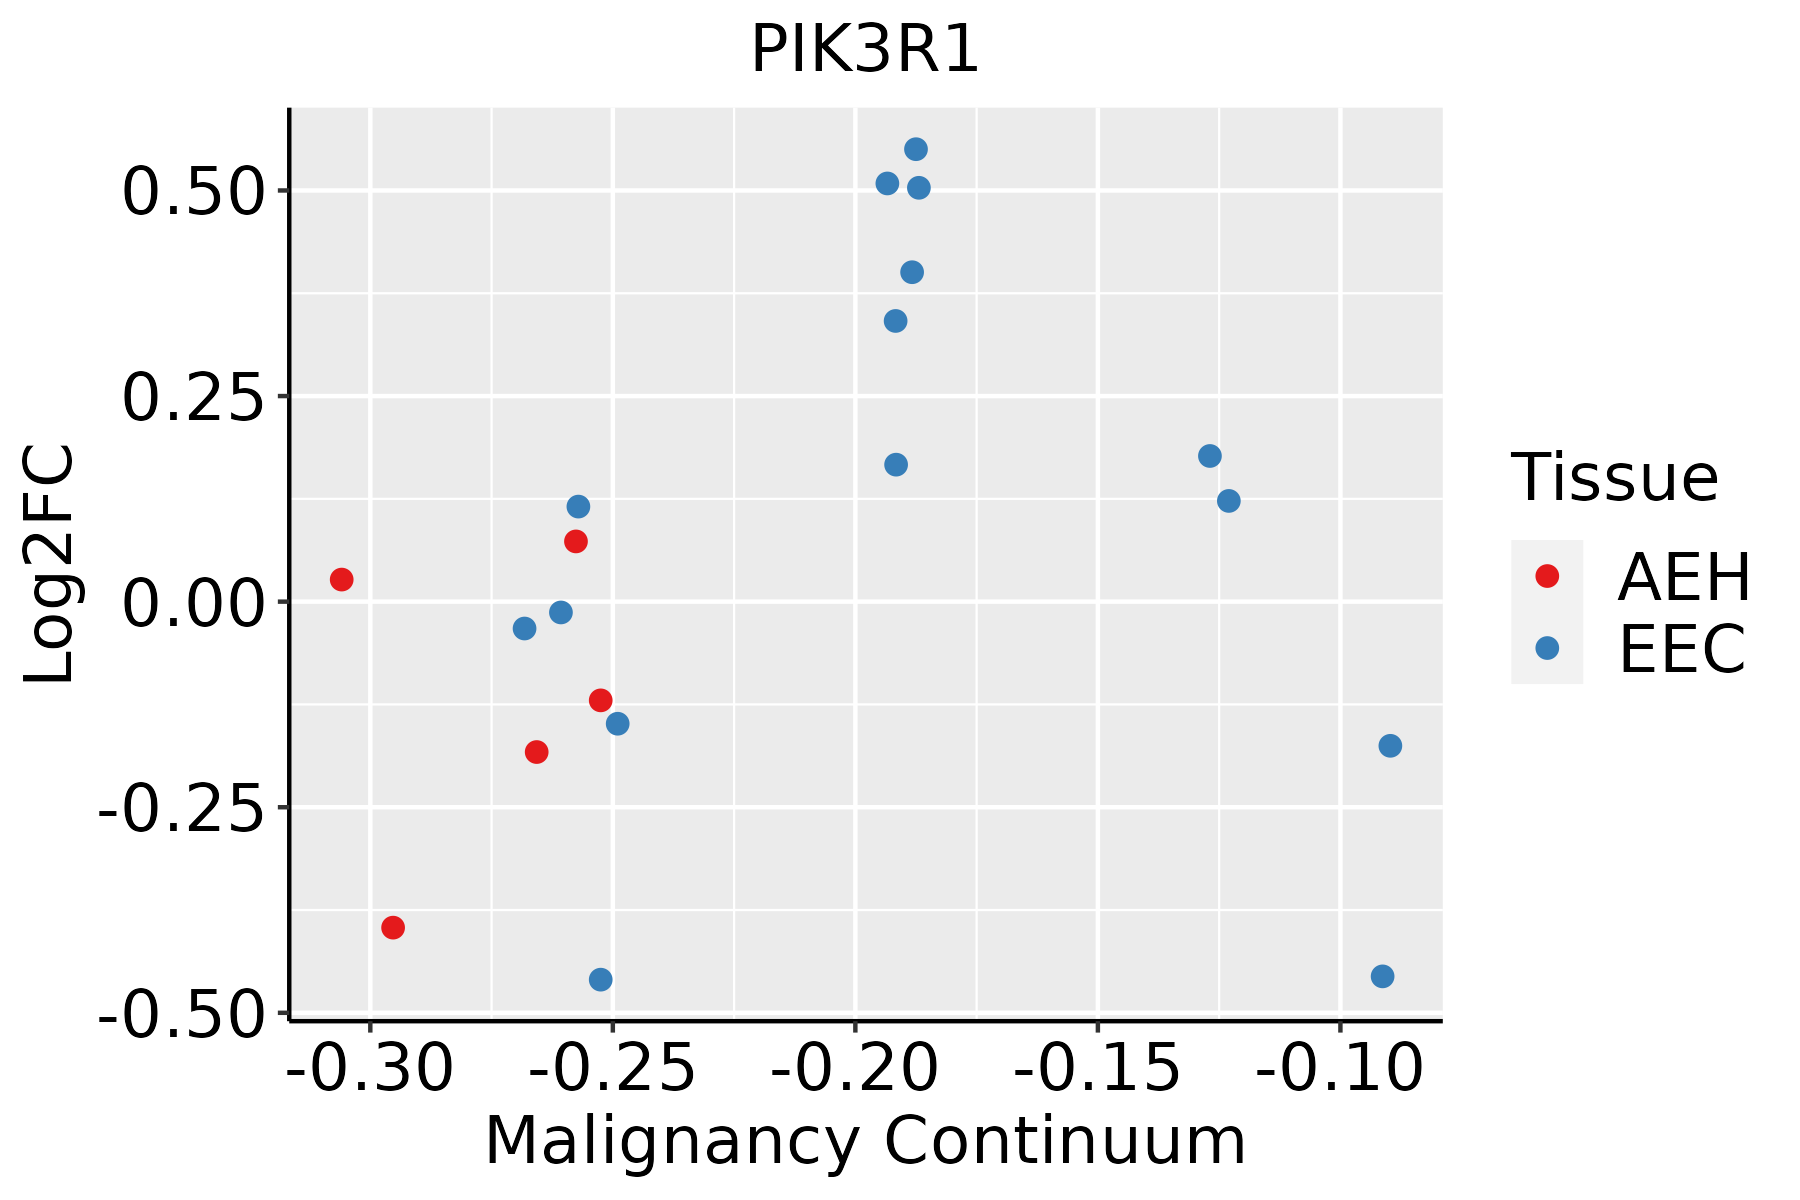 | AEH: Atypical endometrial hyperplasia |
| EEC: Endometrioid Cancer |
| Esophagus |  | ESCC: Esophageal squamous cell carcinoma |
| HGIN: High-grade intraepithelial neoplasias |
| LGIN: Low-grade intraepithelial neoplasias |
| Liver | 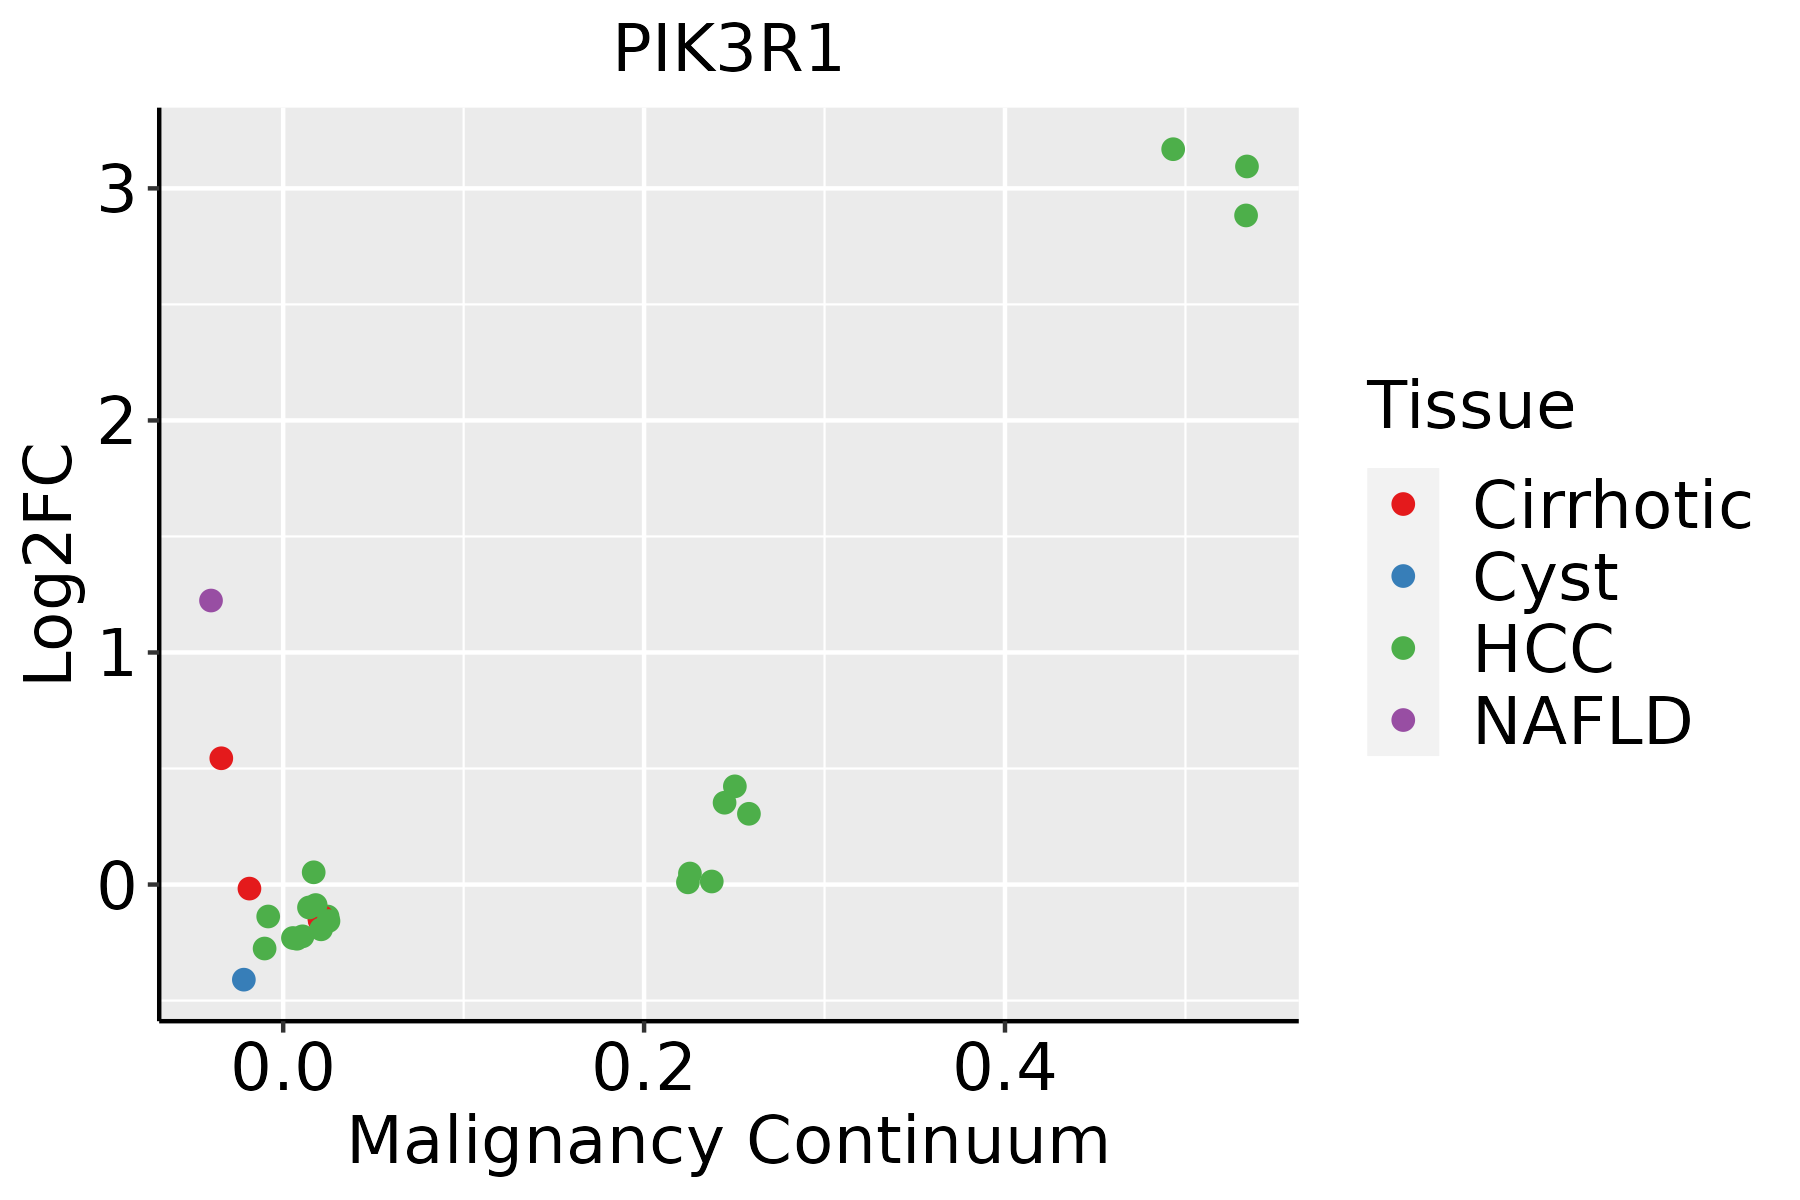 | HCC: Hepatocellular carcinoma |
| NAFLD: Non-alcoholic fatty liver disease |
| Prostate | 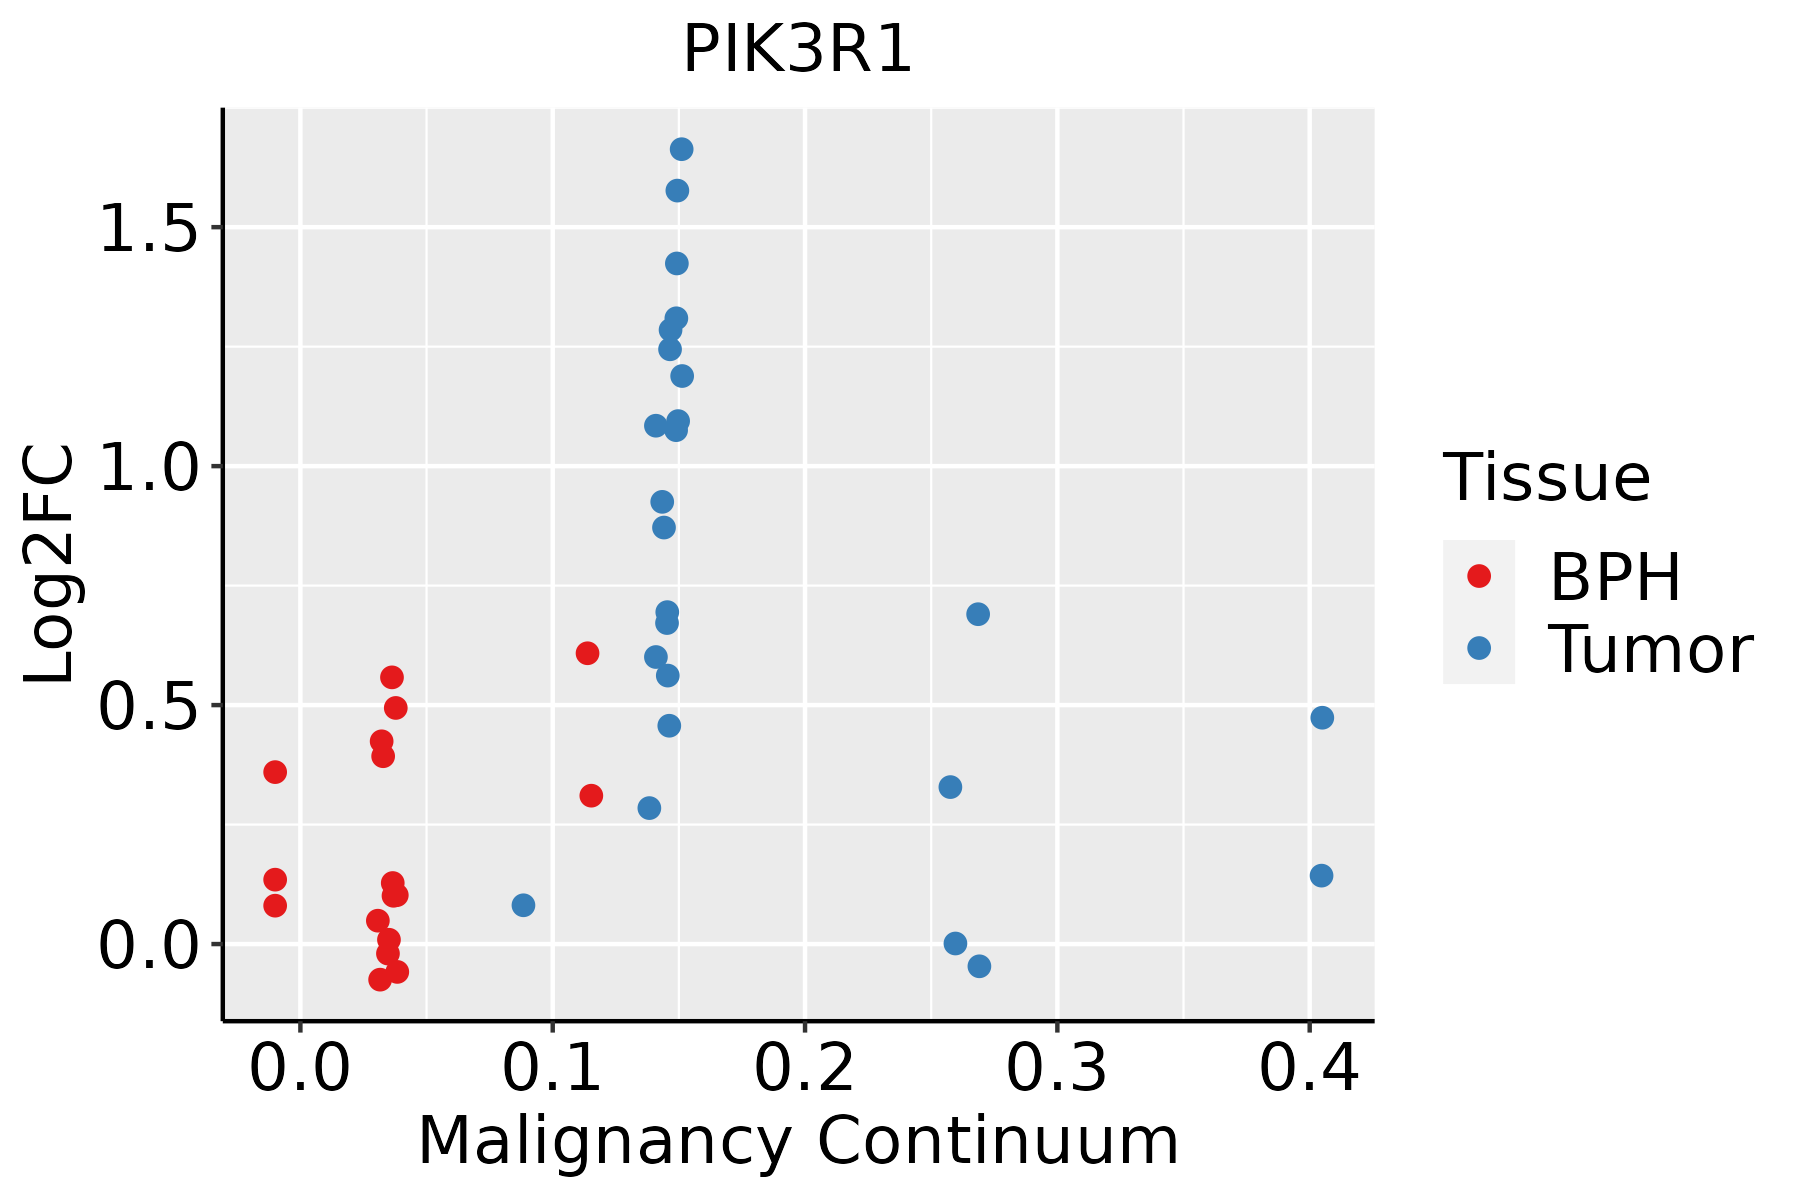 | BPH: Benign Prostatic Hyperplasia |
| Skin | 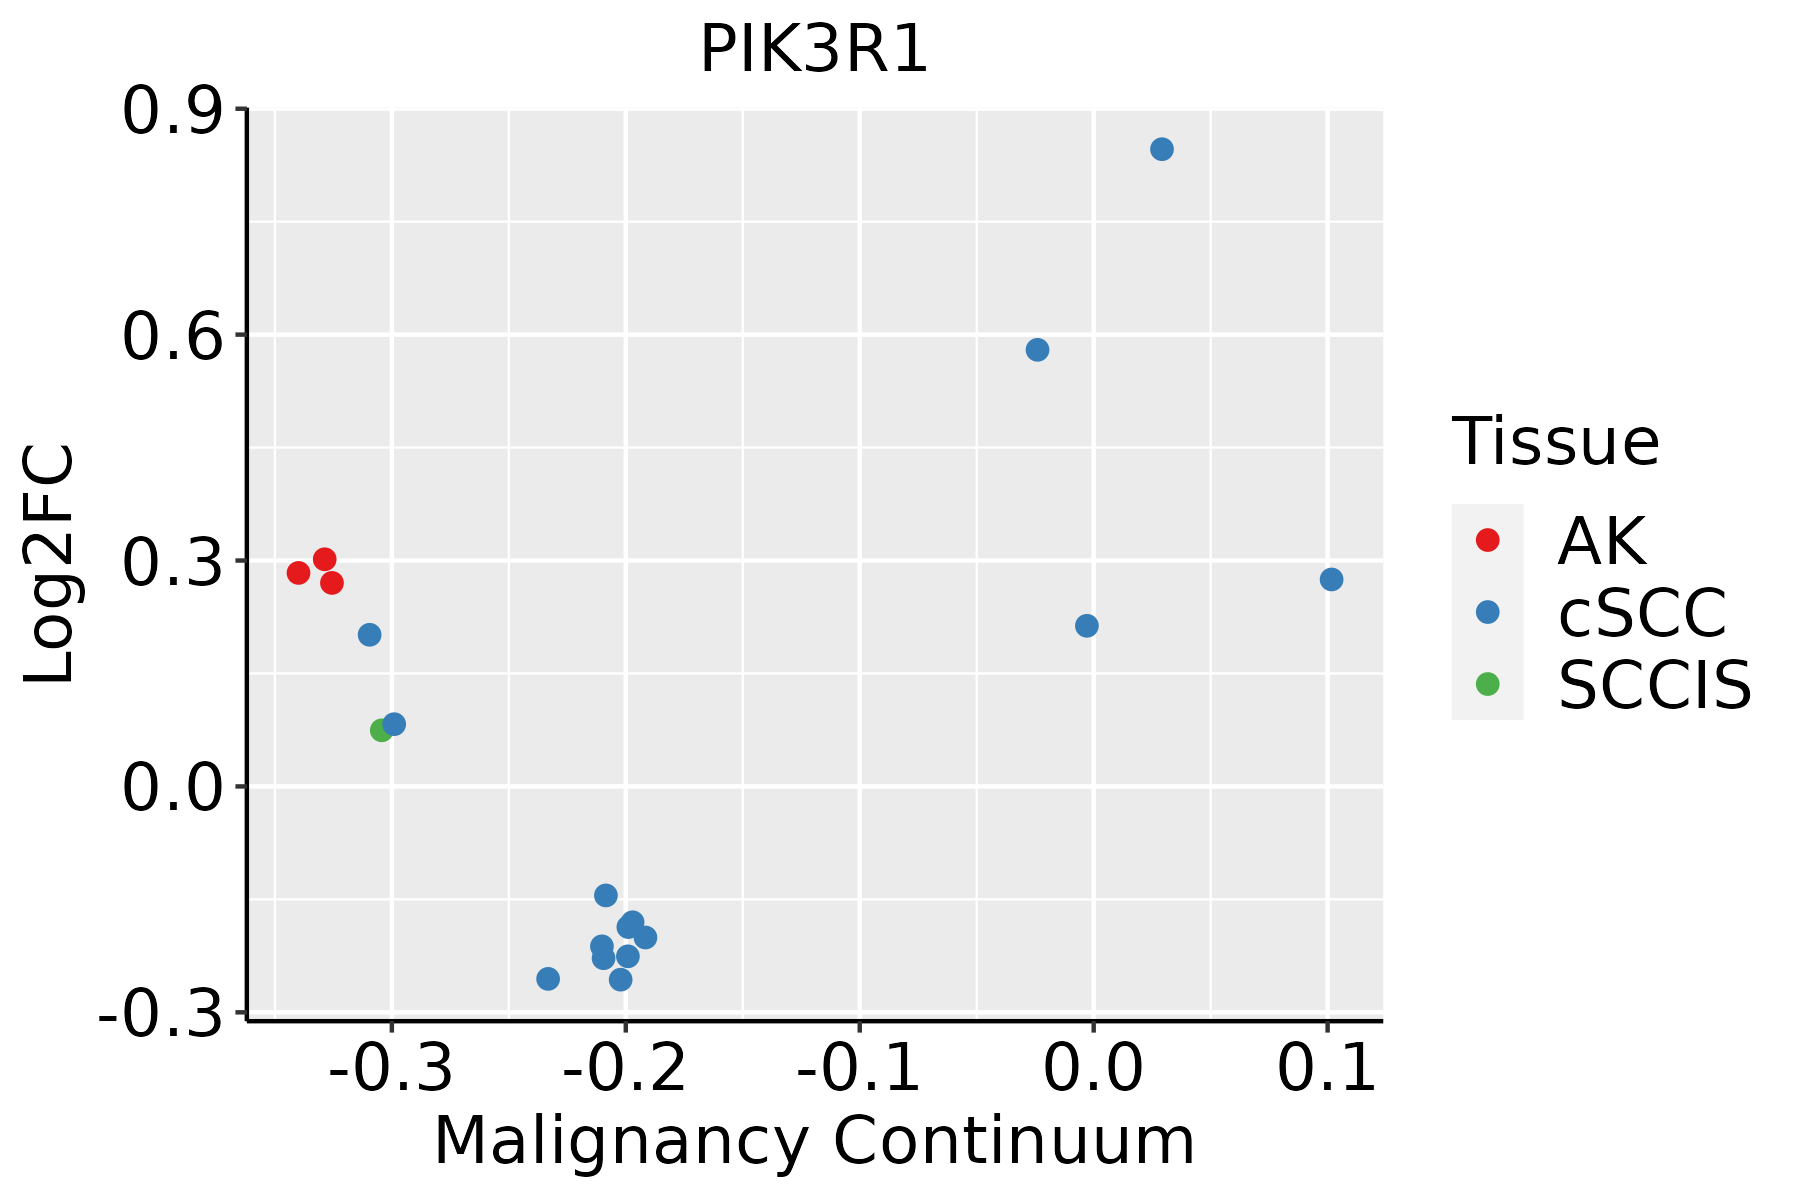 | AK: Actinic keratosis |
| cSCC: Cutaneous squamous cell carcinoma |
| SCCIS:squamous cell carcinoma in situ |
| Thyroid |  | ATC: Anaplastic thyroid cancer |
| HT: Hashimoto's thyroiditis |
| PTC: Papillary thyroid cancer |
| GO ID | Tissue | Disease Stage | Description | Gene Ratio | Bg Ratio | pvalue | p.adjust | Count |
| GO:0110020111 | Thyroid | PTC | regulation of actomyosin structure organization | 53/5968 | 100/18723 | 9.35e-06 | 1.05e-04 | 53 |
| GO:0031032110 | Thyroid | PTC | actomyosin structure organization | 91/5968 | 196/18723 | 1.35e-05 | 1.45e-04 | 91 |
| GO:190547725 | Thyroid | PTC | positive regulation of protein localization to membrane | 55/5968 | 106/18723 | 1.45e-05 | 1.55e-04 | 55 |
| GO:0030099113 | Thyroid | PTC | myeloid cell differentiation | 160/5968 | 381/18723 | 1.75e-05 | 1.82e-04 | 160 |
| GO:000828617 | Thyroid | PTC | insulin receptor signaling pathway | 58/5968 | 116/18723 | 3.59e-05 | 3.36e-04 | 58 |
| GO:190589815 | Thyroid | PTC | positive regulation of response to endoplasmic reticulum stress | 23/5968 | 35/18723 | 4.02e-05 | 3.68e-04 | 23 |
| GO:1902904111 | Thyroid | PTC | negative regulation of supramolecular fiber organization | 78/5968 | 167/18723 | 4.16e-05 | 3.80e-04 | 78 |
| GO:190010117 | Thyroid | PTC | regulation of endoplasmic reticulum unfolded protein response | 20/5968 | 30/18723 | 9.53e-05 | 7.85e-04 | 20 |
| GO:190274518 | Thyroid | PTC | positive regulation of lamellipodium organization | 23/5968 | 37/18723 | 1.44e-04 | 1.12e-03 | 23 |
| GO:1904377111 | Thyroid | PTC | positive regulation of protein localization to cell periphery | 37/5968 | 69/18723 | 1.46e-04 | 1.13e-03 | 37 |
| GO:001059216 | Thyroid | PTC | positive regulation of lamellipodium assembly | 19/5968 | 29/18723 | 2.02e-04 | 1.51e-03 | 19 |
| GO:005149419 | Thyroid | PTC | negative regulation of cytoskeleton organization | 73/5968 | 163/18723 | 3.59e-04 | 2.44e-03 | 73 |
| GO:009758119 | Thyroid | PTC | lamellipodium organization | 44/5968 | 90/18723 | 5.59e-04 | 3.56e-03 | 44 |
| GO:00514891 | Thyroid | PTC | regulation of filopodium assembly | 26/5968 | 47/18723 | 7.38e-04 | 4.59e-03 | 26 |
| GO:1903078110 | Thyroid | PTC | positive regulation of protein localization to plasma membrane | 32/5968 | 62/18723 | 9.64e-04 | 5.77e-03 | 32 |
| GO:0051491 | Thyroid | PTC | positive regulation of filopodium assembly | 18/5968 | 30/18723 | 1.38e-03 | 7.74e-03 | 18 |
| GO:00094167 | Thyroid | PTC | response to light stimulus | 127/5968 | 320/18723 | 1.76e-03 | 9.58e-03 | 127 |
| GO:190274317 | Thyroid | PTC | regulation of lamellipodium organization | 28/5968 | 54/18723 | 1.79e-03 | 9.68e-03 | 28 |
| GO:004684711 | Thyroid | PTC | filopodium assembly | 31/5968 | 62/18723 | 2.23e-03 | 1.18e-02 | 31 |
| GO:0001678110 | Thyroid | PTC | cellular glucose homeostasis | 72/5968 | 172/18723 | 3.58e-03 | 1.73e-02 | 72 |
| Pathway ID | Tissue | Disease Stage | Description | Gene Ratio | Bg Ratio | pvalue | p.adjust | qvalue | Count |
| hsa0513118 | Breast | Precancer | Shigellosis | 44/684 | 247/8465 | 3.91e-07 | 6.86e-06 | 5.26e-06 | 44 |
| hsa0513119 | Breast | Precancer | Shigellosis | 44/684 | 247/8465 | 3.91e-07 | 6.86e-06 | 5.26e-06 | 44 |
| hsa0502023 | Breast | IDC | Prion disease | 102/867 | 273/8465 | 3.70e-34 | 4.01e-32 | 3.00e-32 | 102 |
| hsa0517124 | Breast | IDC | Coronavirus disease - COVID-19 | 86/867 | 232/8465 | 1.50e-28 | 9.72e-27 | 7.27e-27 | 86 |
| hsa0501023 | Breast | IDC | Alzheimer disease | 107/867 | 384/8465 | 1.70e-23 | 7.88e-22 | 5.90e-22 | 107 |
| hsa0520824 | Breast | IDC | Chemical carcinogenesis - reactive oxygen species | 71/867 | 223/8465 | 2.55e-19 | 7.53e-18 | 5.63e-18 | 71 |
| hsa0541523 | Breast | IDC | Diabetic cardiomyopathy | 67/867 | 203/8465 | 3.17e-19 | 8.59e-18 | 6.43e-18 | 67 |
| hsa0493223 | Breast | IDC | Non-alcoholic fatty liver disease | 50/867 | 155/8465 | 3.48e-14 | 8.08e-13 | 6.05e-13 | 50 |
| hsa0491523 | Breast | IDC | Estrogen signaling pathway | 35/867 | 138/8465 | 2.55e-07 | 5.18e-06 | 3.88e-06 | 35 |
| hsa0516922 | Breast | IDC | Epstein-Barr virus infection | 45/867 | 202/8465 | 3.16e-07 | 6.05e-06 | 4.52e-06 | 45 |
| hsa0541824 | Breast | IDC | Fluid shear stress and atherosclerosis | 34/867 | 139/8465 | 9.41e-07 | 1.61e-05 | 1.20e-05 | 34 |
| hsa0421824 | Breast | IDC | Cellular senescence | 35/867 | 156/8465 | 5.49e-06 | 7.43e-05 | 5.56e-05 | 35 |
| hsa0520523 | Breast | IDC | Proteoglycans in cancer | 42/867 | 205/8465 | 7.69e-06 | 9.99e-05 | 7.48e-05 | 42 |
| hsa0421022 | Breast | IDC | Apoptosis | 31/867 | 136/8465 | 1.34e-05 | 1.61e-04 | 1.20e-04 | 31 |
| hsa0513124 | Breast | IDC | Shigellosis | 47/867 | 247/8465 | 1.78e-05 | 2.00e-04 | 1.49e-04 | 47 |
| hsa0516723 | Breast | IDC | Kaposi sarcoma-associated herpesvirus infection | 38/867 | 194/8465 | 5.87e-05 | 5.96e-04 | 4.46e-04 | 38 |
| hsa0516624 | Breast | IDC | Human T-cell leukemia virus 1 infection | 40/867 | 222/8465 | 2.52e-04 | 2.21e-03 | 1.66e-03 | 40 |
| hsa0516324 | Breast | IDC | Human cytomegalovirus infection | 39/867 | 225/8465 | 6.66e-04 | 5.41e-03 | 4.05e-03 | 39 |
| hsa0406623 | Breast | IDC | HIF-1 signaling pathway | 22/867 | 109/8465 | 1.36e-03 | 1.00e-02 | 7.50e-03 | 22 |
| hsa0510024 | Breast | IDC | Bacterial invasion of epithelial cells | 17/867 | 77/8465 | 1.69e-03 | 1.19e-02 | 8.93e-03 | 17 |
| Hugo Symbol | Variant Class | Variant Classification | dbSNP RS | HGVSc | HGVSp | HGVSp Short | SWISSPROT | BIOTYPE | SIFT | PolyPhen | Tumor Sample Barcode | Tissue | Histology | Sex | Age | Stage | Therapy Types | Drugs | Outcome |
| PIK3R1 | SNV | Missense_Mutation | novel | c.1218N>A | p.Asn406Lys | p.N406K | P27986 | protein_coding | tolerated(0.08) | benign(0.414) | TCGA-AO-A0JG-01 | Breast | breast invasive carcinoma | Female | <65 | III/IV | Chemotherapy | doxorubicin | SD |
| PIK3R1 | SNV | Missense_Mutation | novel | c.166N>G | p.Leu56Val | p.L56V | P27986 | protein_coding | deleterious(0.02) | possibly_damaging(0.734) | TCGA-AO-A1KT-01 | Breast | breast invasive carcinoma | Female | >=65 | I/II | Chemotherapy | fluorouracil | SD |
| PIK3R1 | SNV | Missense_Mutation | | c.1390N>A | p.Asp464Asn | p.D464N | P27986 | protein_coding | deleterious(0) | probably_damaging(0.986) | TCGA-AR-A0TQ-01 | Breast | breast invasive carcinoma | Female | <65 | III/IV | Chemotherapy | doxorubicin | SD |
| PIK3R1 | SNV | Missense_Mutation | | c.1529N>T | p.Glu510Val | p.E510V | P27986 | protein_coding | deleterious(0) | possibly_damaging(0.895) | TCGA-AR-A24M-01 | Breast | breast invasive carcinoma | Female | <65 | III/IV | Hormone Therapy | tamoxiphen | SD |
| PIK3R1 | SNV | Missense_Mutation | | c.1676T>C | p.Ile559Thr | p.I559T | P27986 | protein_coding | tolerated(0.19) | possibly_damaging(0.499) | TCGA-BH-A1FD-01 | Breast | breast invasive carcinoma | Female | >=65 | I/II | Unknown | Unknown | PD |
| PIK3R1 | SNV | Missense_Mutation | | c.1319N>G | p.Asp440Gly | p.D440G | P27986 | protein_coding | deleterious(0.02) | benign(0.108) | TCGA-C8-A135-01 | Breast | breast invasive carcinoma | Female | <65 | I/II | Chemotherapy | 5-fluorouracil | CR |
| PIK3R1 | SNV | Missense_Mutation | novel | c.166T>G | p.Leu56Val | p.L56V | P27986 | protein_coding | deleterious(0.02) | possibly_damaging(0.734) | TCGA-D8-A1JK-01 | Breast | breast invasive carcinoma | Female | >=65 | I/II | Unknown | Unknown | SD |
| PIK3R1 | SNV | Missense_Mutation | | c.1930G>T | p.Gly644Cys | p.G644C | P27986 | protein_coding | deleterious(0) | probably_damaging(1) | TCGA-D8-A1XK-01 | Breast | breast invasive carcinoma | Female | <65 | I/II | Chemotherapy | doxorubicine+cyclophosphamide | SD |
| PIK3R1 | SNV | Missense_Mutation | | c.2007T>A | p.His669Gln | p.H669Q | P27986 | protein_coding | deleterious(0) | probably_damaging(0.992) | TCGA-D8-A1XK-01 | Breast | breast invasive carcinoma | Female | <65 | I/II | Chemotherapy | doxorubicine+cyclophosphamide | SD |
| PIK3R1 | SNV | Missense_Mutation | | c.1930N>A | p.Gly644Ser | p.G644S | P27986 | protein_coding | deleterious(0) | probably_damaging(1) | TCGA-D8-A1XQ-01 | Breast | breast invasive carcinoma | Female | >=65 | I/II | Unknown | Unknown | SD |
| Entrez ID | Symbol | Category | Interaction Types | Drug Claim Name | Drug Name | PMIDs |
| 5295 | PIK3R1 | CLINICALLY ACTIONABLE, ENZYME, KINASE, DRUGGABLE GENOME, PHOSPHATIDYLINOSITOL 3 KINASE | | ZSTK474 | | |
| 5295 | PIK3R1 | CLINICALLY ACTIONABLE, ENZYME, KINASE, DRUGGABLE GENOME, PHOSPHATIDYLINOSITOL 3 KINASE | inhibitor | CHEMBL3545324 | RG-7666 | |
| 5295 | PIK3R1 | CLINICALLY ACTIONABLE, ENZYME, KINASE, DRUGGABLE GENOME, PHOSPHATIDYLINOSITOL 3 KINASE | inhibitor | CHEMBL1079593 | VS-5584 | |
| 5295 | PIK3R1 | CLINICALLY ACTIONABLE, ENZYME, KINASE, DRUGGABLE GENOME, PHOSPHATIDYLINOSITOL 3 KINASE | inhibitor | CHEMBL592445 | GEDATOLISIB | |
| 5295 | PIK3R1 | CLINICALLY ACTIONABLE, ENZYME, KINASE, DRUGGABLE GENOME, PHOSPHATIDYLINOSITOL 3 KINASE | inhibitor | CHEMBL2326966 | SF-1126 | |
| 5295 | PIK3R1 | CLINICALLY ACTIONABLE, ENZYME, KINASE, DRUGGABLE GENOME, PHOSPHATIDYLINOSITOL 3 KINASE | inhibitor | DACTOLISIB | DACTOLISIB | |
| 5295 | PIK3R1 | CLINICALLY ACTIONABLE, ENZYME, KINASE, DRUGGABLE GENOME, PHOSPHATIDYLINOSITOL 3 KINASE | inhibitor | CHEMBL3545088 | PUQUITINIB | |
| 5295 | PIK3R1 | CLINICALLY ACTIONABLE, ENZYME, KINASE, DRUGGABLE GENOME, PHOSPHATIDYLINOSITOL 3 KINASE | inhibitor | BUPARLISIB HYDROCHLORIDE | | |
| 5295 | PIK3R1 | CLINICALLY ACTIONABLE, ENZYME, KINASE, DRUGGABLE GENOME, PHOSPHATIDYLINOSITOL 3 KINASE | inhibitor | CHEMBL521851 | PICTILISIB | |
| 5295 | PIK3R1 | CLINICALLY ACTIONABLE, ENZYME, KINASE, DRUGGABLE GENOME, PHOSPHATIDYLINOSITOL 3 KINASE | inhibitor | PWT33597 | | |


