| Tissue | Expression Dynamics | Abbreviation |
| Breast | 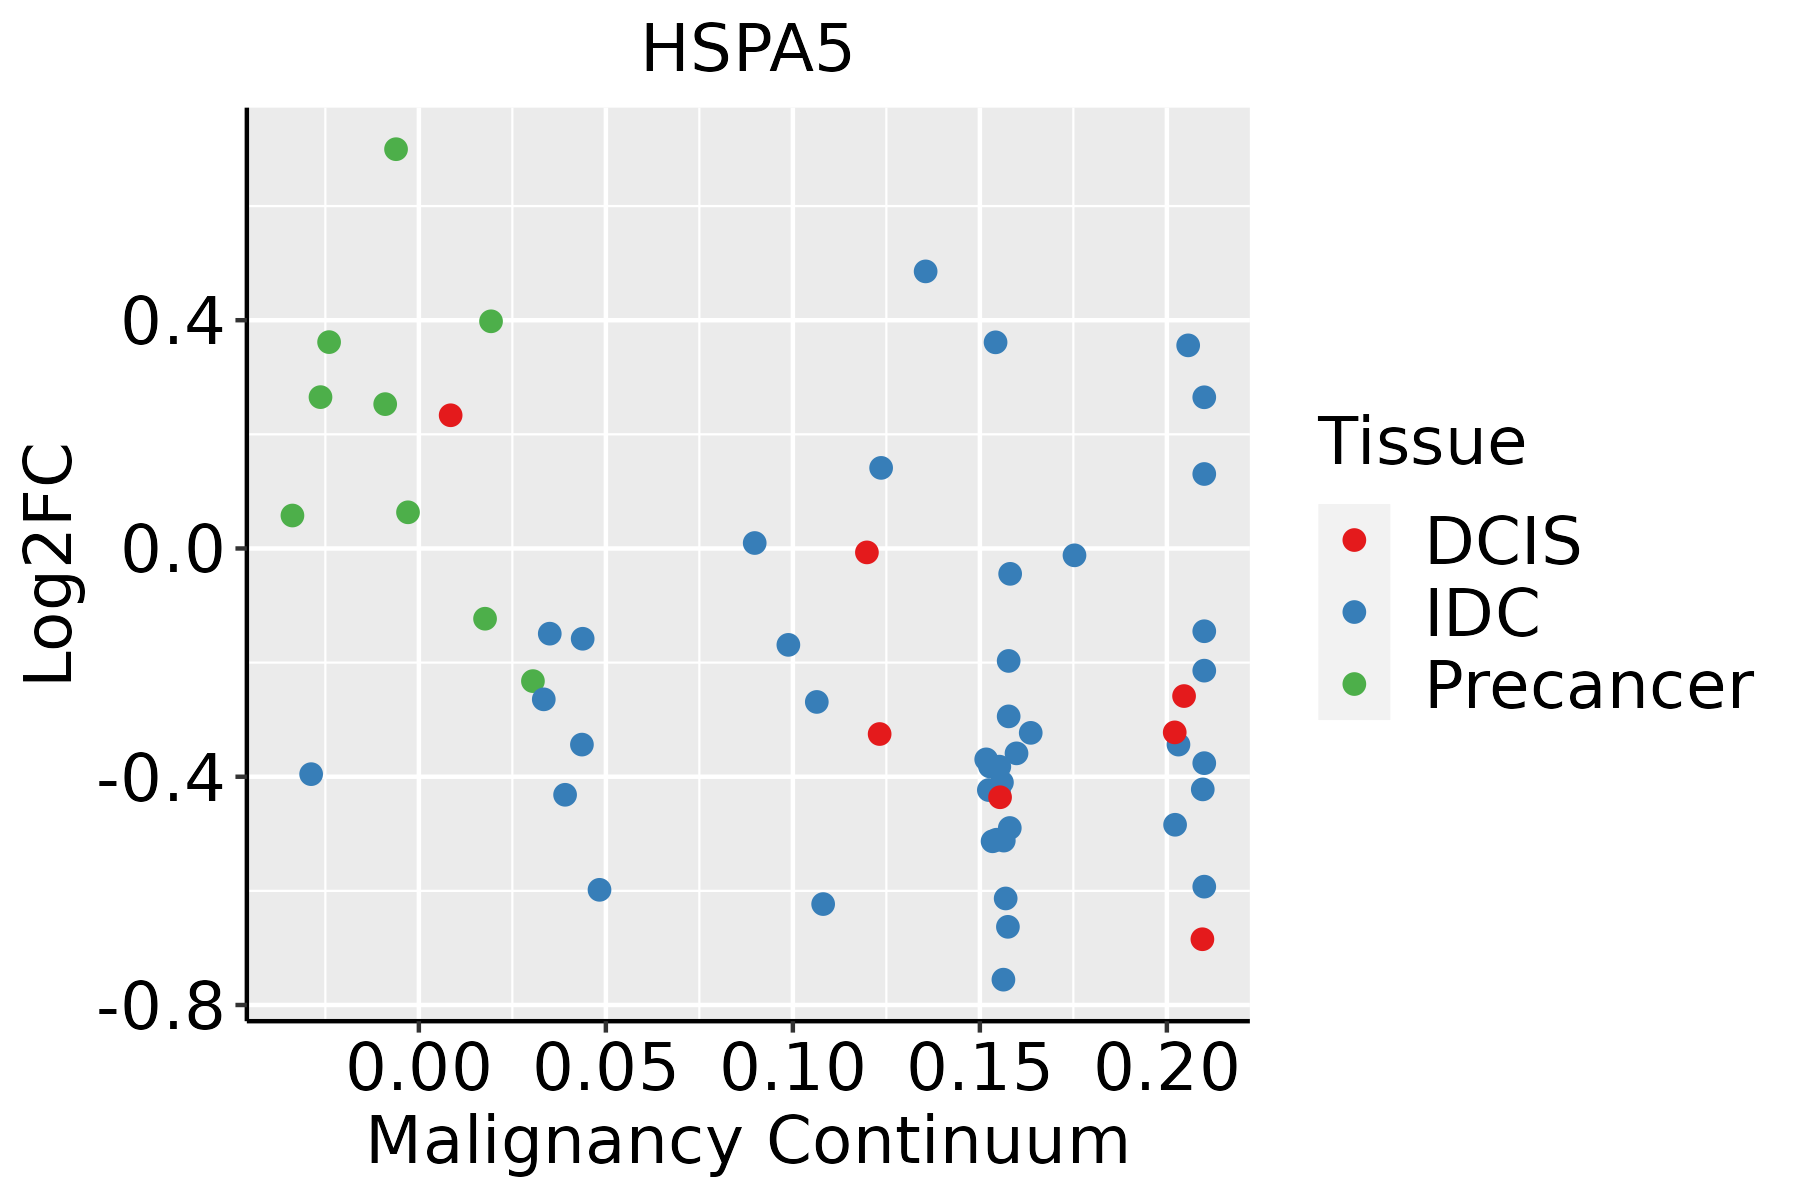 | IDC: Invasive ductal carcinoma |
| DCIS: Ductal carcinoma in situ |
| Precancer(BRCA1-mut): Precancerous lesion from BRCA1 mutation carriers |
| Cervix | 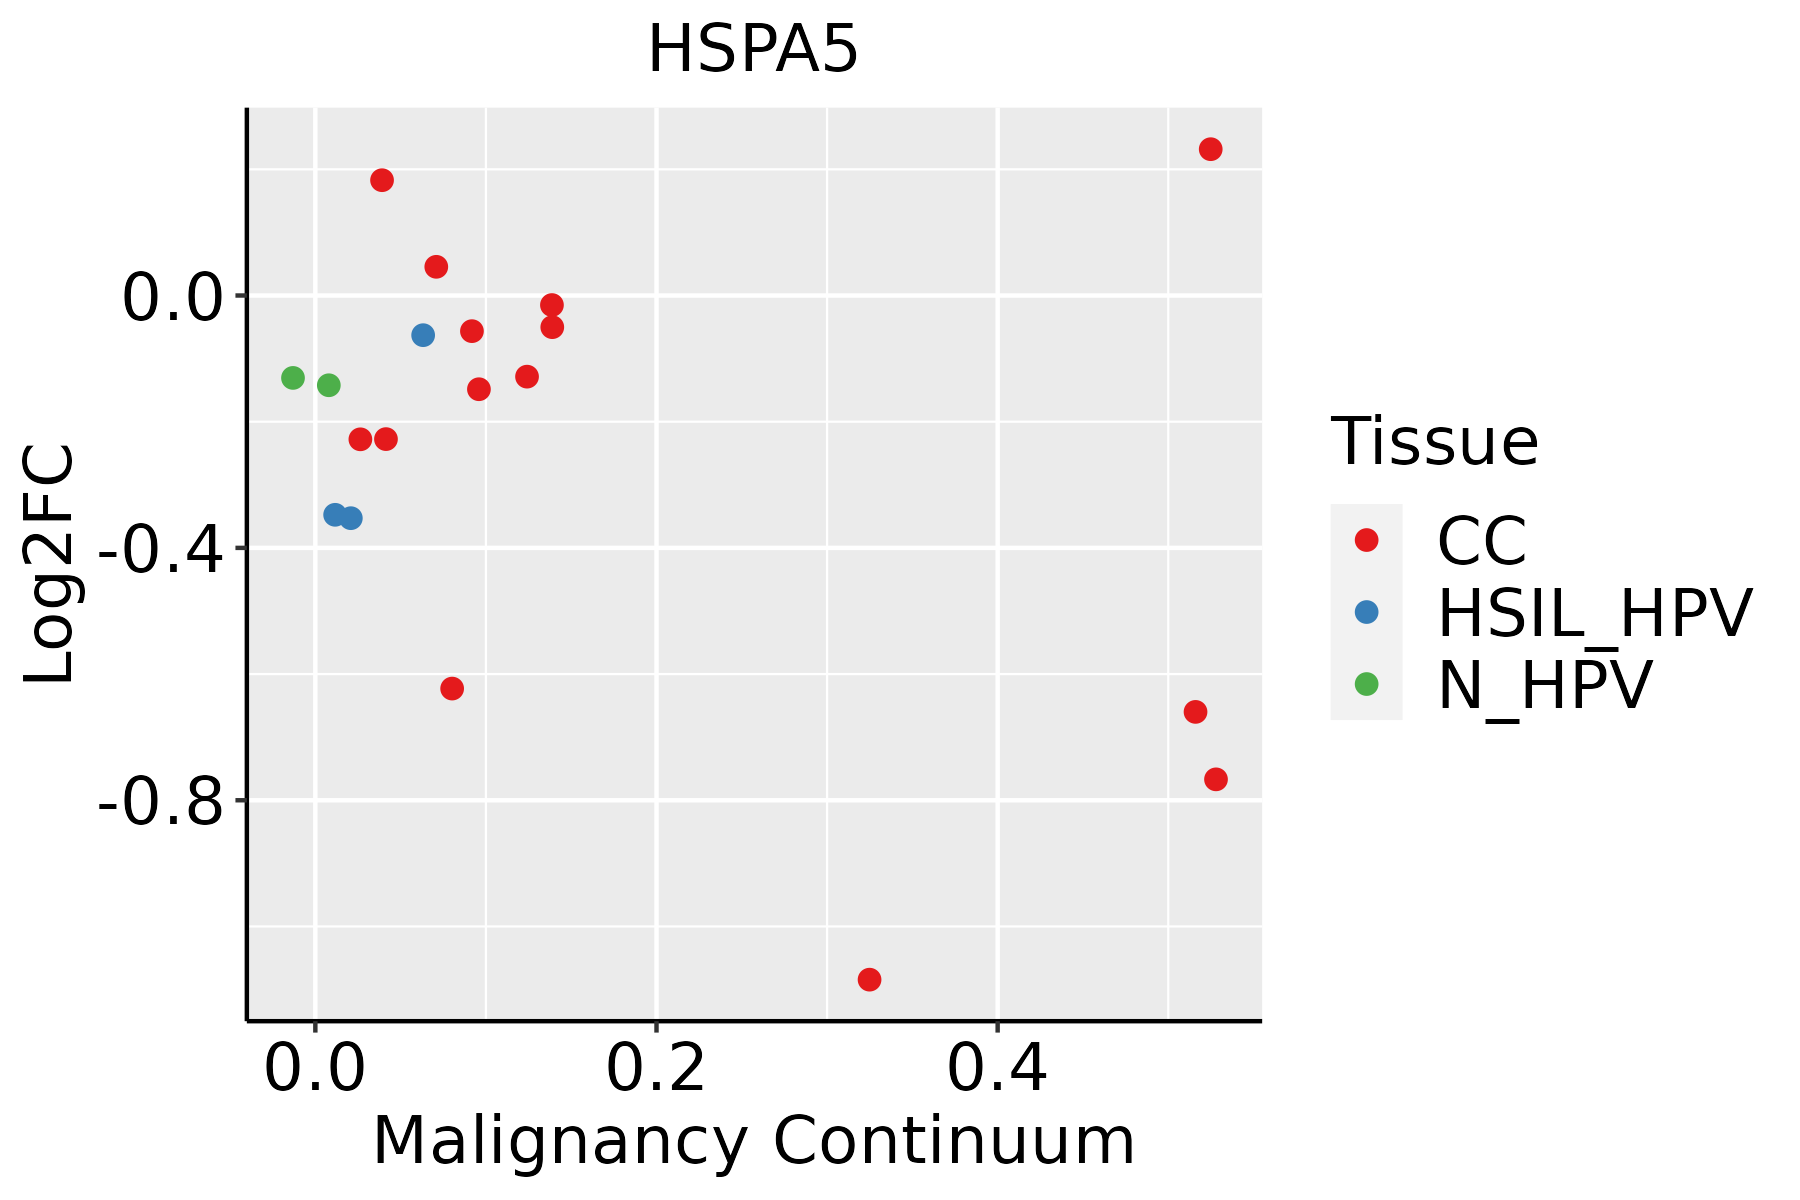 | CC: Cervix cancer |
| HSIL_HPV: HPV-infected high-grade squamous intraepithelial lesions |
| N_HPV: HPV-infected normal cervix |
| Colorectum (GSE201348) |  | FAP: Familial adenomatous polyposis |
| CRC: Colorectal cancer |
| Colorectum (HTA11) |  | AD: Adenomas |
| SER: Sessile serrated lesions |
| MSI-H: Microsatellite-high colorectal cancer |
| MSS: Microsatellite stable colorectal cancer |
| Endometrium |  | AEH: Atypical endometrial hyperplasia |
| EEC: Endometrioid Cancer |
| Esophagus | 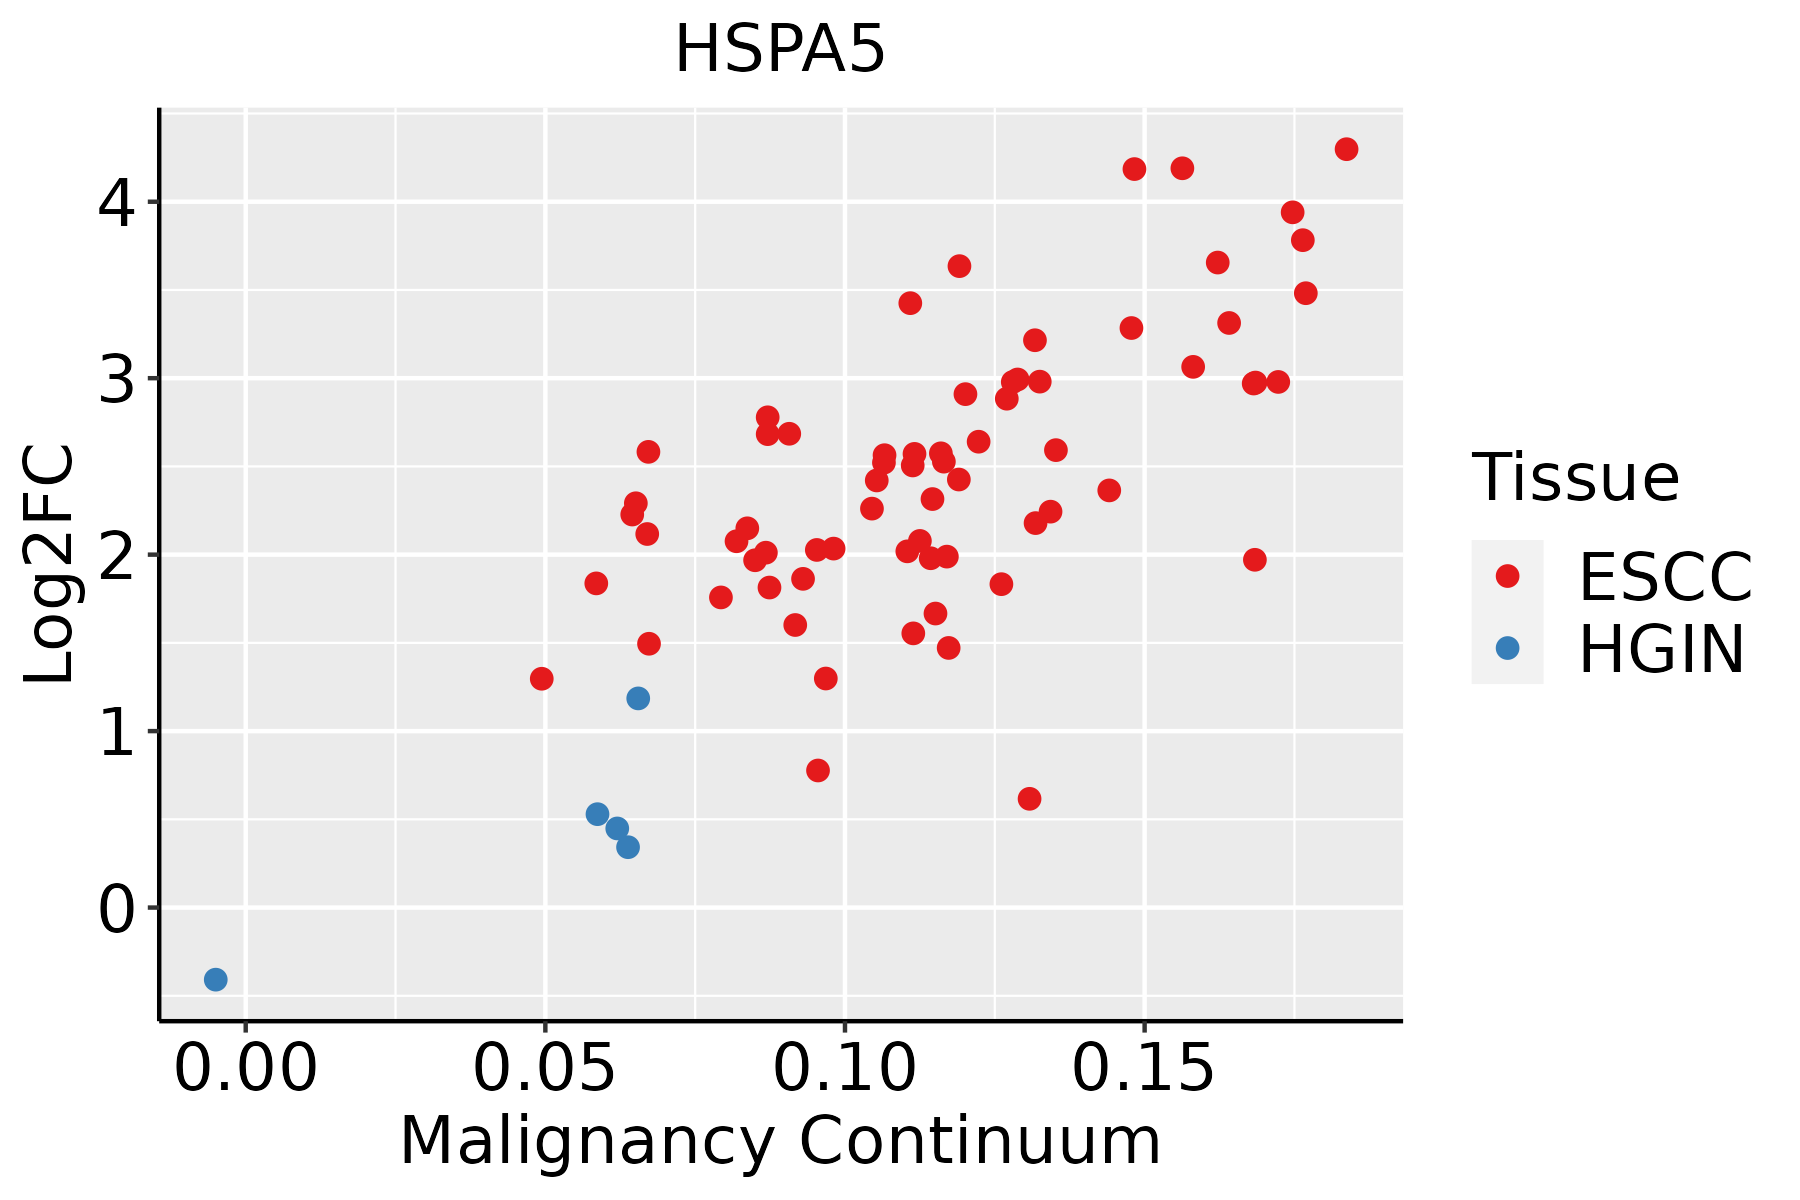 | ESCC: Esophageal squamous cell carcinoma |
| HGIN: High-grade intraepithelial neoplasias |
| LGIN: Low-grade intraepithelial neoplasias |
| GC | 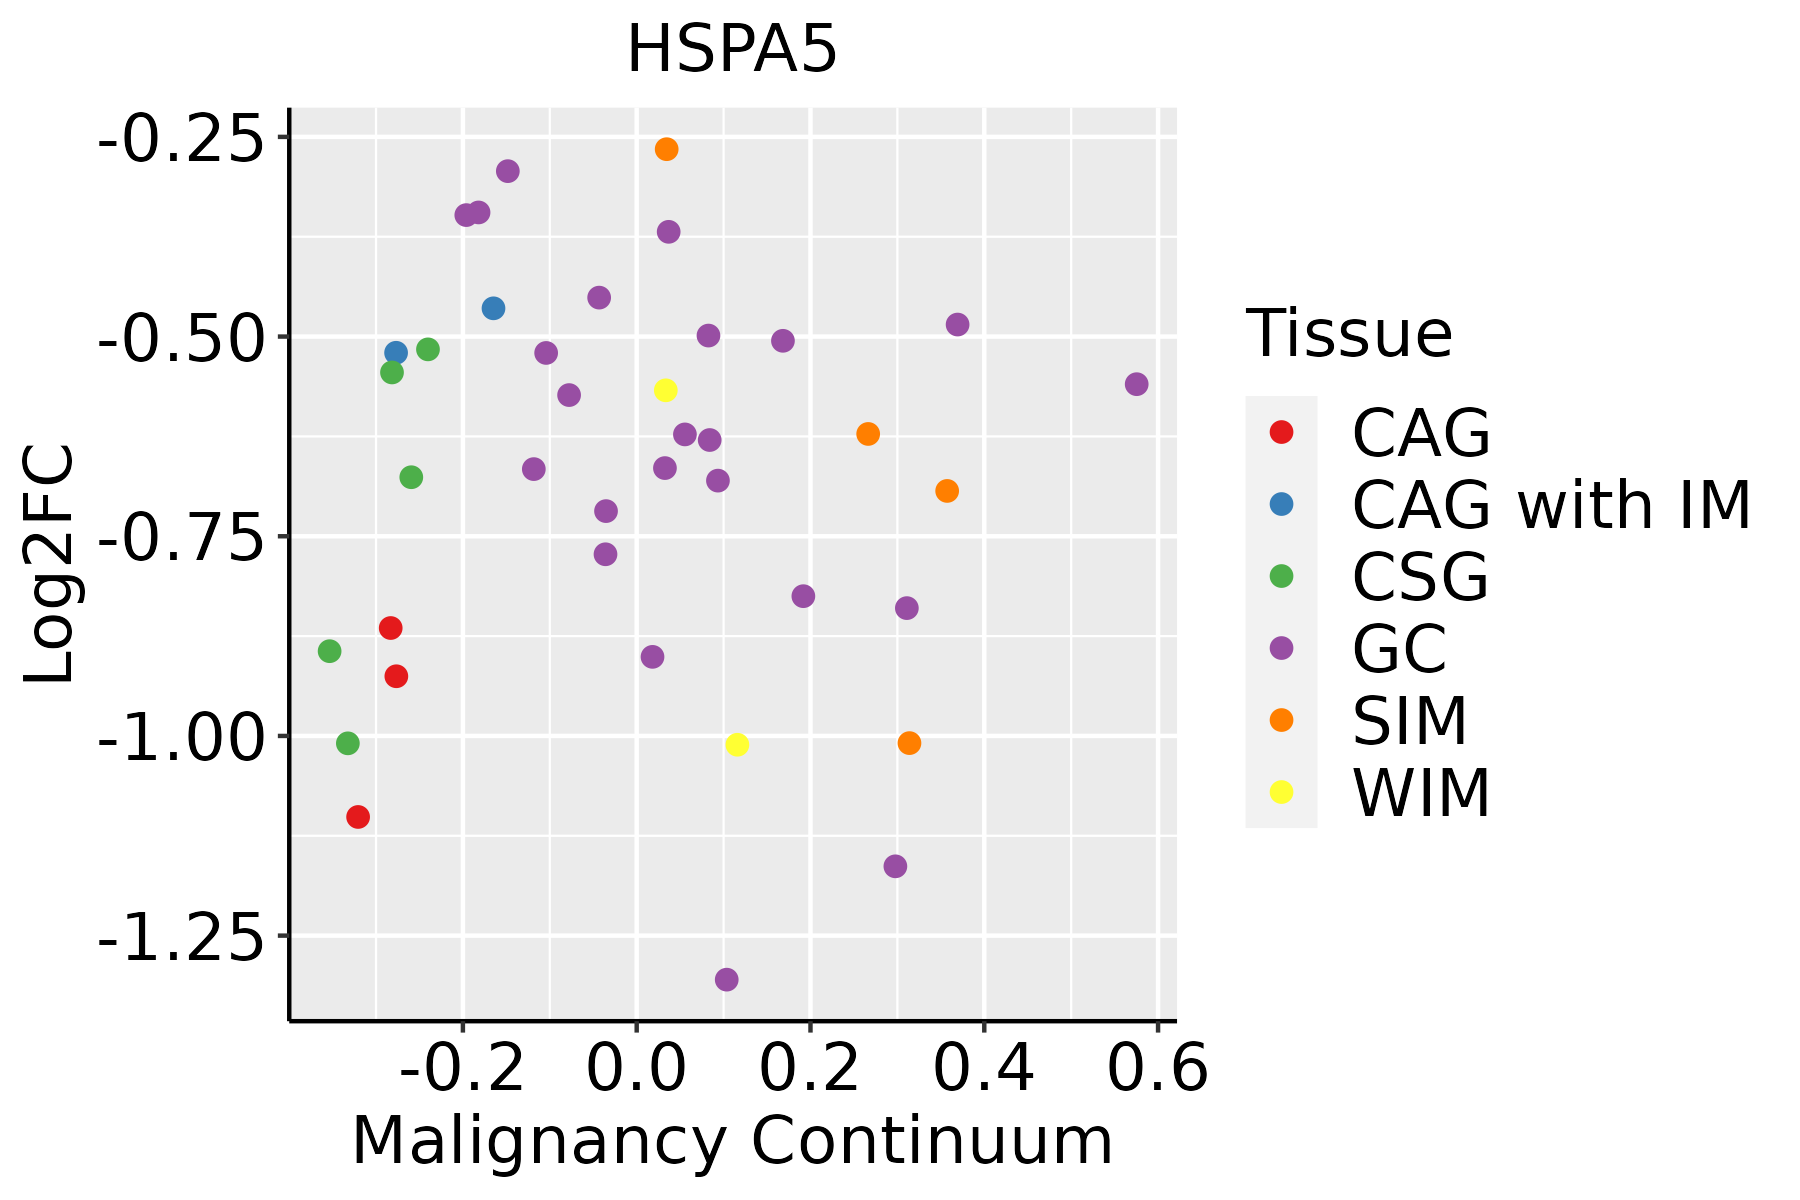 | CAG: Chronic atrophic gastritis |
| CAG with IM: Chronic atrophic gastritis with intestinal metaplasia |
| CSG: Chronic superficial gastritis |
| GC: Gastric cancer |
| SIM: Severe intestinal metaplasia |
| WIM: Wild intestinal metaplasia |
| Liver | 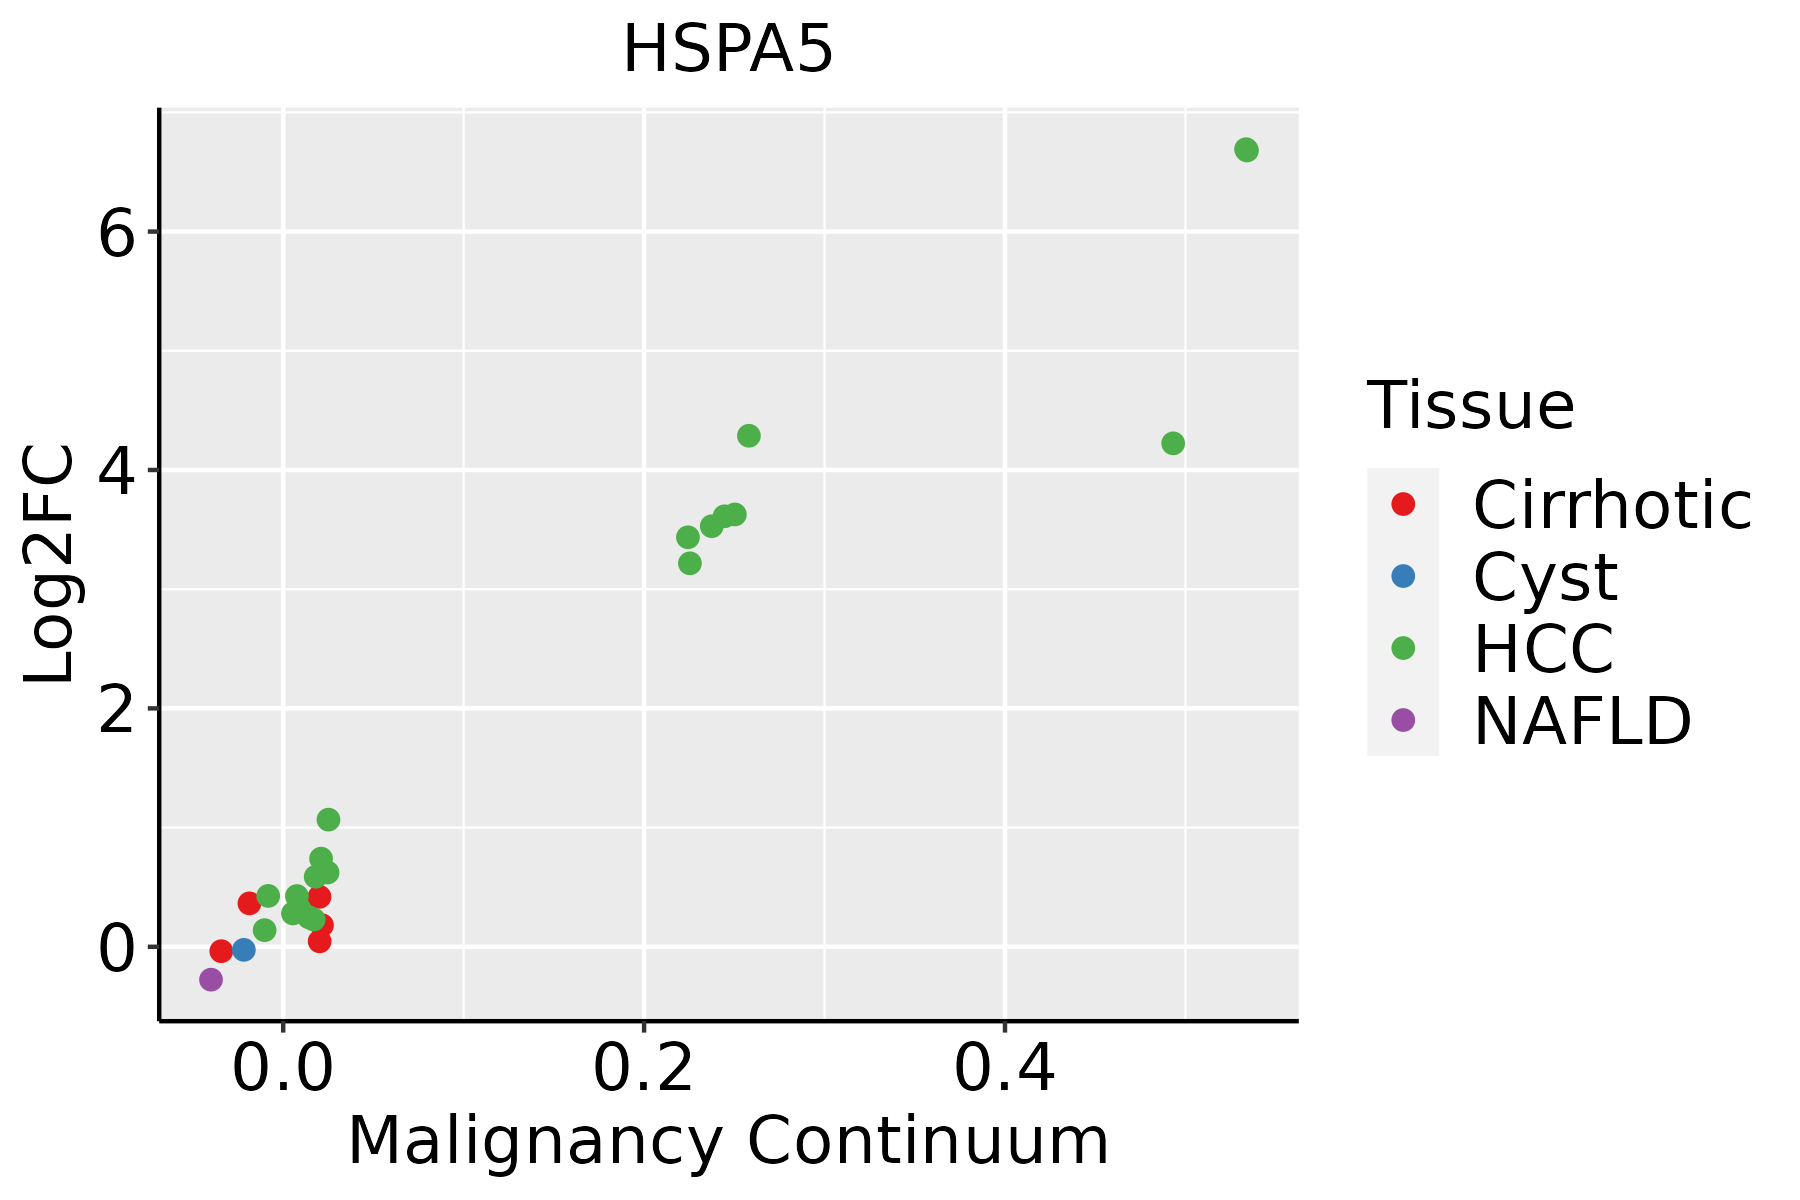 | HCC: Hepatocellular carcinoma |
| NAFLD: Non-alcoholic fatty liver disease |
| Lung | 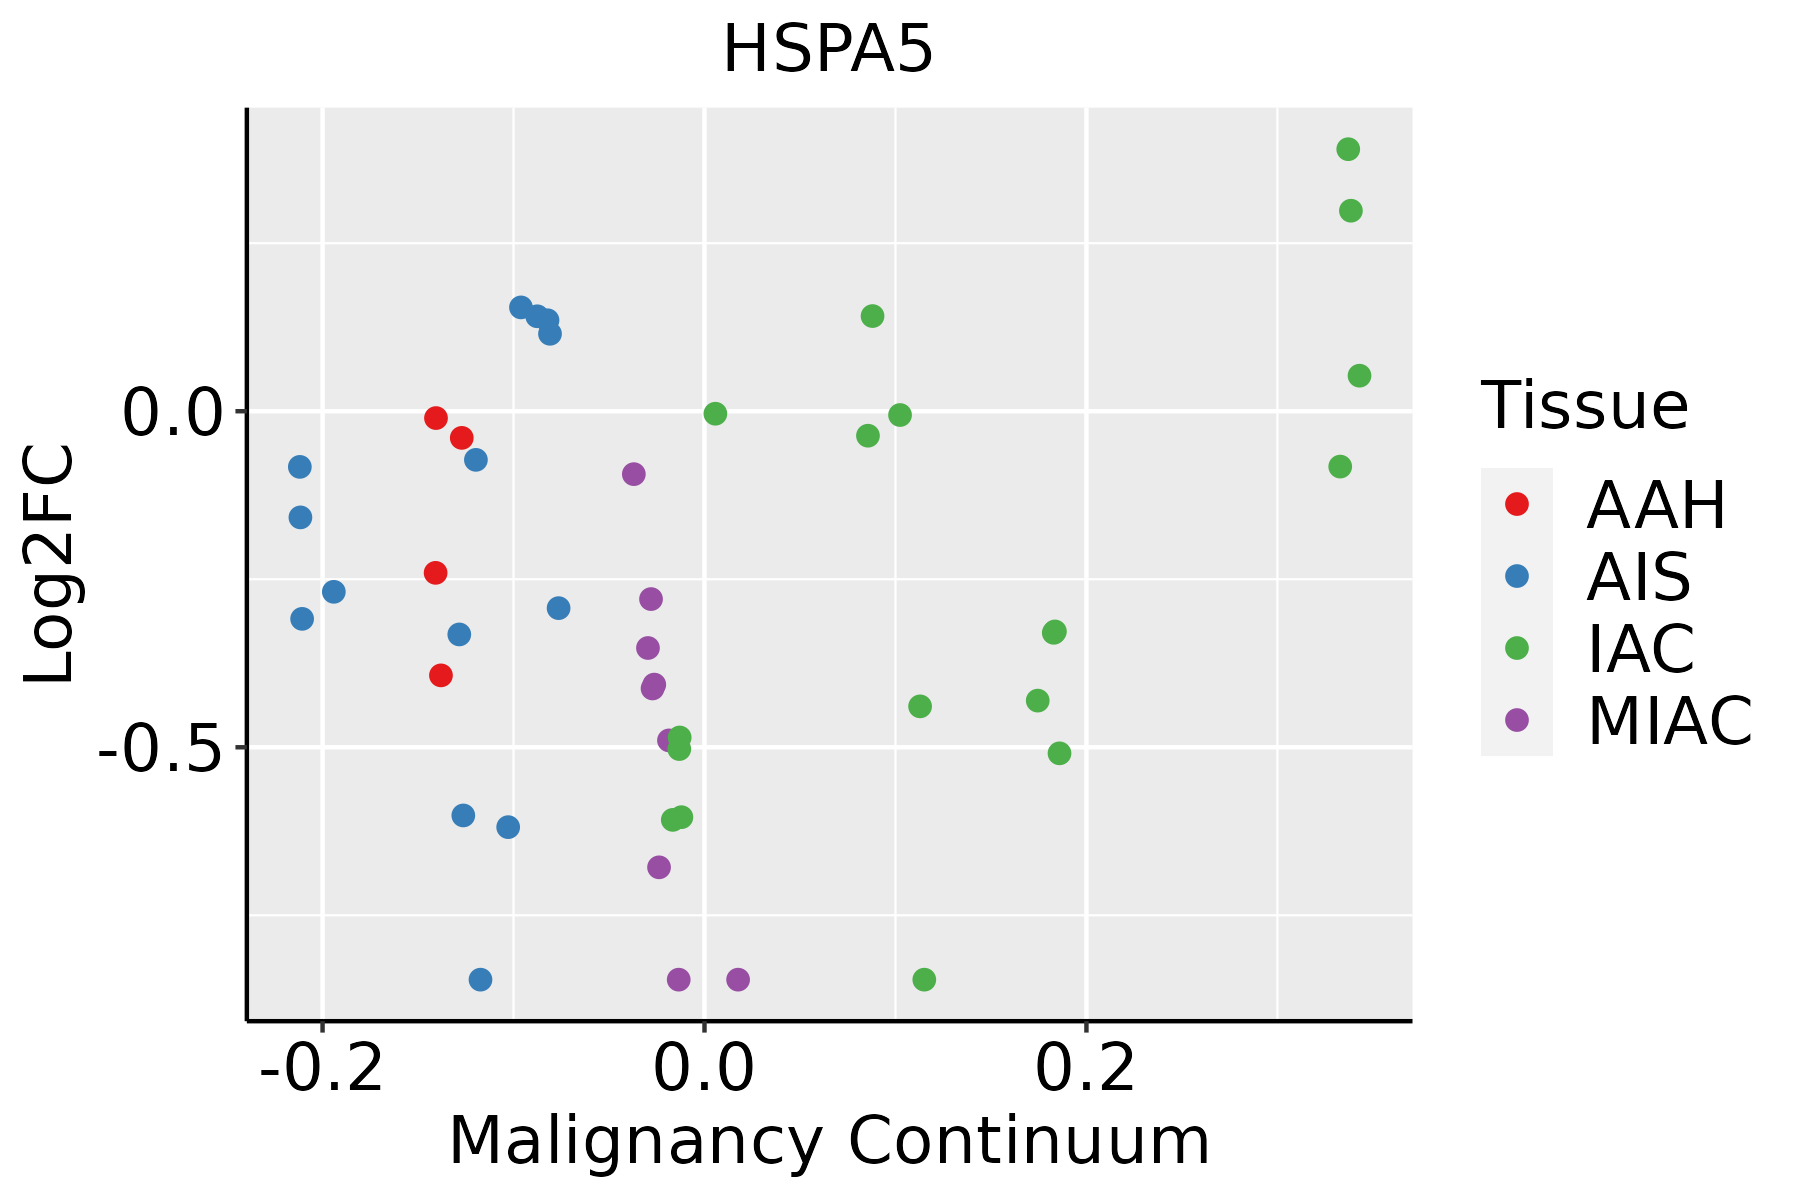 | AAH: Atypical adenomatous hyperplasia |
| AIS: Adenocarcinoma in situ |
| IAC: Invasive lung adenocarcinoma |
| MIA: Minimally invasive adenocarcinoma |
| Oral Cavity | 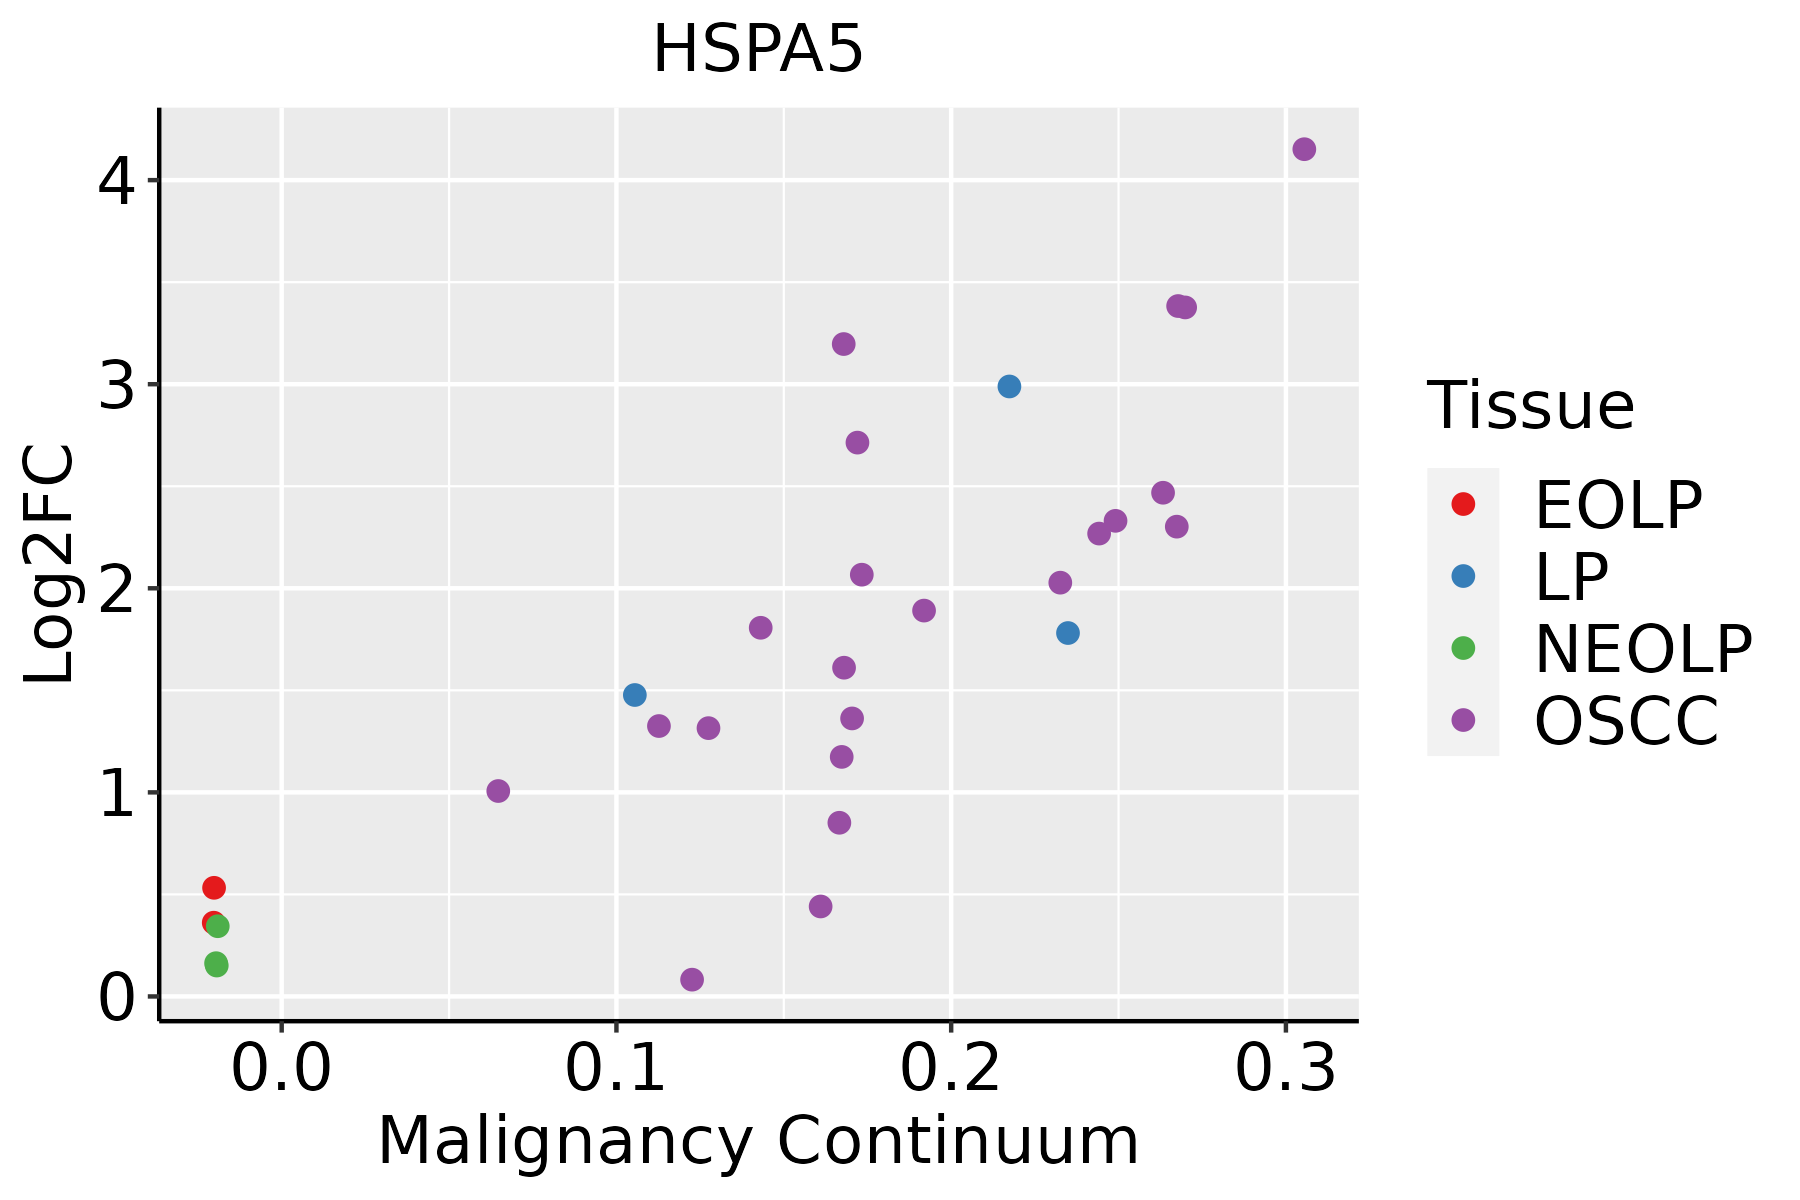 | EOLP: Erosive Oral lichen planus |
| LP: leukoplakia |
| NEOLP: Non-erosive oral lichen planus |
| OSCC: Oral squamous cell carcinoma |
| Prostate |  | BPH: Benign Prostatic Hyperplasia |
| Skin | 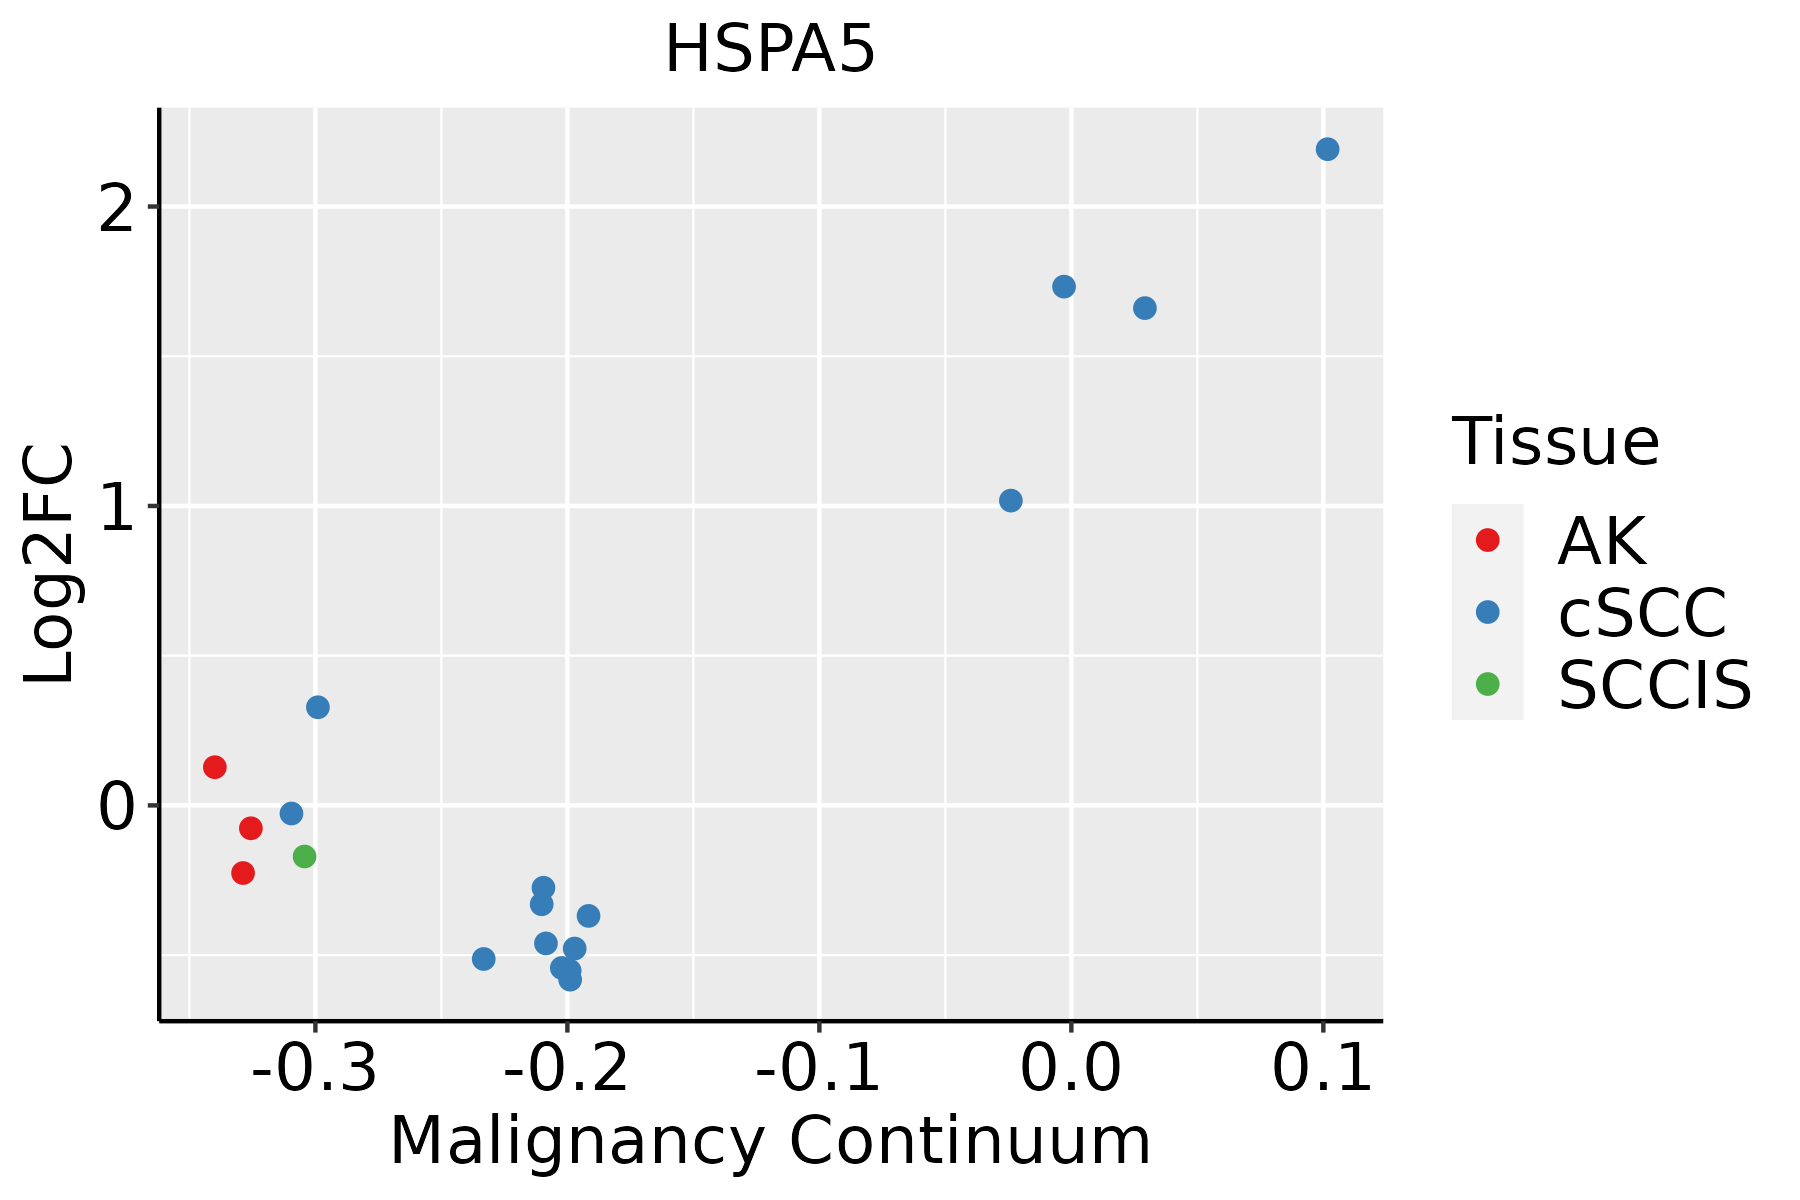 | AK: Actinic keratosis |
| cSCC: Cutaneous squamous cell carcinoma |
| SCCIS:squamous cell carcinoma in situ |
| Thyroid |  | ATC: Anaplastic thyroid cancer |
| HT: Hashimoto's thyroiditis |
| PTC: Papillary thyroid cancer |
| GO ID | Tissue | Disease Stage | Description | Gene Ratio | Bg Ratio | pvalue | p.adjust | Count |
| GO:19001025 | Skin | cSCC | negative regulation of endoplasmic reticulum unfolded protein response | 10/4864 | 15/18723 | 1.10e-03 | 7.24e-03 | 10 |
| GO:00713536 | Skin | cSCC | cellular response to interleukin-4 | 17/4864 | 33/18723 | 1.50e-03 | 9.36e-03 | 17 |
| GO:004885719 | Skin | cSCC | neural nucleus development | 28/4864 | 64/18723 | 1.52e-03 | 9.52e-03 | 28 |
| GO:003497525 | Skin | cSCC | protein folding in endoplasmic reticulum | 8/4864 | 11/18723 | 1.56e-03 | 9.60e-03 | 8 |
| GO:001033222 | Skin | cSCC | response to gamma radiation | 25/4864 | 56/18723 | 1.90e-03 | 1.14e-02 | 25 |
| GO:007148016 | Skin | cSCC | cellular response to gamma radiation | 16/4864 | 31/18723 | 2.00e-03 | 1.19e-02 | 16 |
| GO:000717917 | Skin | cSCC | transforming growth factor beta receptor signaling pathway | 69/4864 | 198/18723 | 3.39e-03 | 1.84e-02 | 69 |
| GO:001097522 | Skin | cSCC | regulation of neuron projection development | 141/4864 | 445/18723 | 3.72e-03 | 1.99e-02 | 141 |
| GO:004667713 | Skin | cSCC | response to antibiotic | 21/4864 | 47/18723 | 4.20e-03 | 2.21e-02 | 21 |
| GO:004668323 | Skin | cSCC | response to organophosphorus | 48/4864 | 131/18723 | 4.49e-03 | 2.30e-02 | 48 |
| GO:00706706 | Skin | cSCC | response to interleukin-4 | 17/4864 | 36/18723 | 4.85e-03 | 2.46e-02 | 17 |
| GO:005123527 | Skin | cSCC | maintenance of location | 106/4864 | 327/18723 | 5.17e-03 | 2.61e-02 | 106 |
| GO:001097613 | Skin | cSCC | positive regulation of neuron projection development | 57/4864 | 163/18723 | 6.66e-03 | 3.24e-02 | 57 |
| GO:19019988 | Skin | cSCC | toxin transport | 18/4864 | 40/18723 | 7.10e-03 | 3.40e-02 | 18 |
| GO:005165128 | Skin | cSCC | maintenance of location in cell | 72/4864 | 214/18723 | 7.37e-03 | 3.47e-02 | 72 |
| GO:19904407 | Skin | cSCC | positive regulation of transcription from RNA polymerase II promoter in response to endoplasmic reticulum stress | 7/4864 | 11/18723 | 9.45e-03 | 4.25e-02 | 7 |
| GO:005159217 | Skin | cSCC | response to calcium ion | 52/4864 | 149/18723 | 9.63e-03 | 4.31e-02 | 52 |
| GO:003600320 | Skin | cSCC | positive regulation of transcription from RNA polymerase II promoter in response to stress | 12/4864 | 24/18723 | 9.91e-03 | 4.35e-02 | 12 |
| GO:00064576 | Stomach | GC | protein folding | 42/1159 | 212/18723 | 1.46e-11 | 3.31e-09 | 42 |
| GO:00432546 | Stomach | GC | regulation of protein-containing complex assembly | 58/1159 | 428/18723 | 1.48e-08 | 1.32e-06 | 58 |
| Pathway ID | Tissue | Disease Stage | Description | Gene Ratio | Bg Ratio | pvalue | p.adjust | qvalue | Count |
| hsa0501218 | Breast | Precancer | Parkinson disease | 99/684 | 266/8465 | 3.58e-42 | 5.65e-40 | 4.33e-40 | 99 |
| hsa0502016 | Breast | Precancer | Prion disease | 95/684 | 273/8465 | 1.39e-37 | 1.46e-35 | 1.12e-35 | 95 |
| hsa0501416 | Breast | Precancer | Amyotrophic lateral sclerosis | 98/684 | 364/8465 | 2.13e-28 | 8.41e-27 | 6.44e-27 | 98 |
| hsa0502216 | Breast | Precancer | Pathways of neurodegeneration - multiple diseases | 112/684 | 476/8465 | 6.96e-27 | 2.44e-25 | 1.87e-25 | 112 |
| hsa0414118 | Breast | Precancer | Protein processing in endoplasmic reticulum | 33/684 | 174/8465 | 2.78e-06 | 3.83e-05 | 2.94e-05 | 33 |
| hsa0541718 | Breast | Precancer | Lipid and atherosclerosis | 37/684 | 215/8465 | 7.64e-06 | 9.29e-05 | 7.12e-05 | 37 |
| hsa0461218 | Breast | Precancer | Antigen processing and presentation | 19/684 | 78/8465 | 9.61e-06 | 1.12e-04 | 8.62e-05 | 19 |
| hsa030609 | Breast | Precancer | Protein export | 6/684 | 23/8465 | 8.34e-03 | 4.54e-02 | 3.48e-02 | 6 |
| hsa0501219 | Breast | Precancer | Parkinson disease | 99/684 | 266/8465 | 3.58e-42 | 5.65e-40 | 4.33e-40 | 99 |
| hsa0502017 | Breast | Precancer | Prion disease | 95/684 | 273/8465 | 1.39e-37 | 1.46e-35 | 1.12e-35 | 95 |
| hsa0501417 | Breast | Precancer | Amyotrophic lateral sclerosis | 98/684 | 364/8465 | 2.13e-28 | 8.41e-27 | 6.44e-27 | 98 |
| hsa0502217 | Breast | Precancer | Pathways of neurodegeneration - multiple diseases | 112/684 | 476/8465 | 6.96e-27 | 2.44e-25 | 1.87e-25 | 112 |
| hsa0414119 | Breast | Precancer | Protein processing in endoplasmic reticulum | 33/684 | 174/8465 | 2.78e-06 | 3.83e-05 | 2.94e-05 | 33 |
| hsa0541719 | Breast | Precancer | Lipid and atherosclerosis | 37/684 | 215/8465 | 7.64e-06 | 9.29e-05 | 7.12e-05 | 37 |
| hsa0461219 | Breast | Precancer | Antigen processing and presentation | 19/684 | 78/8465 | 9.61e-06 | 1.12e-04 | 8.62e-05 | 19 |
| hsa0306012 | Breast | Precancer | Protein export | 6/684 | 23/8465 | 8.34e-03 | 4.54e-02 | 3.48e-02 | 6 |
| hsa0501224 | Breast | IDC | Parkinson disease | 107/867 | 266/8465 | 2.57e-39 | 8.36e-37 | 6.26e-37 | 107 |
| hsa0502023 | Breast | IDC | Prion disease | 102/867 | 273/8465 | 3.70e-34 | 4.01e-32 | 3.00e-32 | 102 |
| hsa0501423 | Breast | IDC | Amyotrophic lateral sclerosis | 102/867 | 364/8465 | 1.29e-22 | 5.22e-21 | 3.91e-21 | 102 |
| hsa0502223 | Breast | IDC | Pathways of neurodegeneration - multiple diseases | 116/867 | 476/8465 | 3.63e-20 | 1.18e-18 | 8.82e-19 | 116 |
| Hugo Symbol | Variant Class | Variant Classification | dbSNP RS | HGVSc | HGVSp | HGVSp Short | SWISSPROT | BIOTYPE | SIFT | PolyPhen | Tumor Sample Barcode | Tissue | Histology | Sex | Age | Stage | Therapy Types | Drugs | Outcome |
| HSPA5 | SNV | Missense_Mutation | | c.887N>C | p.Lys296Thr | p.K296T | P11021 | protein_coding | deleterious_low_confidence(0) | probably_damaging(0.997) | TCGA-A8-A08Z-01 | Breast | breast invasive carcinoma | Female | >=65 | III/IV | Unknown | Unknown | SD |
| HSPA5 | SNV | Missense_Mutation | | c.211N>A | p.Glu71Lys | p.E71K | P11021 | protein_coding | deleterious_low_confidence(0.03) | benign(0.02) | TCGA-AC-A2B8-01 | Breast | breast invasive carcinoma | Female | >=65 | I/II | Chemotherapy | chemo | PD |
| HSPA5 | SNV | Missense_Mutation | novel | c.414N>T | p.Lys138Asn | p.K138N | P11021 | protein_coding | deleterious_low_confidence(0) | possibly_damaging(0.902) | TCGA-AN-A046-01 | Breast | breast invasive carcinoma | Female | >=65 | I/II | Unknown | Unknown | SD |
| HSPA5 | SNV | Missense_Mutation | rs368840257 | c.1595G>A | p.Arg532His | p.R532H | P11021 | protein_coding | deleterious_low_confidence(0) | probably_damaging(0.956) | TCGA-AN-A0AK-01 | Breast | breast invasive carcinoma | Female | >=65 | I/II | Unknown | Unknown | SD |
| HSPA5 | SNV | Missense_Mutation | | c.1540N>C | p.Glu514Gln | p.E514Q | P11021 | protein_coding | tolerated_low_confidence(0.24) | probably_damaging(0.982) | TCGA-D8-A1JA-01 | Breast | breast invasive carcinoma | Female | <65 | III/IV | Chemotherapy | adriamycin | PD |
| HSPA5 | SNV | Missense_Mutation | rs191087735 | c.395N>C | p.Ile132Thr | p.I132T | P11021 | protein_coding | tolerated_low_confidence(0.13) | benign(0.012) | TCGA-E2-A56Z-01 | Breast | breast invasive carcinoma | Female | >=65 | I/II | Hormone Therapy | arimidex | SD |
| HSPA5 | SNV | Missense_Mutation | novel | c.433N>G | p.Ile145Val | p.I145V | P11021 | protein_coding | tolerated_low_confidence(0.38) | benign(0.011) | TCGA-S3-AA12-01 | Breast | breast invasive carcinoma | Female | >=65 | III/IV | Hormone Therapy | anastrozole | SD |
| HSPA5 | SNV | Missense_Mutation | rs762582529 | c.971N>A | p.Arg324Gln | p.R324Q | P11021 | protein_coding | deleterious_low_confidence(0.03) | benign(0.368) | TCGA-2W-A8YY-01 | Cervix | cervical & endocervical cancer | Female | <65 | I/II | Chemotherapy | cisplatin | CR |
| HSPA5 | SNV | Missense_Mutation | | c.1712N>A | p.Ser571Tyr | p.S571Y | P11021 | protein_coding | tolerated_low_confidence(0.05) | benign(0.114) | TCGA-CA-6718-01 | Colorectum | colon adenocarcinoma | Male | <65 | I/II | Unknown | Unknown | PD |
| HSPA5 | SNV | Missense_Mutation | novel | c.949N>T | p.Asp317Tyr | p.D317Y | P11021 | protein_coding | deleterious_low_confidence(0) | probably_damaging(1) | TCGA-AG-3892-01 | Colorectum | rectum adenocarcinoma | Female | <65 | I/II | Unknown | Unknown | SD |
| Entrez ID | Symbol | Category | Interaction Types | Drug Claim Name | Drug Name | PMIDs |
| 3309 | HSPA5 | TRANSPORTER, ENZYME, PROTEASE INHIBITOR, CELL SURFACE, DRUGGABLE GENOME | | STROBOPININ | STROBOPININ | |
| 3309 | HSPA5 | TRANSPORTER, ENZYME, PROTEASE INHIBITOR, CELL SURFACE, DRUGGABLE GENOME | | TCMDC-123749 | CHEMBL524376 | |
| 3309 | HSPA5 | TRANSPORTER, ENZYME, PROTEASE INHIBITOR, CELL SURFACE, DRUGGABLE GENOME | | NORGESTREL | NORGESTREL | |
| 3309 | HSPA5 | TRANSPORTER, ENZYME, PROTEASE INHIBITOR, CELL SURFACE, DRUGGABLE GENOME | | MIANSERIN | MIANSERIN | |
| 3309 | HSPA5 | TRANSPORTER, ENZYME, PROTEASE INHIBITOR, CELL SURFACE, DRUGGABLE GENOME | | AG-490 | CHEMBL56543 | |
| 3309 | HSPA5 | TRANSPORTER, ENZYME, PROTEASE INHIBITOR, CELL SURFACE, DRUGGABLE GENOME | | CHLORQUINALDOL | CHLORQUINALDOL | |
| 3309 | HSPA5 | TRANSPORTER, ENZYME, PROTEASE INHIBITOR, CELL SURFACE, DRUGGABLE GENOME | | SAM-6 | | |
| 3309 | HSPA5 | TRANSPORTER, ENZYME, PROTEASE INHIBITOR, CELL SURFACE, DRUGGABLE GENOME | | 5-NITRO-2-PHENYLPROPYLAMINOBENZOIC ACID [NPPB] | 5-NITRO-2-PHENYLPROPYLAMINOBENZOIC ACID [NPPB] | |
| 3309 | HSPA5 | TRANSPORTER, ENZYME, PROTEASE INHIBITOR, CELL SURFACE, DRUGGABLE GENOME | | THAPSIGARGIN | THAPSIGARGIN | |
| 3309 | HSPA5 | TRANSPORTER, ENZYME, PROTEASE INHIBITOR, CELL SURFACE, DRUGGABLE GENOME | | NKP-1339 | IT-139 | |


